Invesco QQQ ETF (QQQ)
Key Statistics
Minor Support Level 203.42 Minor Resistance Level 243.59
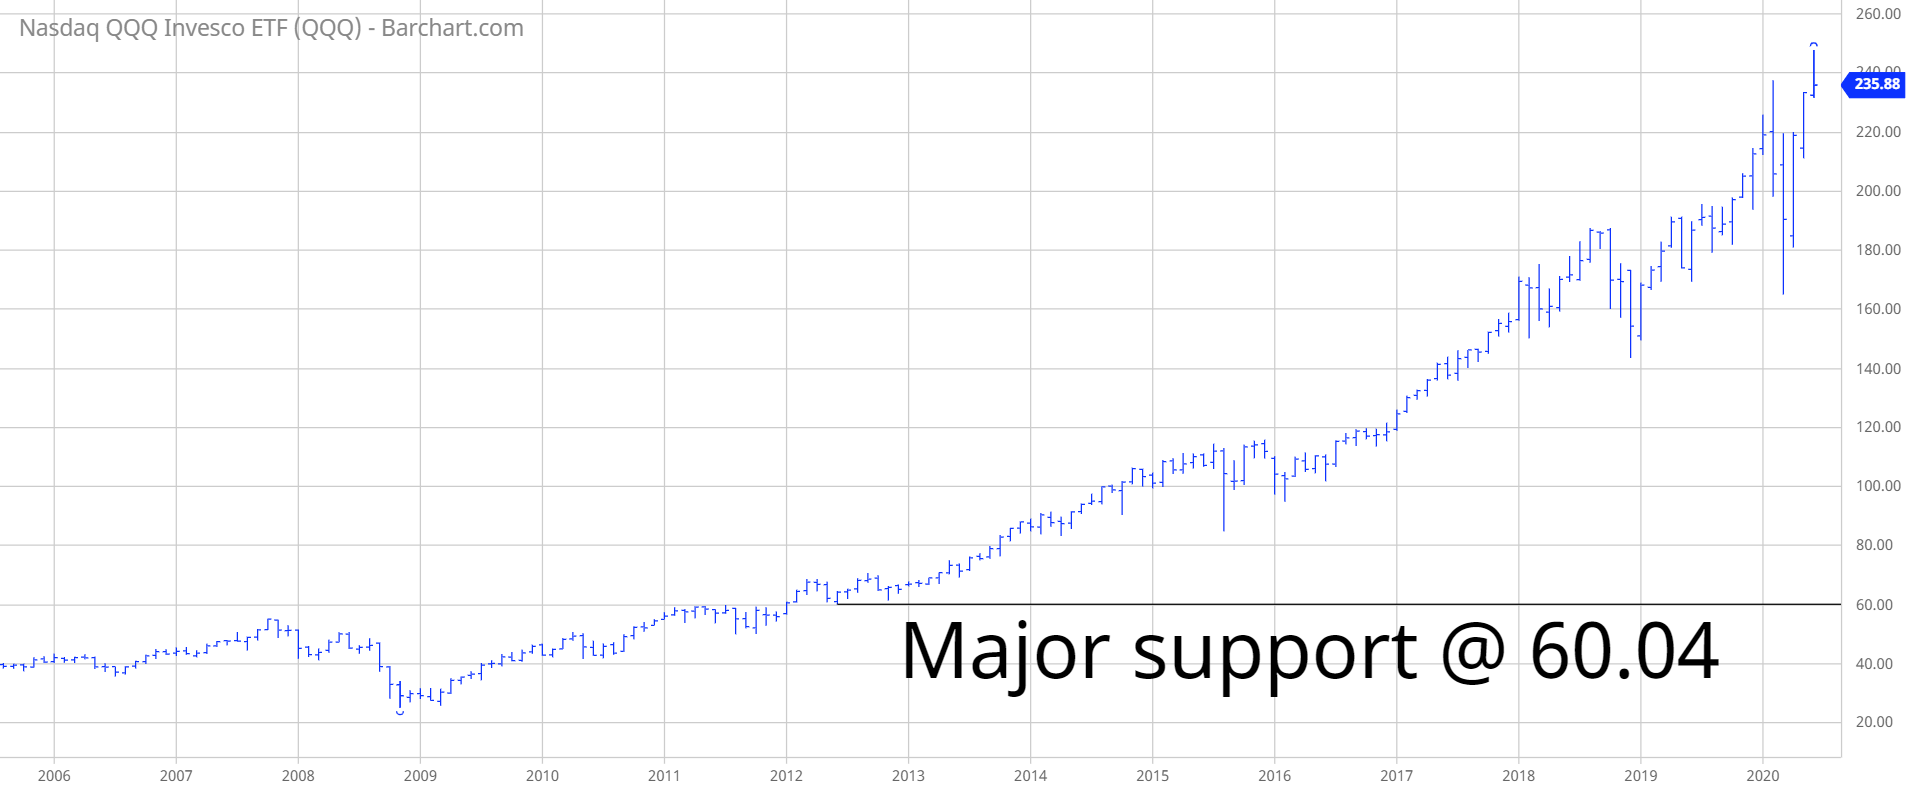
Thank you for reading this post, don't forget to subscribe!Major Support Level 60.04 Major Resistance Level 267.47
Minor Buy Signal 247.81 Minor Sell Signal 196.17
Major Buy Signal 279.63 Major Sell Signal 49.93
BRIEF OVERVIEW – QQQ
Arguably, Martin E Zweig was the most famous stock market technician of the 20th century. Zweig’s success as an investor can probably be attributed to the fact his indicators were based on technical analysis as well as fundamental analysis. Zweig owned one of the largest databases of historical stock market information in the world. The vast majority of Zweig’s research was conducted in the 1970s, long before desktop computers were available. Throughout the 1970s and 1980s, Zweig developed some of the most reliable stock market indicators. These indicators are still used today by many world class traders and investors.
The majority of Zweig’s indicators were based on the put/call ratio, Federal Reserve interest rate policy, money supply, moving averages, advancing volume versus declining volume, seasonal analysis and sentiment measurements.
In 1986, Zweig released one of the most popular books ever written on the subject of stock market investing. The title of the book was Winning on Wall Street. In the book, Zweig meticulously described all of his most profitable indicators. His book was considered the “bible” of stock market investing within the investment community. A few years after the book was released, Zweig was asked to write an updated version. The second edition of the book was released in 1997.
Without question, Zweig’s most famous indicator was the Zweig Breadth Thrust Indicator. Zweig began tracking the indicator in the early 1970s. What is the Breadth Thrust Indicator? It calculates the number of advancing stocks on the NYSE versus the number of declining stocks. These daily numbers are displayed in a percentage format using a 10-day simple moving average (SMA). Formula = Advancing Stocks / (Advancing Stocks + Declining Stocks). Please review the table.
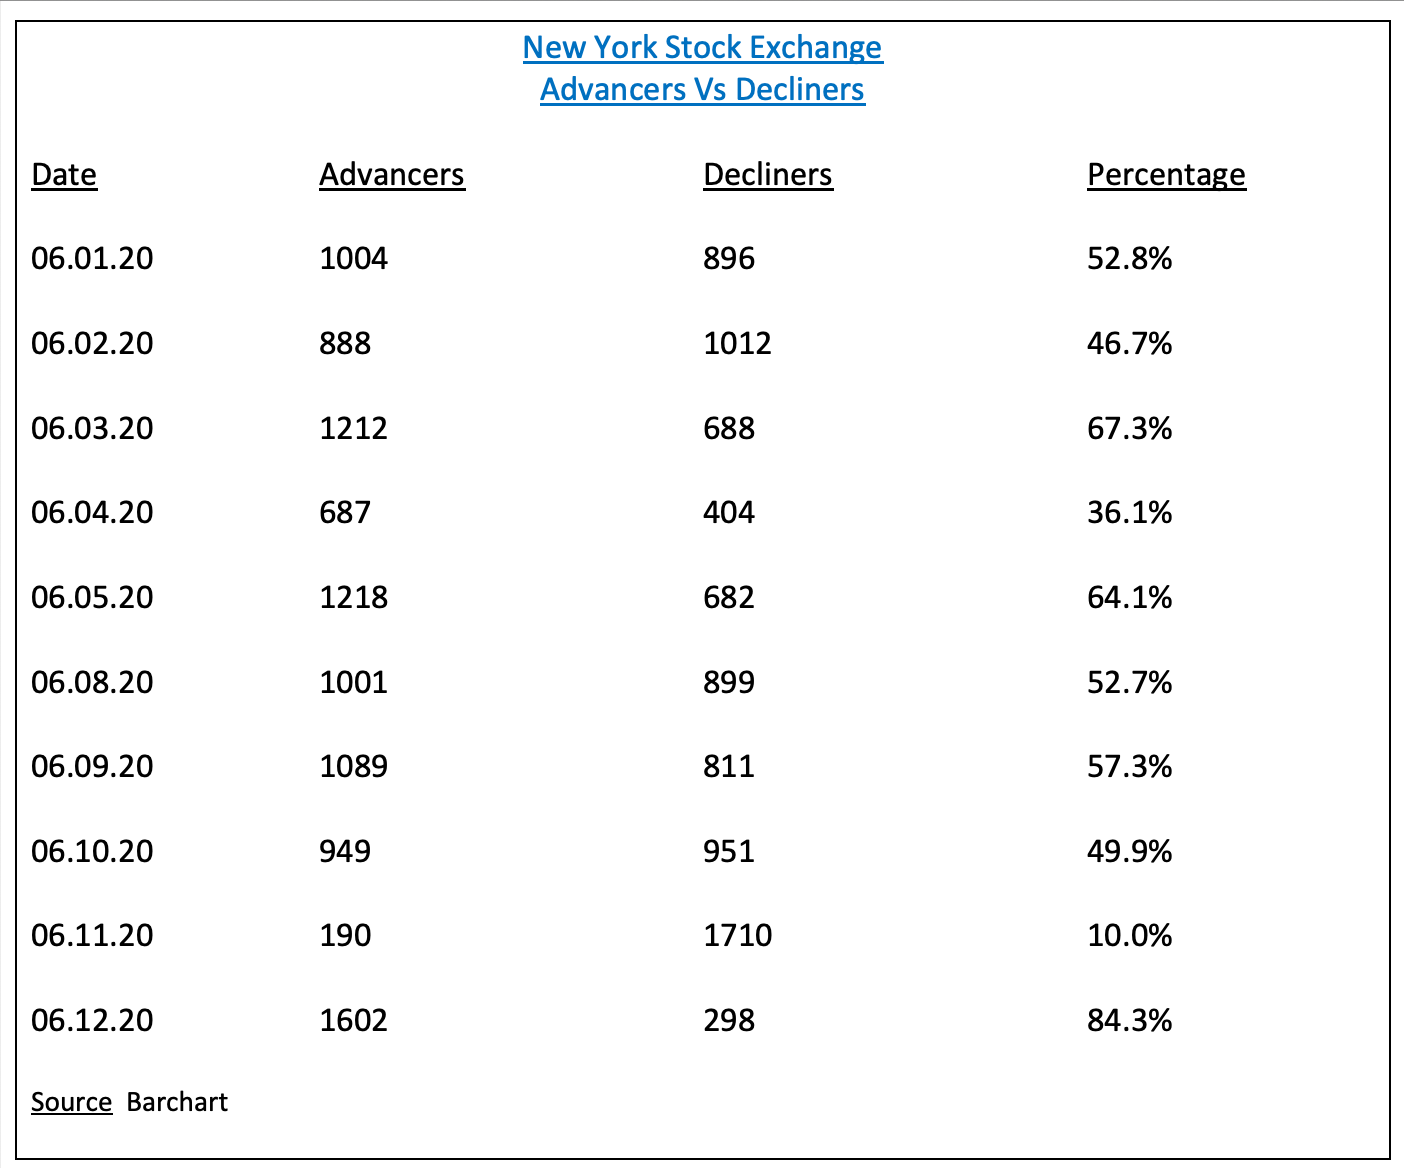
A buy signal requires the 10-day SMA to be below 40%. A buy signal is officially generated when the 10-day SMA climbs above 61.5%, as long as the starting point is below 40%.
The Zweig Breadth Thrust Indicator has been incredibly accurate over the course of the past five decades. In fact, the indicator has never experienced a losing trade since Zweig began tracking the results beginning in 1971. Please review the table.
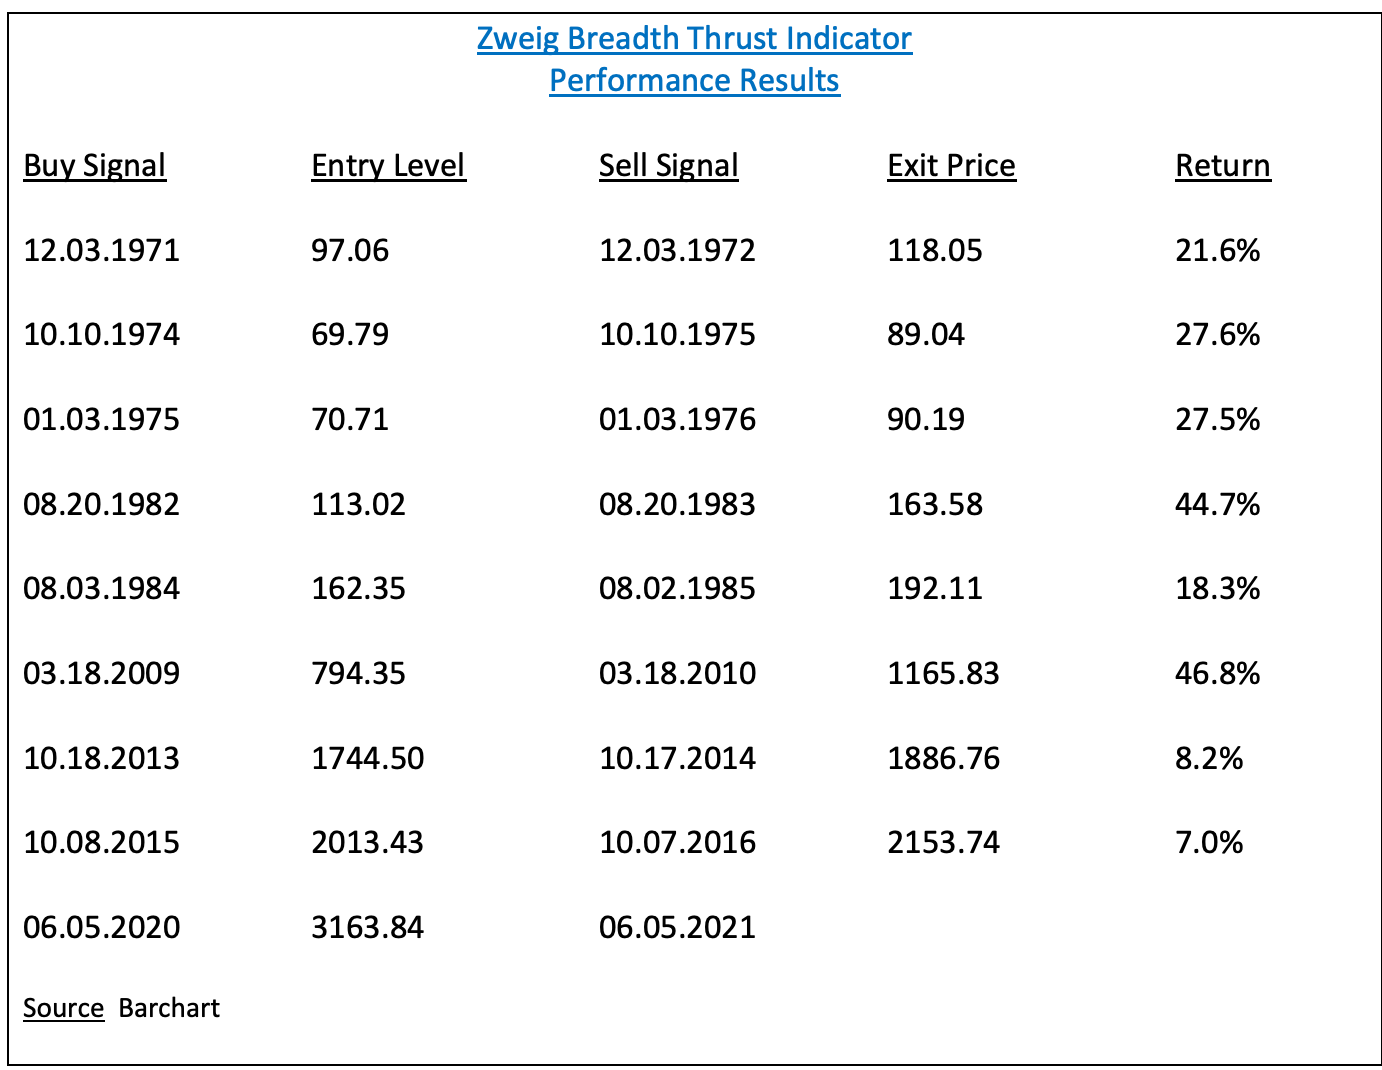
You will notice that the indicator had an extremely long “dry spell” throughout the 1990s and 2000s. There was absolutely no activity from 1984 through 2009 (25 years). A buy signal was finally generated a March 2009, which turned out to mark the exact bottom of the Great Financial Crisis. Please review the attached chart.
For the first time in almost five years, the Zweig Breadth Thrust Indicator produced a stock market buy signal on 5 June. Based on this indicator, we can expect higher stock prices over the course of the next 12 months.
In an effort to provide investors with exposure to the NASDAQ-100, the PowerShares family of exchange traded funds launched the Invesco QQQ ETF on 10 March 1999, using the ticker symbol QQQ. This ETF allows investors the opportunity to track the performance of the NASDAQ-100. Although the index consists of 100 different companies, QQQ is comprised of 104 different securities. This discrepancy exists because three of the companies within the NASDAQ-100 have more than one class of common stock. These companies include Alphabet, Comcast and Facebook. The five largest holdings within QQQ are Microsoft, Apple, Amazon, Alphabet “C” and Facebook “A.” These stocks have a substantial impact on the overall performance of QQQ because they represent approximately 40% of the overall value of the ETF.
SHORT-TERM VIEW – QQQ
QQQ has enjoyed a massive rally during past ten weeks. From 23 March through 10 June, QQQ advanced 50.2%. This is a spectacular rally, particularly considering the fact that the entire global economy was locked down due to COVID-19. The bulls are in complete control of the short-term momentum. The next level of resistance is 243.59. In order to regain the upper hand, the bears need a weekly close below 203.42. At least for now, the most likely scenario is a continuation of higher prices.
LONG-TERM VIEW – QQQ
Arguably, the NASDAQ-100 is the most volatile stock index in North America. Why? Because the index consists primarily of technology stocks. Based on historical results, technology companies generate the most volatile and unpredictable revenue streams. Consequently, it’s very difficult for financial analysts to accurately forecast quarterly earnings results. Technology is constantly changing. This explains why these companies are difficult to analyze from a financial perspective.
During the past 6 years, the FANG stocks have been responsible for leading the NASDAQ-100 to sharply higher prices. For those of you who are not familiar with the acronym, FANG consists of Facebook, Amazon, Netflix and Google. Twelve months ago, many Wall Street analysts were concerned that the index could be on the verge of rolling over to the downside. Why? Because FANG was underperforming the remaining stocks within the index. However, during the past few months, the FANG stocks have exploded to the upside. Ironically, the global pandemic was actually bullish for many technology stocks like Facebook, Amazon, Netflix and Google. These stocks have actually benefitted from shutting down the global economy.
For the first time in the history of the index, the NASDAQ-100 exceeded the 10,000 level on 10 June. Based on the Zweig Breadth Thrust Indicator, we can expect a rising stock market during the next 12 months. The global pandemic has forced many businesses to reduce costs and improve worker productivity. Going forward, this will be incredibly bullish for technology stocks.
In terms of QQQ, the long-term trend is definitely bullish. In fact, the long-term momentum has been bullish for the better part of the past decade. Despite the recent decline in response to the global pandemic, the momentum still remains bullish. The bears need a weekly close below 60.04 in order to reverse the bullish momentum. Highly unlikely.
SHORT-TERM CHART – QQQ
Please review the 9-month chart of QQQ. In terms of the short-term chart pattern, the ETF has been pushing its way higher since 23 March. There was a brutal decline in February in response to COVID-19. However, the bulls managed to quickly re-establish the upward bias. The next level of resistance is 243.59. In order to regain the upper hand, the bears need a weekly close below 203.42.

LONG-TERM CHART – QQQ
Please review the 15-year chart of QQQ. The long-term chart pattern has been continuously bullish since November 2008. This is one of the most bullish chart patterns within the entire ETF universe. At least for now, the bears have very little chance to push the chart pattern in their favor. A weekly close below 60.04 will reverse the trend from bullish too bearish. Highly unlikely.