SPDR Dow Jones Industrial Average ETF (DIA)
Key Statistics – DIA
Thank you for reading this post, don't forget to subscribe!
Minor Support Level 326.68 Minor Resistance Level 356.60
Major Support Level 112.14 Major Resistance Level 366.69
Minor Buy Signal 361.13 Minor Sell Signal 320.62
Major Buy Signal 376.33 Major Sell Signal 101.33
BRIEF OVERVIEW – DIA
Arguably, Peter Thiel is the most successful entrepreneur of the twenty-first century. Thiel has been involved in more successful start-up companies than any other person in modern American history. Thiel is most well known for his involvement in PayPal. He was primarily responsible for the early-stage development and subsequent success of the company. In addition to PayPal, Thiel actively participated in the initial launch of Facebook and LinkedIn. Thiel is also an incredibly successful hedge fund manager and venture capitalist. He is currently involved in Palantir Technologies, which was launched in 2004.
A few weeks ago, Palantir caused quite a stir within the global investment community by announcing a $50 million investment in 100-ounce gold bars. Why did this announcement unleash a wave of “doom and gloom” forecasts among professional investors? Before, we answer this question, let’s discuss Palantir’s main source of revenue. Palantir Technologies is a publicly traded company involved in the collection of big data. Palantir is hired by some of the world’s most powerful government agencies and multi-billion dollar corporations to collect and analyze big data. Palantir searches for meaningful patterns within the data in an effort to forecast future economic and geopolitical events.
This explains why professional investors and the financial media were so intrigued by Palantir’s gold investment. During the past few weeks, several high profile investors have publicly stated that Palantir is preparing for some type of “black swan” event by heavily investing in physical gold. They claim that Palantir’s research team has discovered a disturbing pattern while analyzing big data on behalf of its clients. Is Palantir anticipating an economic collapse? Of course, it’s impossible to accurately answer this question. However, it is rather disturbing that the company recently purchased several thousand ounces of physical gold. In its 17-year history, Palantir has never purchased physical gold. Therefore, the company is probably expecting an economic or geopolitical event in the near future.
The SPDR family of exchange traded funds (managed by State Street Global Advisors) introduced the Dow Jones Industrial Average ETF on 14 January 1998. The ticker symbol is DIA. This ETF is a perfect vehicle for investors who wish to participate in the performance of DJIA. DIA is an extremely popular ETF, with an average daily volume of nearly six million shares. The ETF is commonly referred to as “Diamonds.” The top five holdings include UnitedHealth Group, Goldman Sachs, Home Depot, Boeing and Amgen.
SHORT-TERM VIEW
DIA remains in bullish territory on a short-term basis. The next level of resistance is 361.13. In order to recapture the momentum, the bears need a weekly close below 326.68. The most likely scenario is a continuation of higher prices.
Based on the Aroon Oscillator, DIA has a neutral reading of +36. The Aroon Oscillator is programmed differently than most stochastic indicators. The oscillator fluctuates between
-100 and +100. A reading of 0 would indicate a neutral position. Therefore, a reading of +36 is considered fairly neutral. Based on the current level of the oscillator, the next big move could be in either direction. The most likely direction is a breakout to the upside.
LONG-TERM VIEW
If Palantir’s forecast is correct, how will it impact the stock market? How do stocks perform following a black swan event? Generally speaking, most investors are conditioned to believe that stock prices will suffer a substantial decline in response to an economic dislocation. Should investors be concerned about their stock portfolios in the event of a global economic crisis? Let’s analyze the data.
Black Swan Events
1987 – 2021
Event Date DJIA 12 Months 24 Months
Black Monday 10.19.1987 1,738 22.9% 54.4%
Gulf War 08.02.1990 2,864 4.9% 18.5%
Dissolution of USSR 12.25.1991 3,082 7.9% 21.9%
Asian Financial Crisis 07.02.1997 7,795 15.8% 42.9%
9/11 Terrorist Attack 09.11.2001 9,605 (10.7%) (1.5%)
Enron Bankruptcy 12.02.2001 9,851 (10.0%) 0.1%
Hurricane Katrina 08.23.2005 10,519 7.4% 25.8%
Global Financial Crisis 09.15.2008 10,917 (11.3%) (3.2%)
Japan Nuclear Disaster 03.11.2011 12,044 7.3% 19.9%
Greece Debt Crisis 06.25.2015 17,890 (2.7%) 19.6%
Brexit Referendum 06.23.2016 17,780 20.3% 38.2%
Global Pandemic 12.31.2019 28,538 7.2% N/A
Source FactorResearch
Since 1987, the global economy has experienced a total of 12 black swan events. As you can see from the table, black swans rarely cause declining stock prices. In fact, these types of occurrences create buying opportunities. Despite all of the “doom and gloom” that usually accompanies these events, financial markets typically ignore the media-driven FUD (i.e., fear, uncertainty and doubt).
Twelve months after the black swan event, the average stock market return is 4.9%. These results are extremely impressive, and it validates the fact that unexpected macro-economic events have very little sustainable impact on equity prices. The 24-month rate of return is even more remarkable. The average rate of return 24 months after a black swan event is 21.8%. Once again, these numbers are a clear indication that investors are not frightened by black swan events.
This takes us back to Palantir’s gold purchase. Even if Palantir is correct and a major economic disruption is headed our way, the likelihood of a multi-month bear market is rather small. Over the years, investors have learned that “doom and gloom” events should be viewed as buying opportunities.
In regard to DIA, the long-term view remains extremely bullish. The next resistance level is 366.69. A weekly close below 112.14 is needed in order to reverse the momentum. It’s highly unlikely that the long-term momentum will turn bearish any time in the near future. However, if global central banks begin to reduce their money printing programs, the bull market could unravel very quickly.
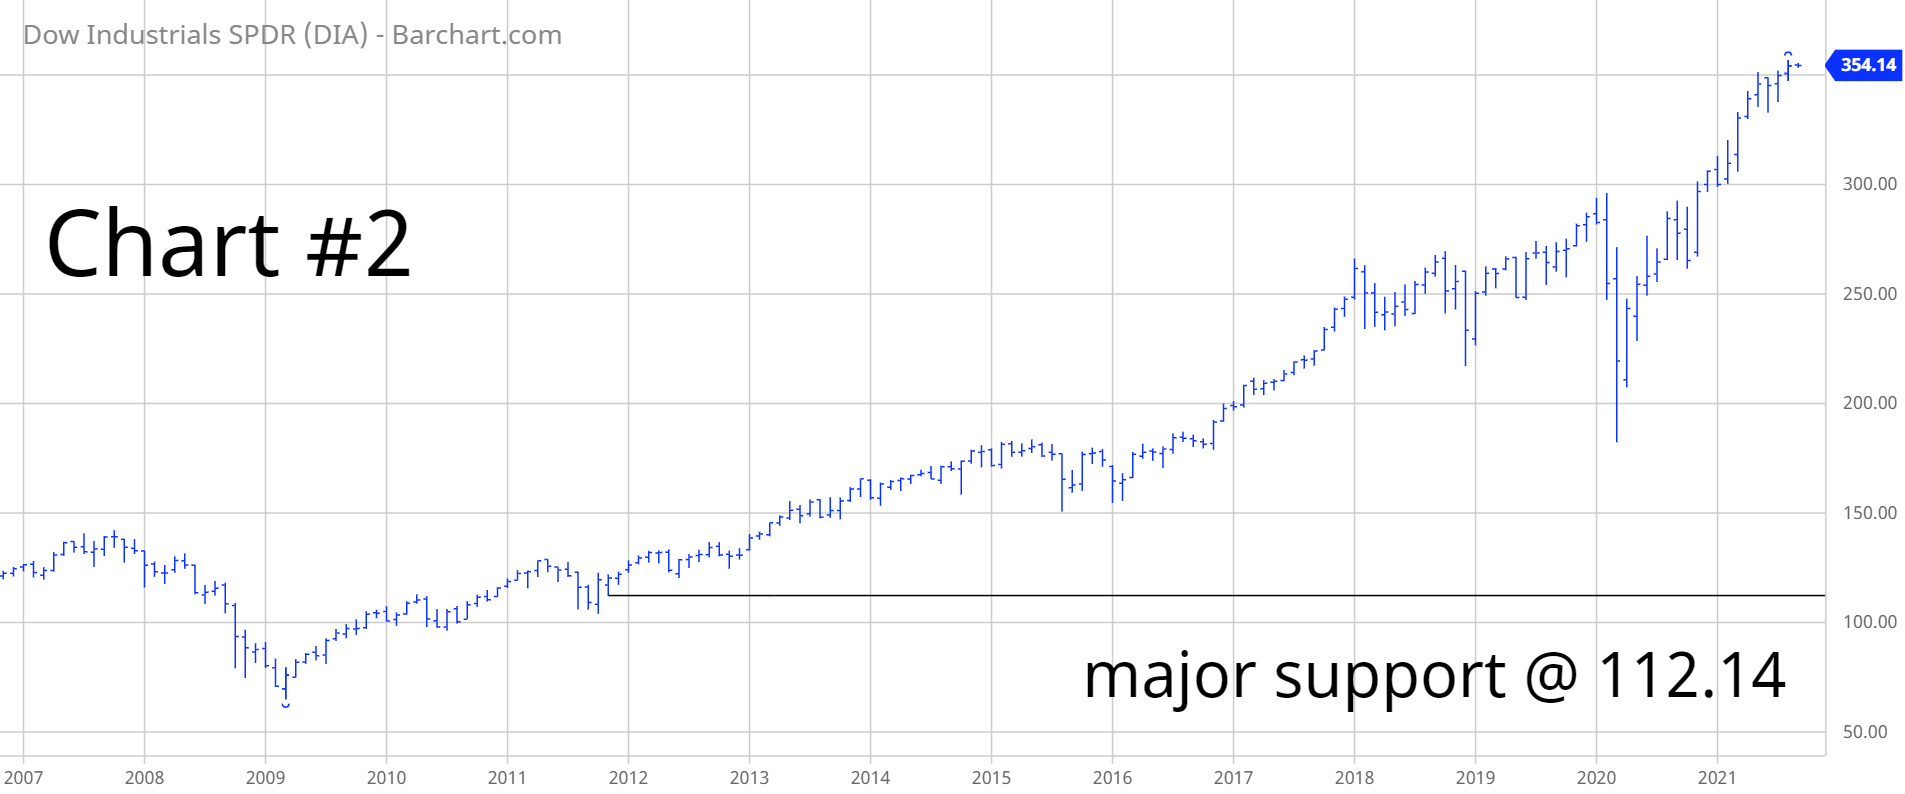
SHORT-TERM TREND
Please review the 6-month chart of DIA (Chart #1). DIA remains in bullish territory on a short-term basis. The next level of resistance is 361.13. The chart pattern will remain bullish as long as DIA stays above 326.68 on a weekly closing basis. The most likely scenario is a continuation of higher prices.
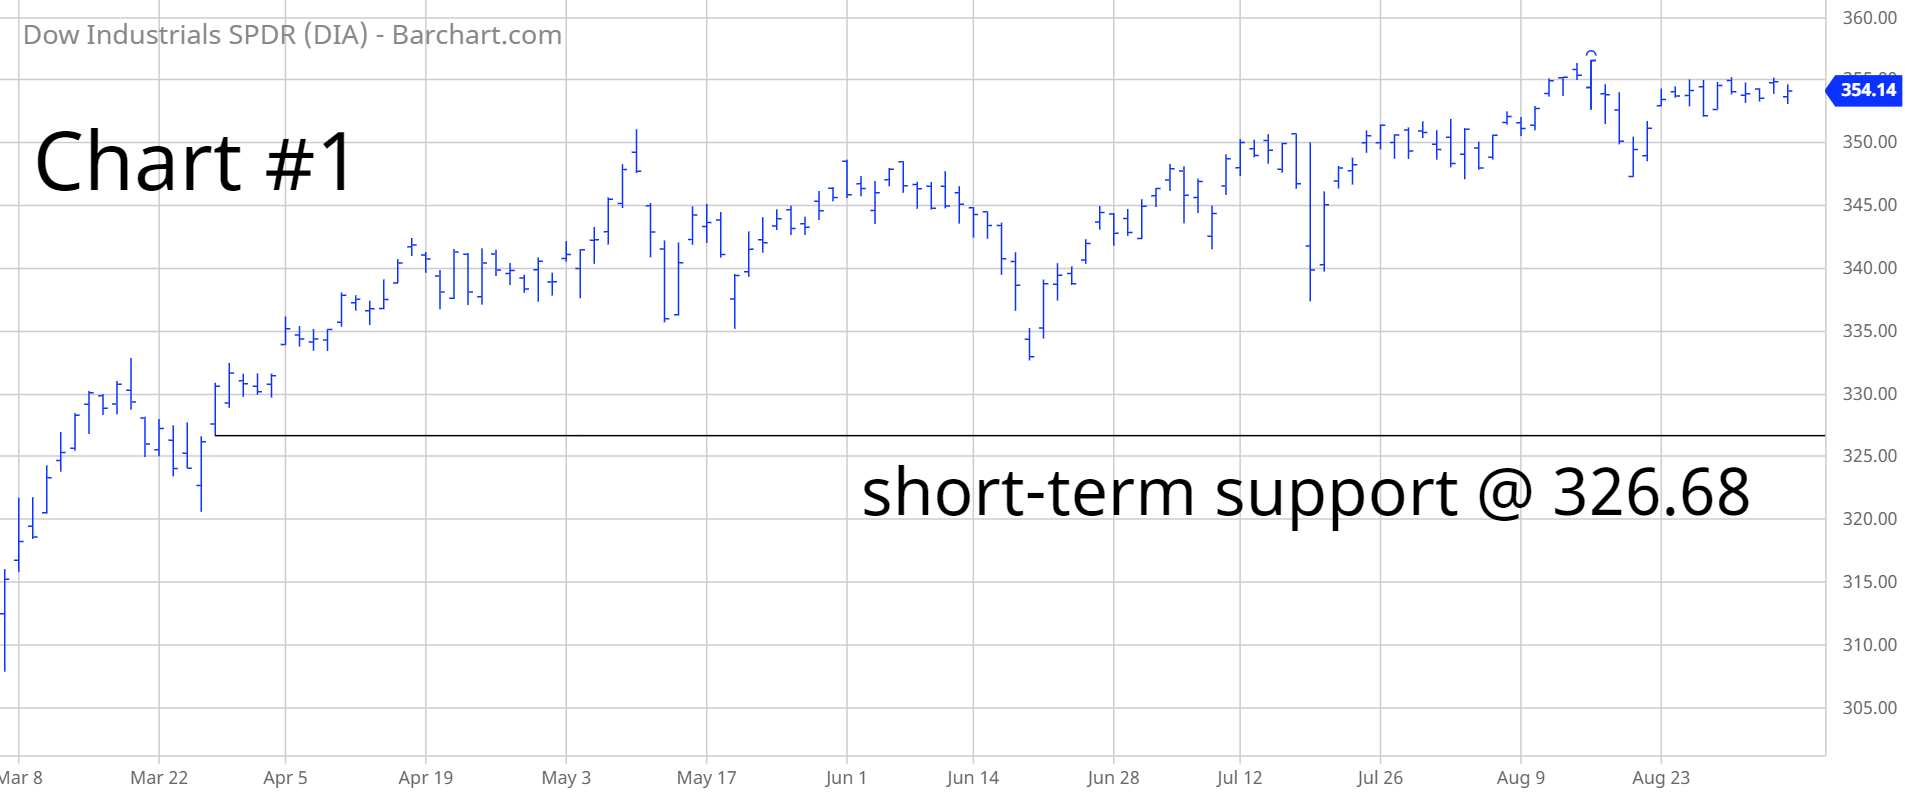
LONG-TERM TREND
Please review the 15-year chart of DIA (Chart #2). The long-term chart pattern continues to remain extremely bullish. The next level of resistance is 366.69. A weekly close below 112.14 is needed to flip the chart into a bearish formation.