Invesco DB US Dollar Index Bullish Fund ETF (UUP)
Key Statistics
Thank you for reading this post, don't forget to subscribe!
Minor Support Level 26.19 Minor Resistance Level 27.74
Major Support Level 20.84 Major Resistance Level 28.90
Minor Buy Signal 28.07 Minor Sell Signal 25.91
Major Buy Signal 30.53 Major Sell Signal 19.05
BRIEF OVERVIEW
According to the International Organization for Standardization (ISO), there are 185 different currencies in circulation. Without question, the most important currency is the US Dollar. It is the only currency that is accepted for trade throughout all countries of the world. Unofficially, the US Dollar is the reserve currency for all major central banks. It accounts for 64% of all central bank foreign exchange reserves.
Many financial experts and foreign currency analysts predict the US Dollar will eventually lose its reserve currency status. Based on the overwhelming popularity of the Dollar among the G20 nations, it’s highly unlikely the greenback will be dethroned as the global reserve currency. In fact, it’s almost impossible for another currency to replace the Dollar at the top of the currency hierarchy. Why? Because there simply are not enough paper currency notes in circulation outside of the US Dollar. The only other currencies that could even remotely compete against the greenback are the Euro and the Japanese Yen. However, both of these currencies have very little physical notes in circulation. Therefore, it would be logistically impossible for these currencies to replace the US Dollar.
Given the fact that the US Dollar will probably remain the global reserve currency for well into the future, it’s very important for traders and investors to accurately determine the long-term outlook for the greenback. The US Dollar has a huge influence in determining the future price direction of all asset classes. This includes stocks, bonds, commodities, precious metals, real estate and digital currencies.
In regard to the ETF universe, the most popular US Dollar ETF is the DB US Dollar Index Bullish Fund, which was launched by the Invesco family of exchange traded funds. The date of inception is 20 February 2007. The ticker symbol is UUP. This is an excellent vehicle for investors who are searching for a cost effective way to track the value of the US Dollar relative to other global currencies. Specifically, UUP invests in a basket of six currencies. The list includes Euro FX, Japanese Yen, British Pound, Canadian Dollar, Swedish Krona and Swiss Franc.
SHORT-TERM VIEW
UUP enjoyed a substantial rally following the initial outbreak of the coronavirus in March. However, the market has surrendered the majority of its gains during the past few weeks. The short-term momentum is in favor of the bears. The next level of support is 26.19. The bulls need a weekly close above 27.74 in order to recapture the upside momentum. The most likely scenario is a trading range, as the bulls and bears struggle to gain the upper hand.
Based on the Aroon Oscillator, UUP has an oversold reading of -96. The Aroon Oscillator is programmed differently than most stochastic indicators. The oscillator fluctuates between
-100 and +100. A reading of 0 would indicate a neutral position. Therefore, a reading of -96 with UUP is considered extremely oversold. A strong short-term rally is quite possible.
LONG-TERM VIEW
Whether we like it or not, the US Dollar holds the “key” to determining the long-term direction of most asset classes. The list includes commodities, precious metals, bonds and real estate. In fact, a strong argument could be made that the US Dollar influences the stock market more than most investors are willing to admit. This is especially true over the course of the past 20 years, as more companies have migrated from a domestic platform to a multi-national platform.
Despite the strong rally over the course of the past two years, the US Dollar has been in a decisive secular bear market since 2001. As you can see from Chart #1, the Dollar Index formed a massive top in Q1 1985 @ 164.72.
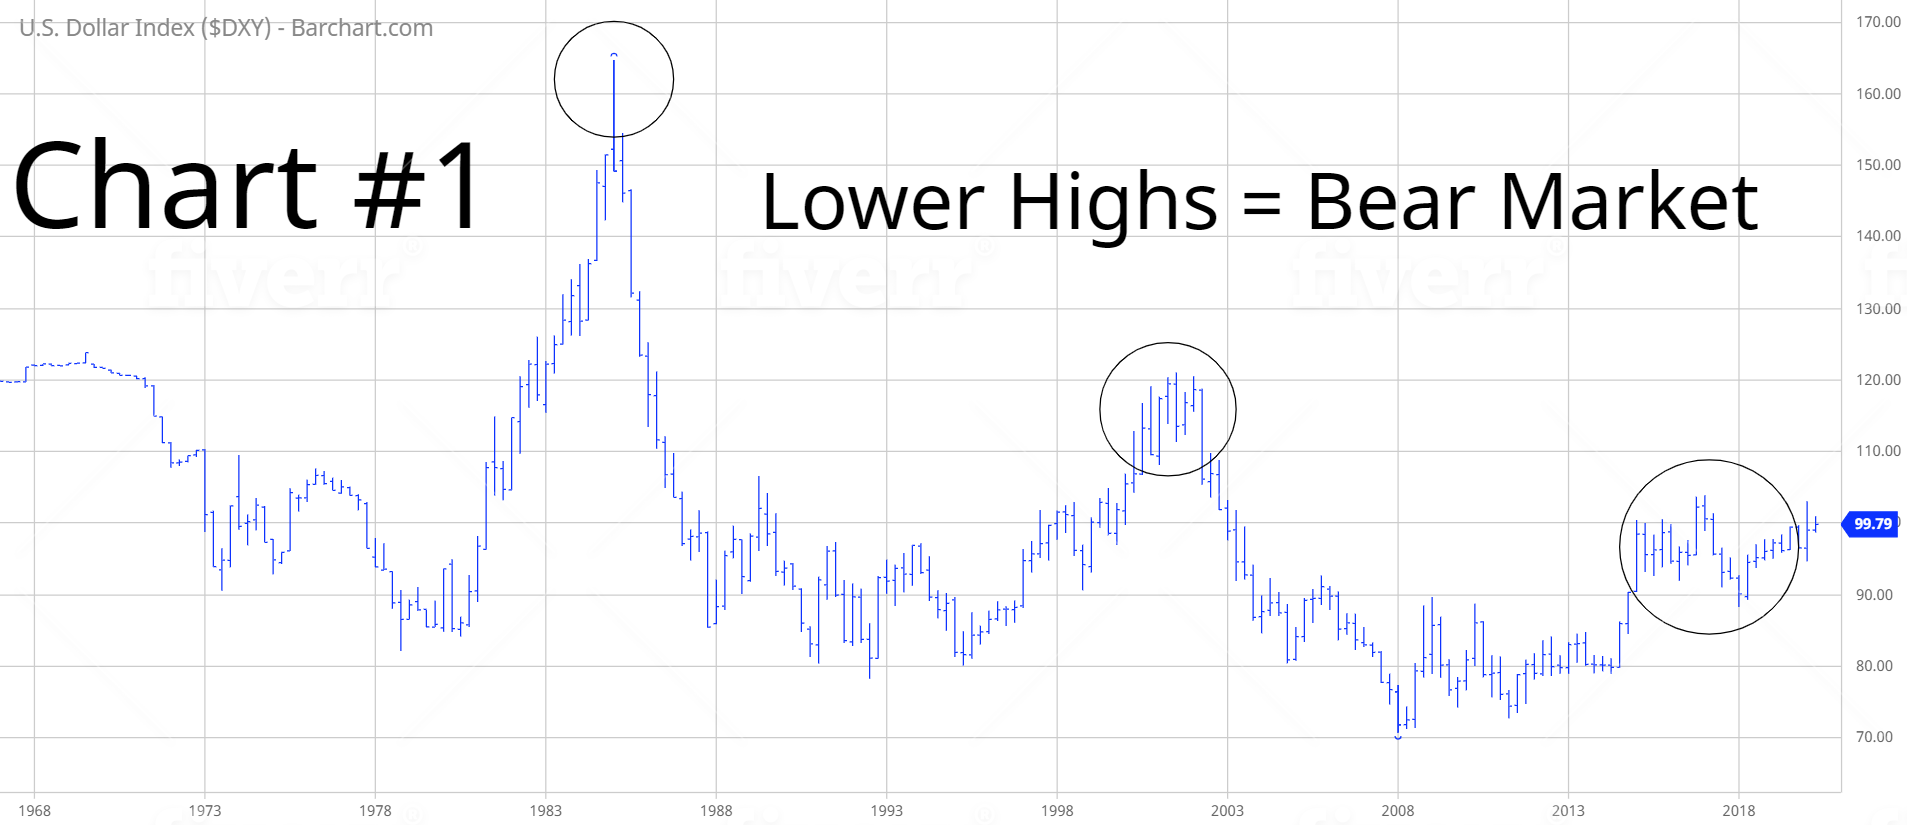
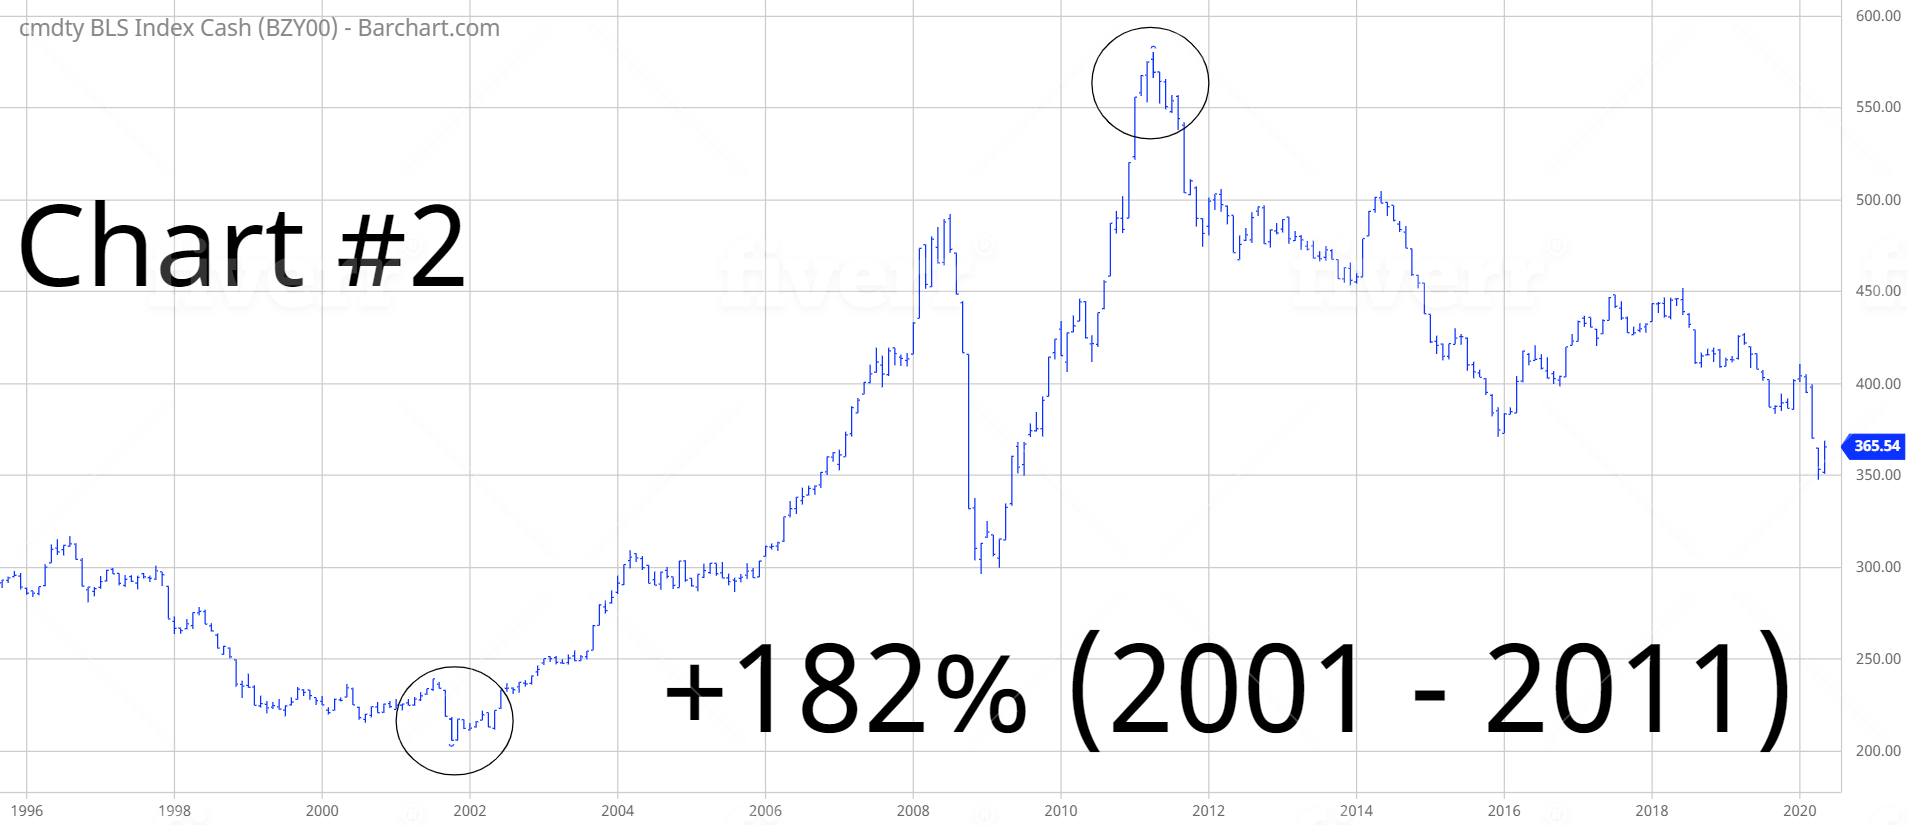
During the past 35 years, the index has never approached its level from 1985. Not even close. Essentially, the Dollar has been drifting sideways-to-lower for almost four decades. The multi-year weakness in the Dollar partially explains the record breaking advance in the stock market since the mid-1980s. The weak Dollar also allowed the commodity universe to enjoy its most historic bull market advance of the past 100 years from 2001 through 2011 (Chart #2).
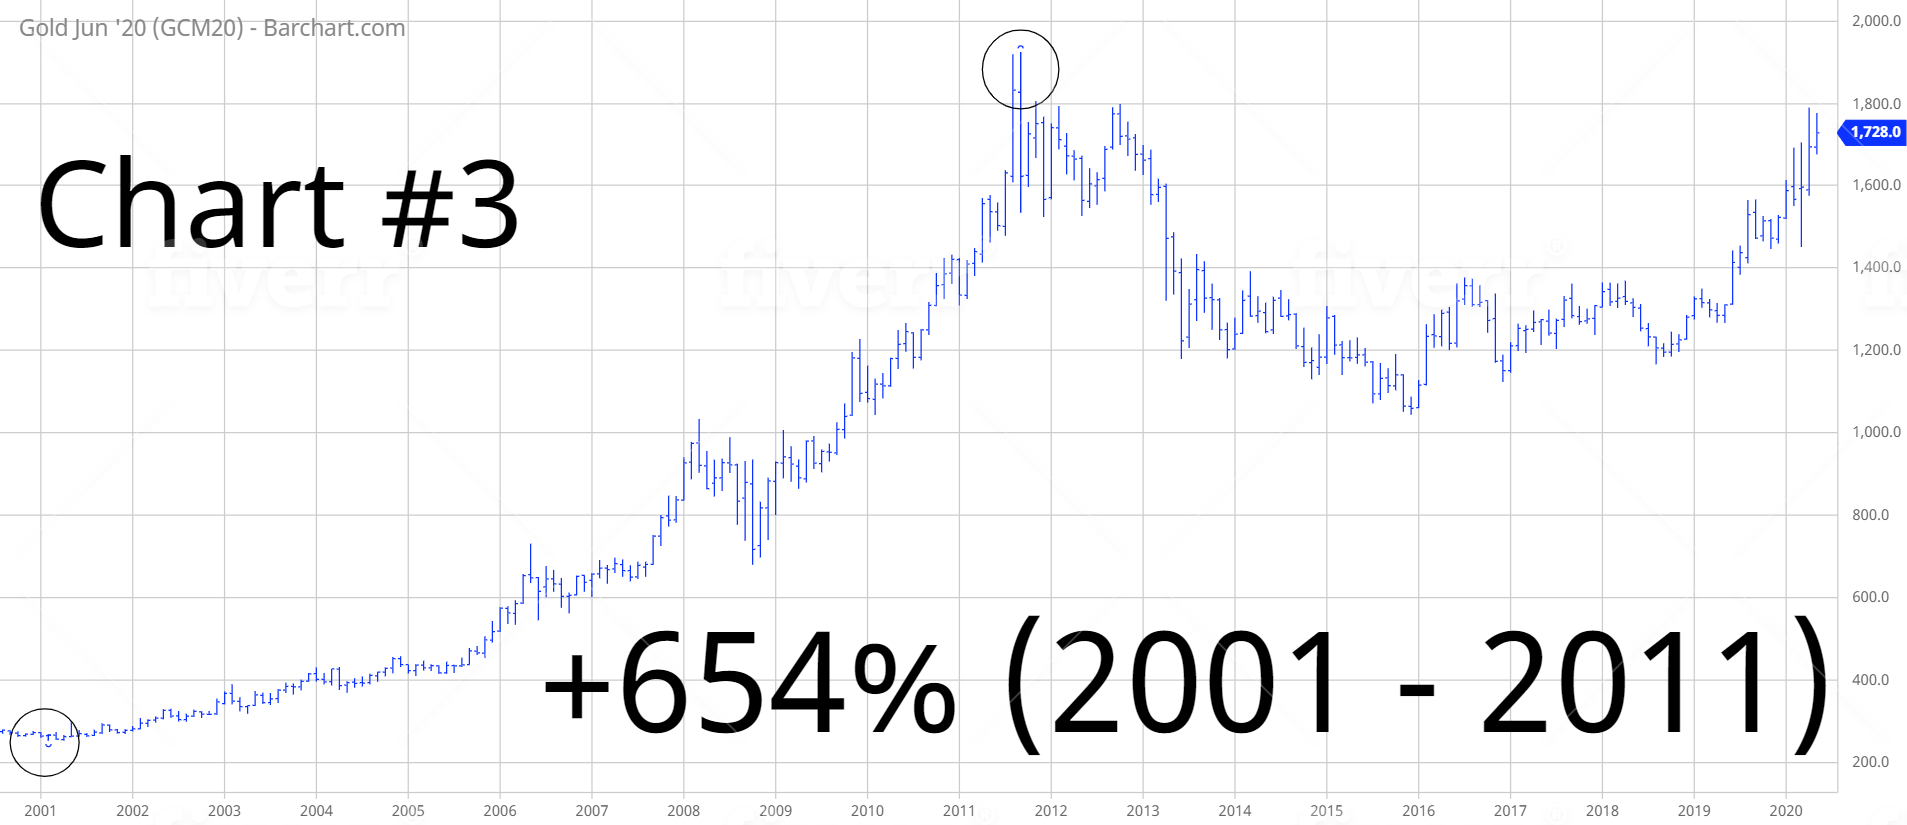
Additionally, gold recorded an increase of 654% during the first decade of the 2000s as the Dollar was drifting lower (Chart #3).
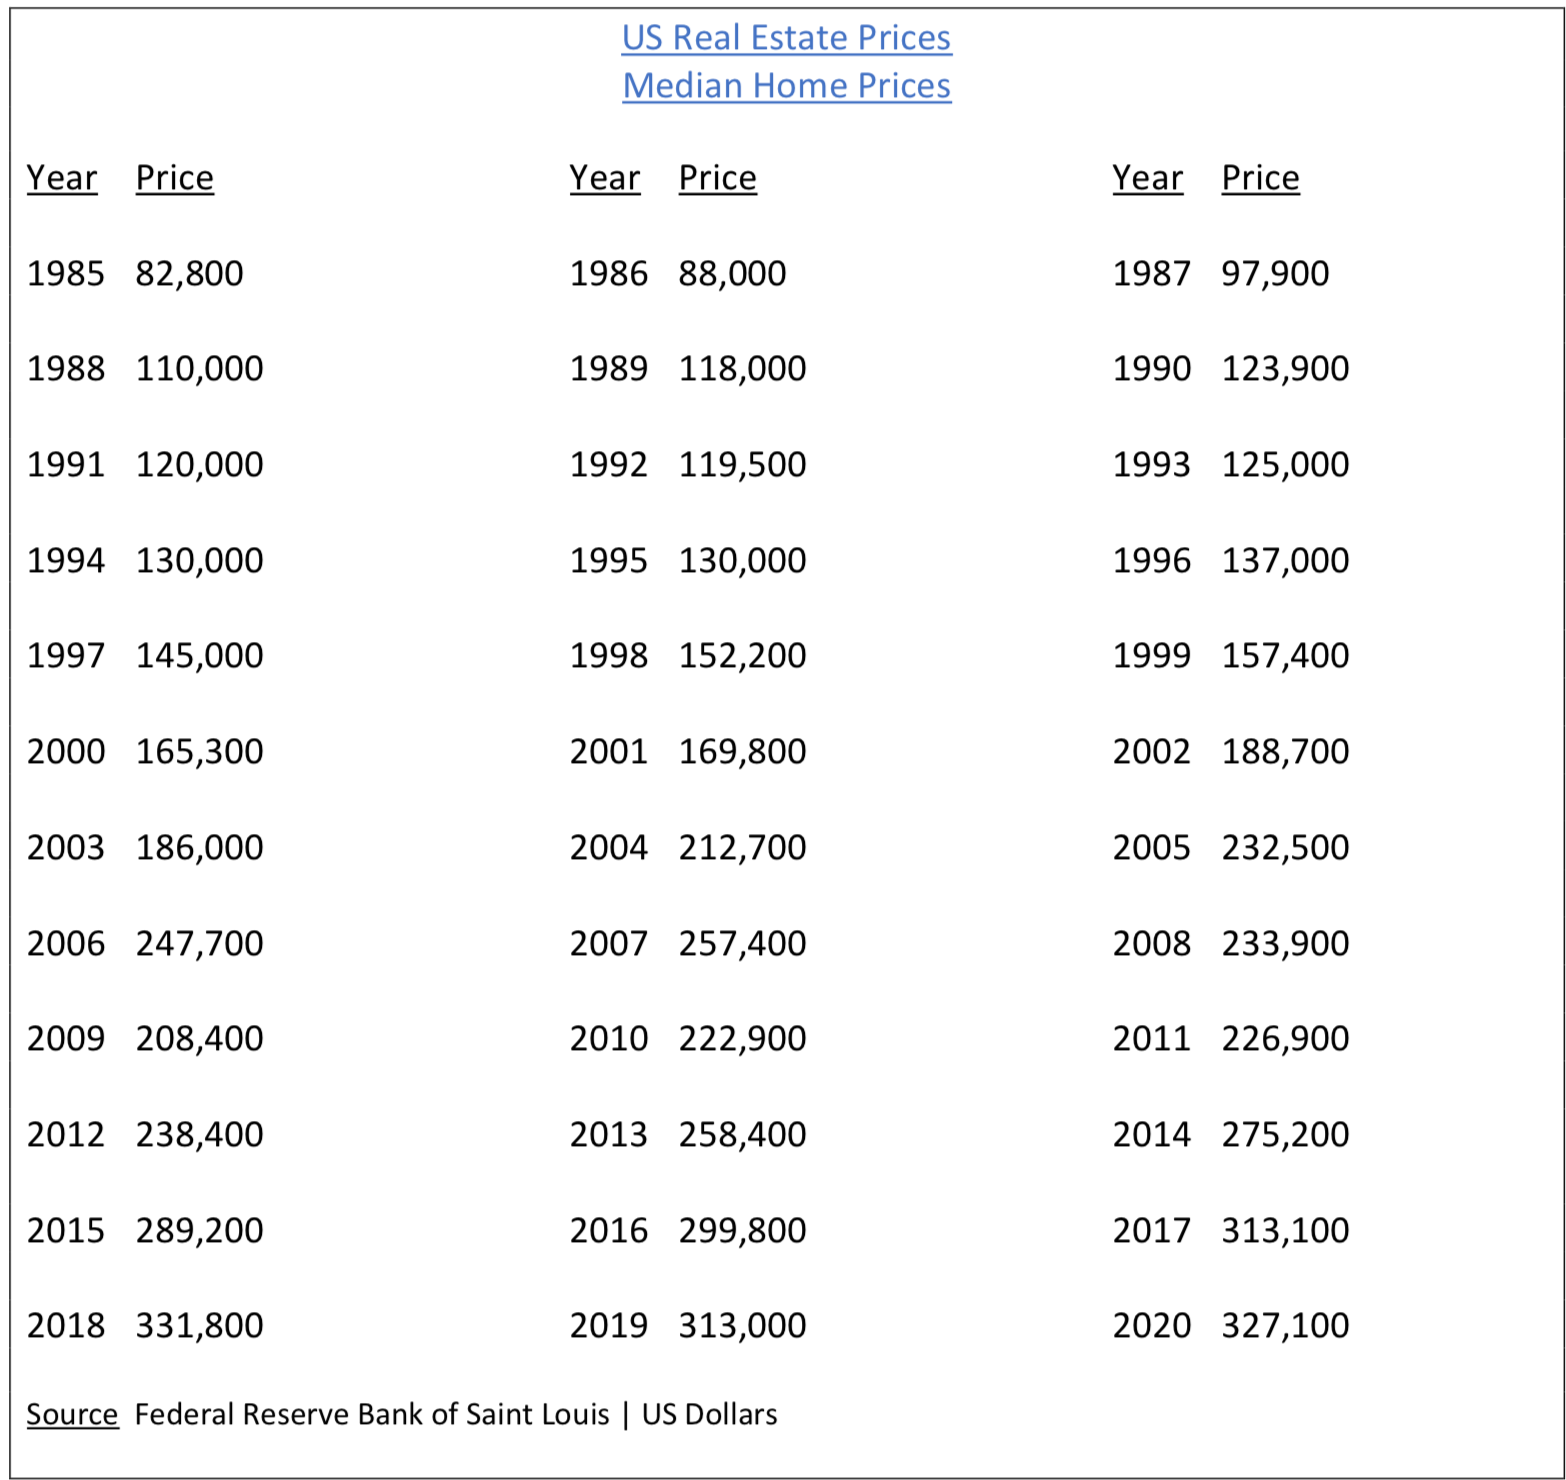
Let’s don’t forget about real estate. This asset class has experienced an unprecedented bull market advance. Since January 1985, the median home price in the US has generated an average annual increase of 8.4%. Please review the following table.
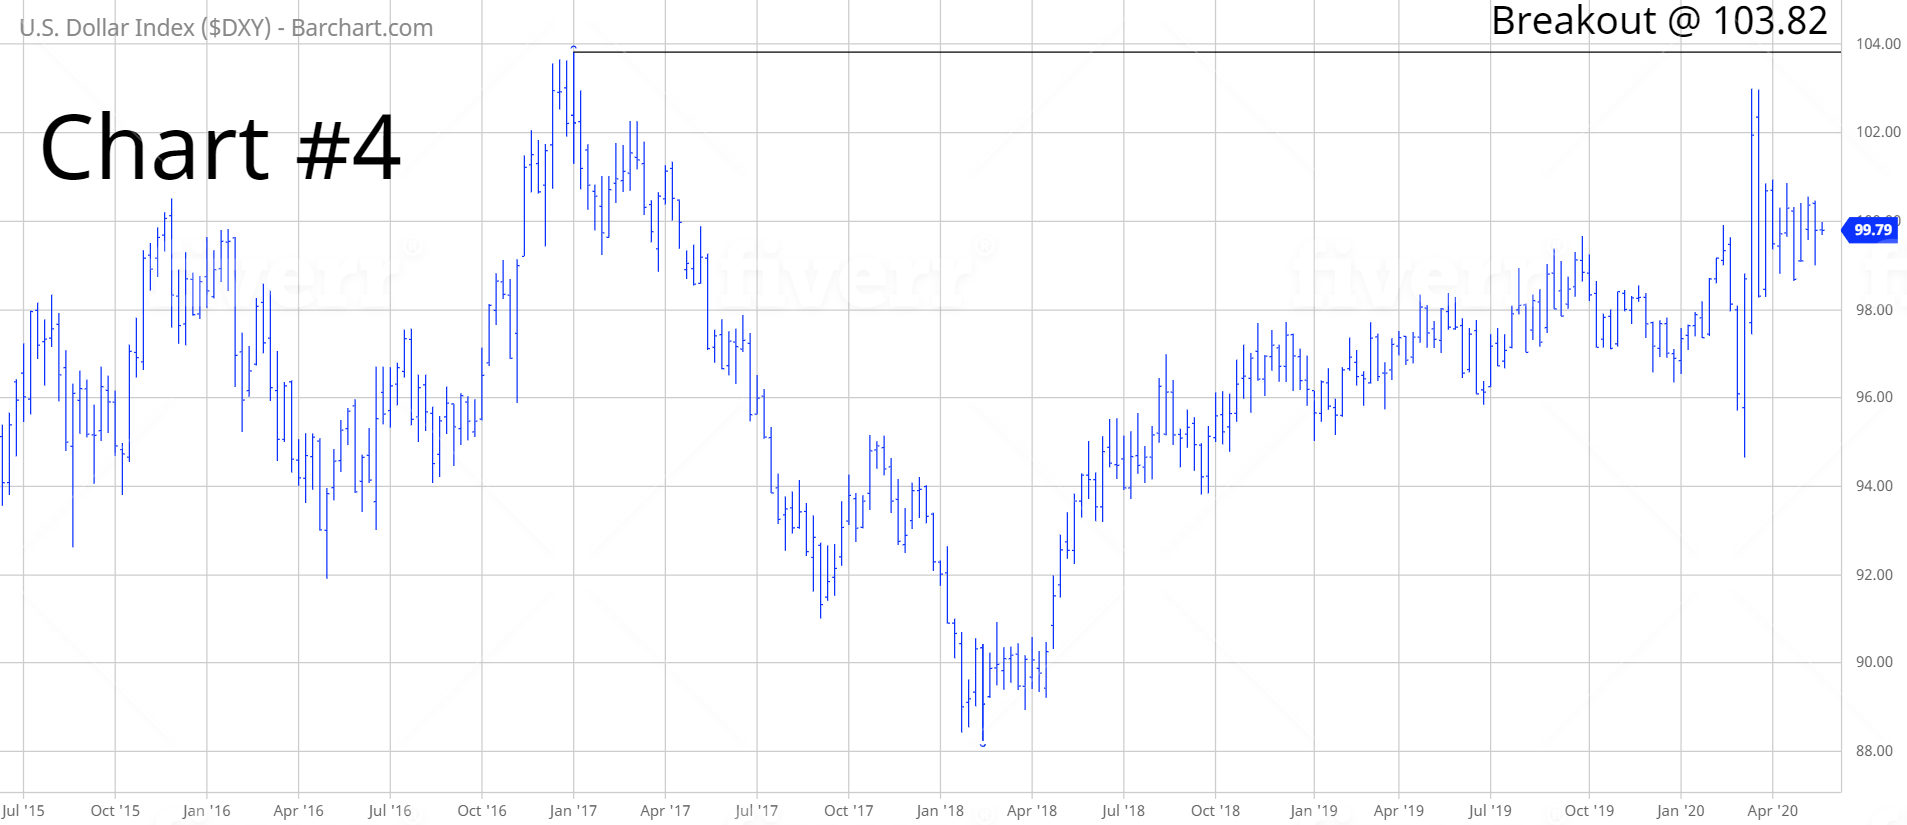
In terms of the US Dollar, where do we go from here? As we discussed, the Dollar has been in a secular bear market for the better part of four decades. At least for now, there’s no indication that the market is on the verge of launching into a new long-term bull market. At the very least, the Dollar Index must produce a weekly close above 103.82 in order to suggest that a new secular bull market could be underway (Chart #4).
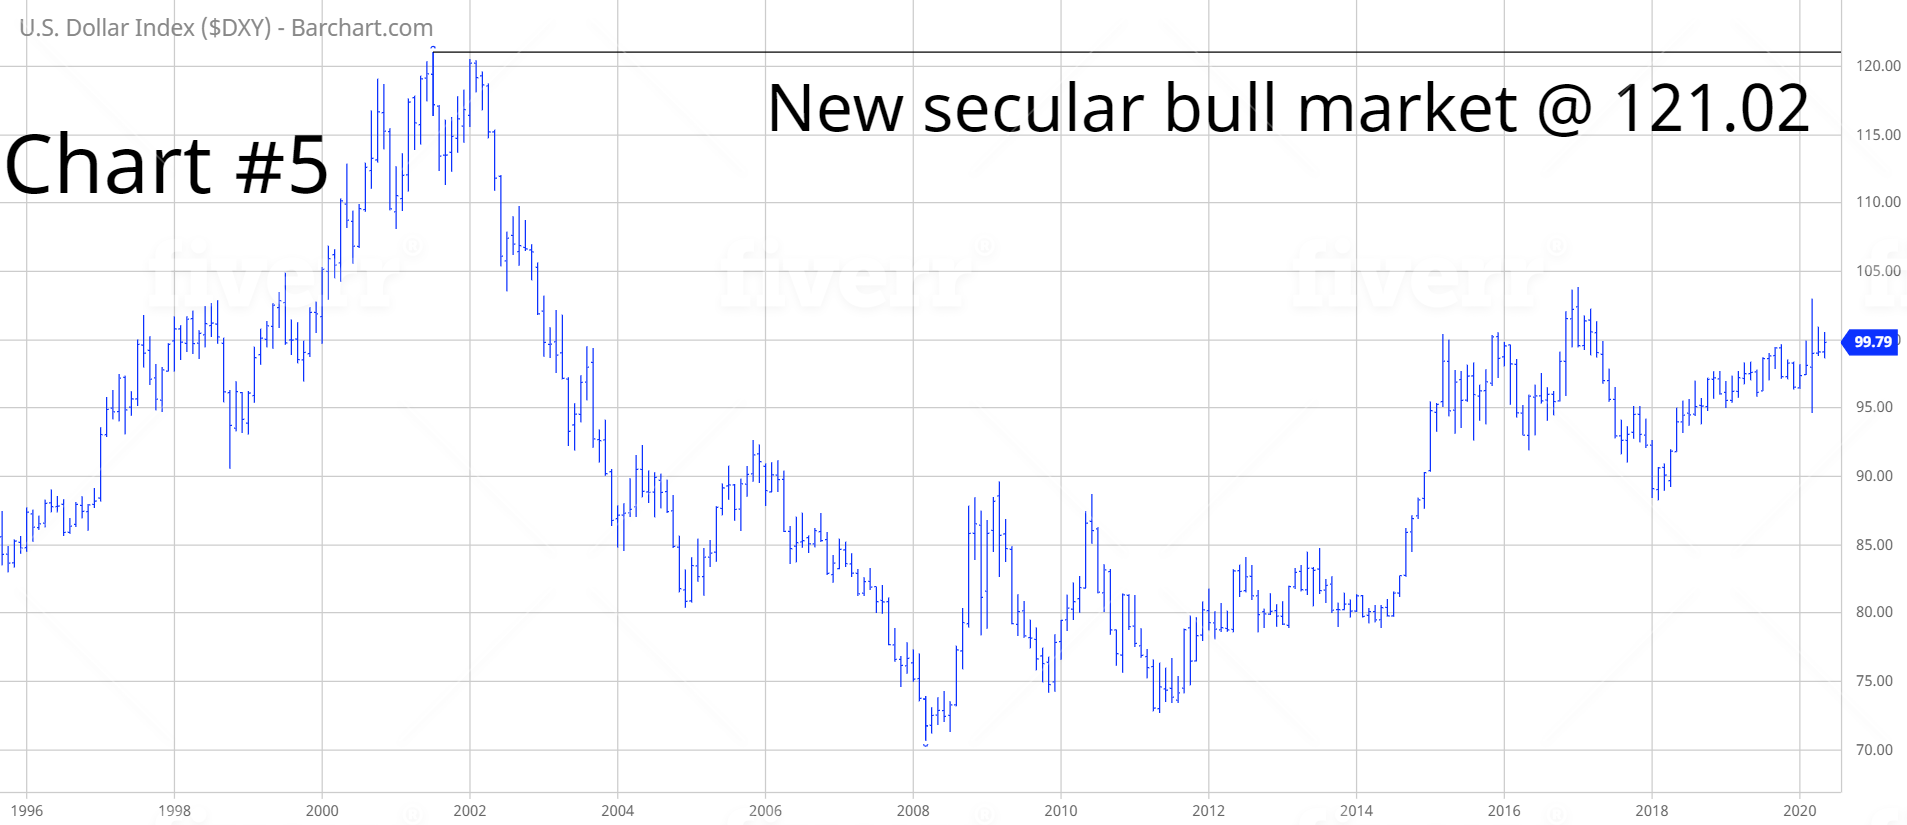
However, officially, the Dollar Index must form a weekly close above 121.02 in order to unleash a new secular bull market. Please review Chart #5.
This type of price advance is certainly possible but not likely. Instead, the most likely scenario is that the US Dollar remains in a secular bear market. This means that the value of the Dollar will trade sideways-to-lower for the next several years. If this forecast is correct, investors can expect higher stock prices, higher real estate prices, a new bull market in commodities and possibly much higher gold prices.
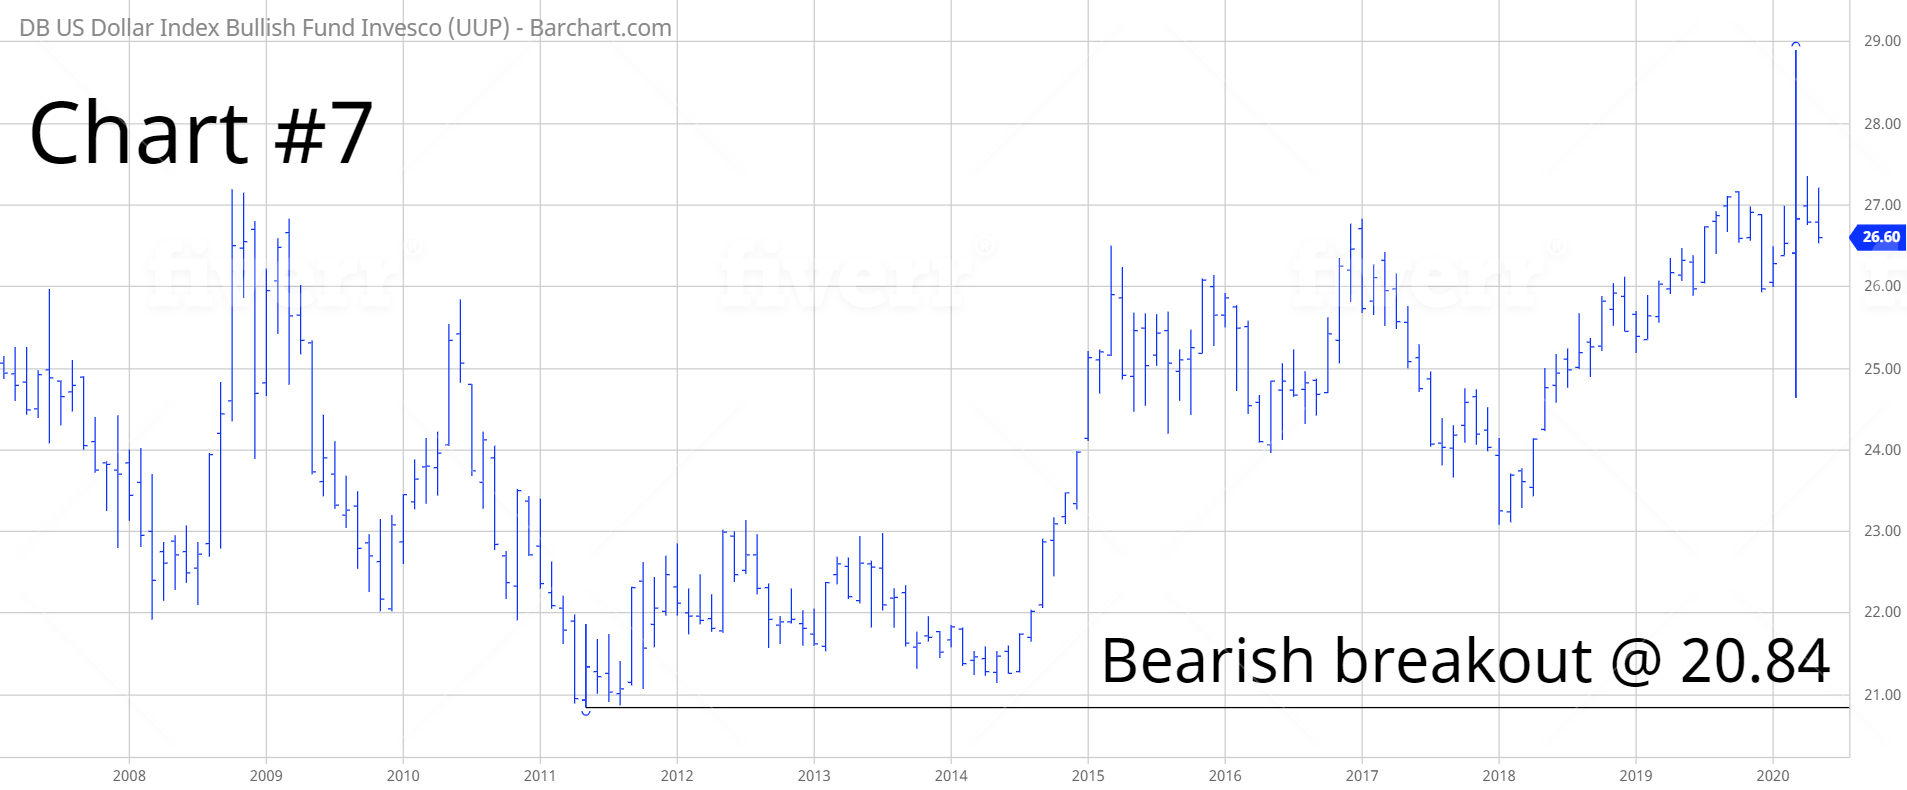
In regard to UUP, the long-term trend is bullish simply because the ETF has only been in existence since February 2007. UUP will remain bullish as long as the ETF stays above 20.84 on a weekly closing basis.
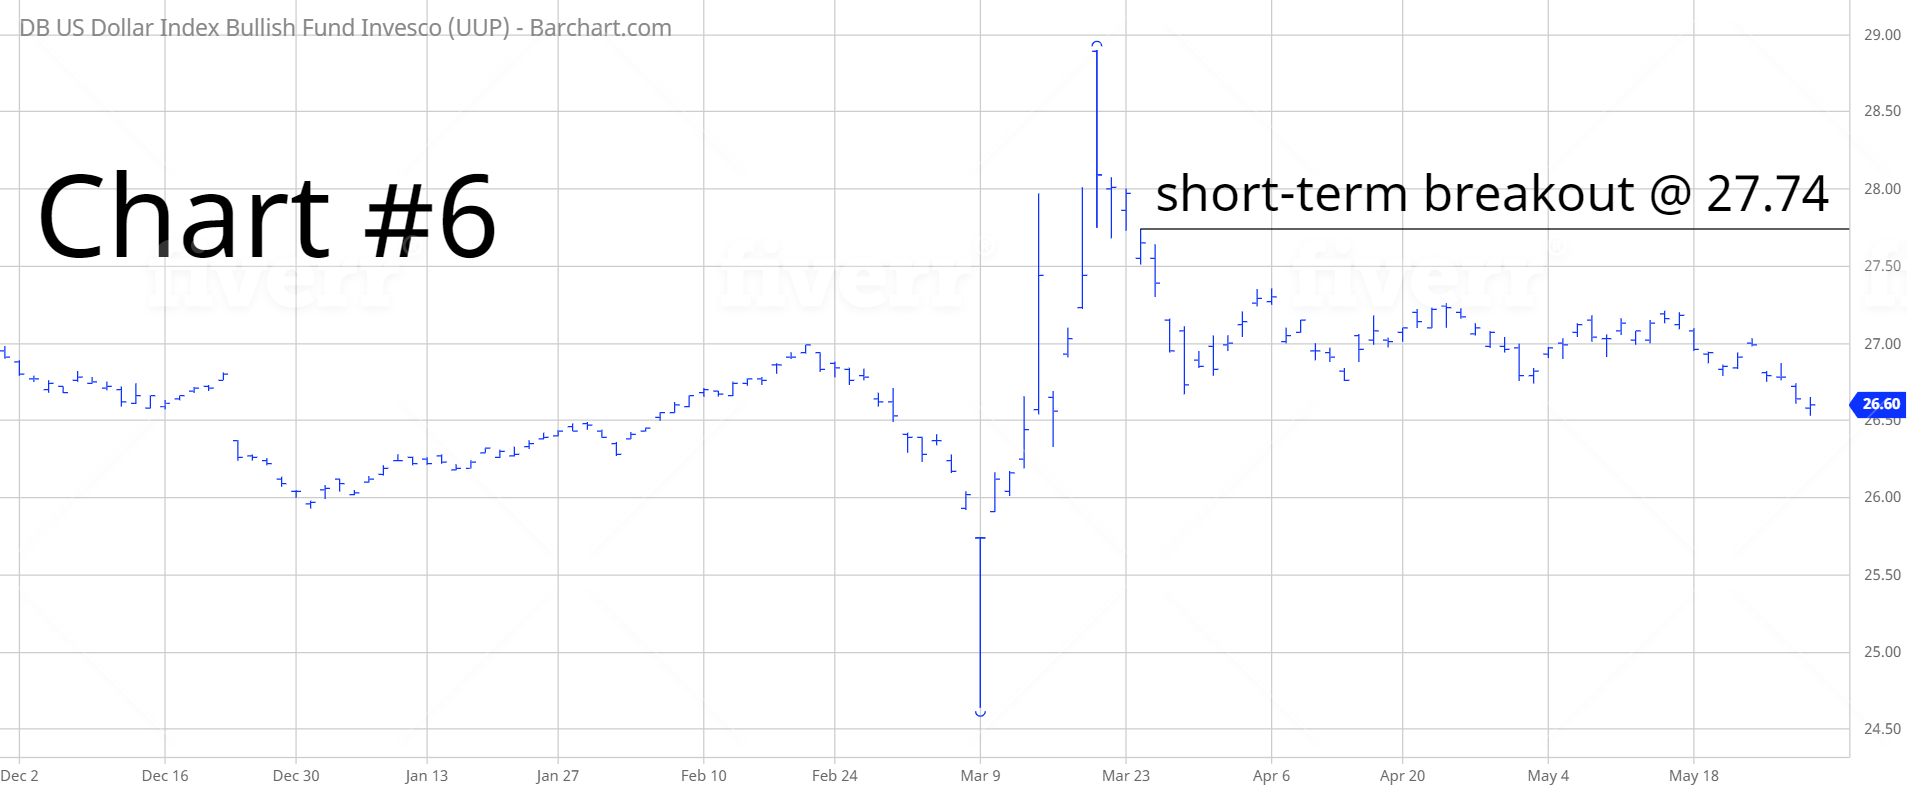
SHORT-TERM CHART
Please review the 6-month chart of UUP (Chart #6). Despite the strong rally following the COVID-19 outbreak in March, the short-term chart pattern is bearish. The next level of support is 26.19. In order to flip the chart pattern in favor of the bulls, a weekly close above 27.74 is needed. Most likely, UUP will drift sideways for the next several weeks.
LONG-TERM CHART
Please review the 13-year chart of UUP (Chart #7). This chart covers the entire trading history of the ETF. The long-term chart pattern is bullish. UUP spiked to a new all-time high in March following the outbreak of the coronavirus. However, the majority of the gains have been lost within the past six weeks. Despite the recent decline, the long-term trend remains bullish as long as UUP stays above 20.84 on a weekly closing basis.