PowerShares DB Agriculture Fund (DBA)
Key Statistics
Thank you for reading this post, don't forget to subscribe!
Minor Support Level 12.69 Minor Resistance Level 14.81
Major Support Level 10.98 Major Resistance Level 38.16
Minor Buy Signal 15.65 Minor Sell Signal 11.94
Major Buy Signal 42.16 Major Sell Signal 7.47
BRIEF OVERVIEW – Agricultural ETF DBA
For the first time in eight years, it appears that commodities could be in the early stages of a new cyclical bull market. Many commodities enjoyed an incredible bull run from 2001 through 2012. In fact, it was one of the most powerful bull markets in the history of commodities. Please review the following table.
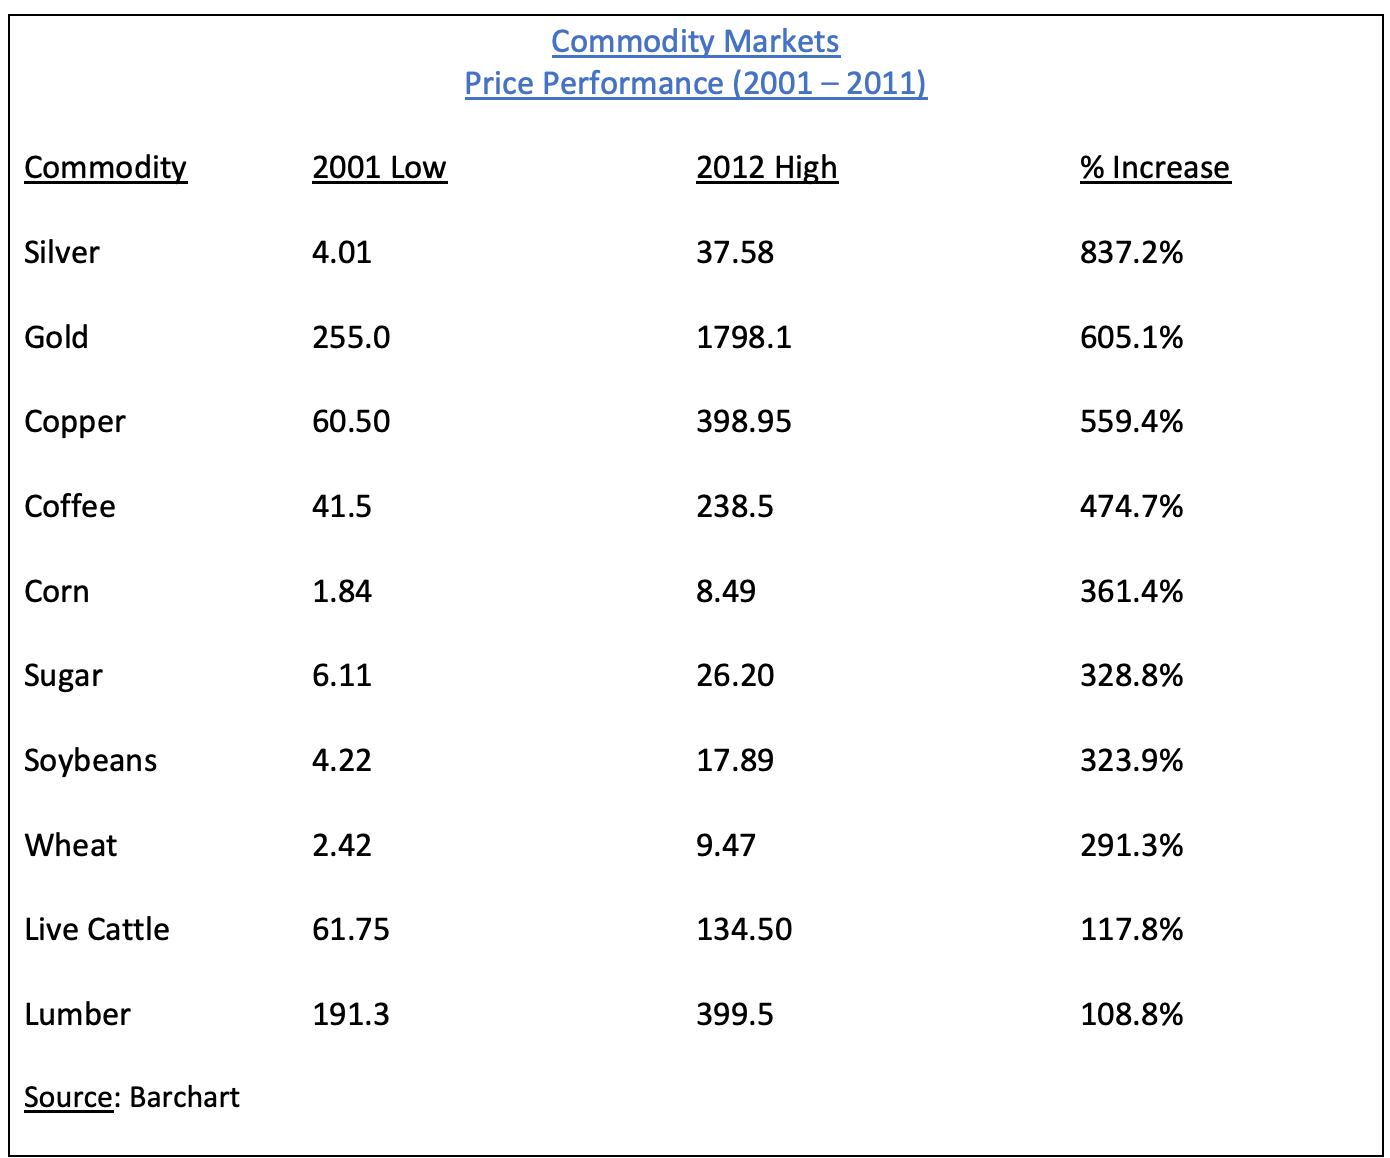
As you can see from the table, the commodity universe enjoyed a powerful bull market as we entered a new century beginning in 2001. In fact, this was one of the most powerful commodity bull markets dating back to the Industrial Revolution. Of course, all bull markets must end. This particular bull market ended between 2011 and 2012. It was followed by a nasty bear market which began in 2012 and 2013. Please review the following table.
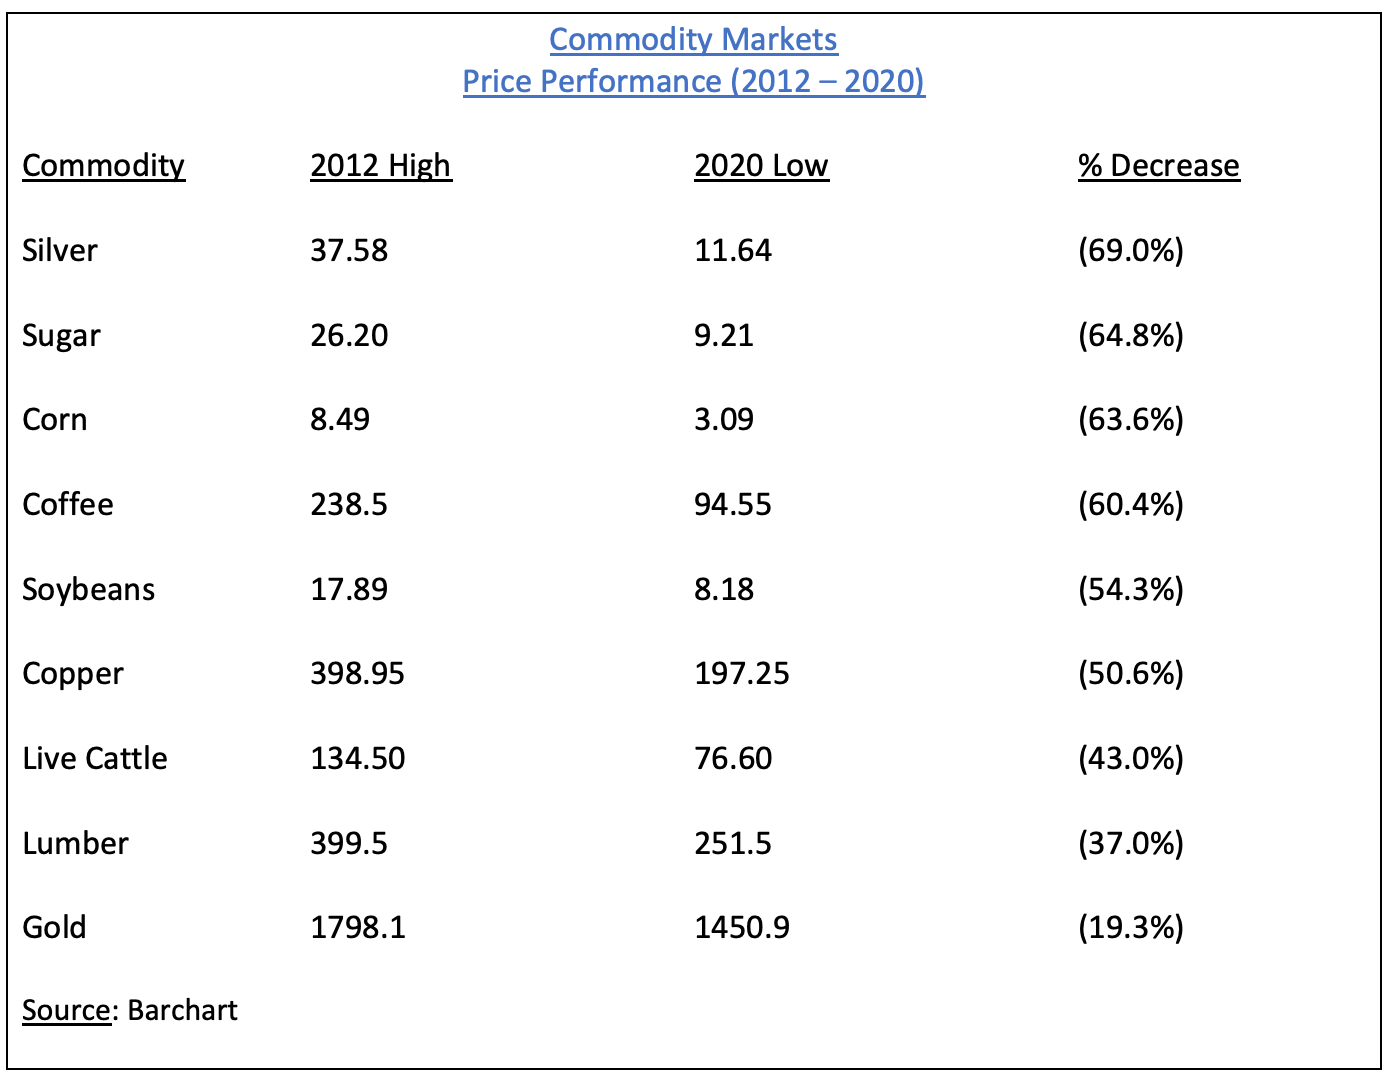
From a historical perspective, the recent bear market was fairly normal in terms of percentage decline. The average decline was 51.3% (based on the basket of commodities listed in the table). If we compare the recent bear market with previous commodity bear markets dating all the way back to the First Industrial Revolution, 51.3% falls right in the middle of the range. Of course, the million dollar question is, “Did the commodity bear market end in 2020?” If so, the next commodity bull market could offer tremendous profit potential.
A common characteristic among the world’s most successful trades and investors is their ability to become fully invested in the early stages of a new bull market and bear market cycle. This is what allows them to outperform 99% of the global investment community. Are we in the early stages of a new commodity bull market? If so, how long will the bull market continue? Let’s examine the details.
The PowerShares family of exchange traded funds (managed by Invesco PLC) introduced the DB Agriculture Fund on 5 January 2007, using the ticker symbol DBA. This ETF is a pure play on food and agriculture prices. DBA does not hold any equity positions. Instead, the fund is composed entirely of food and grain futures contracts. Specifically, DBA is invested in ten different commodities. The top five commodities include wheat, soybeans, corn, live cattle and sugar. Essentially, investors are placing a speculative wager on an increase in commodity prices.
SHORT-TERM VIEW
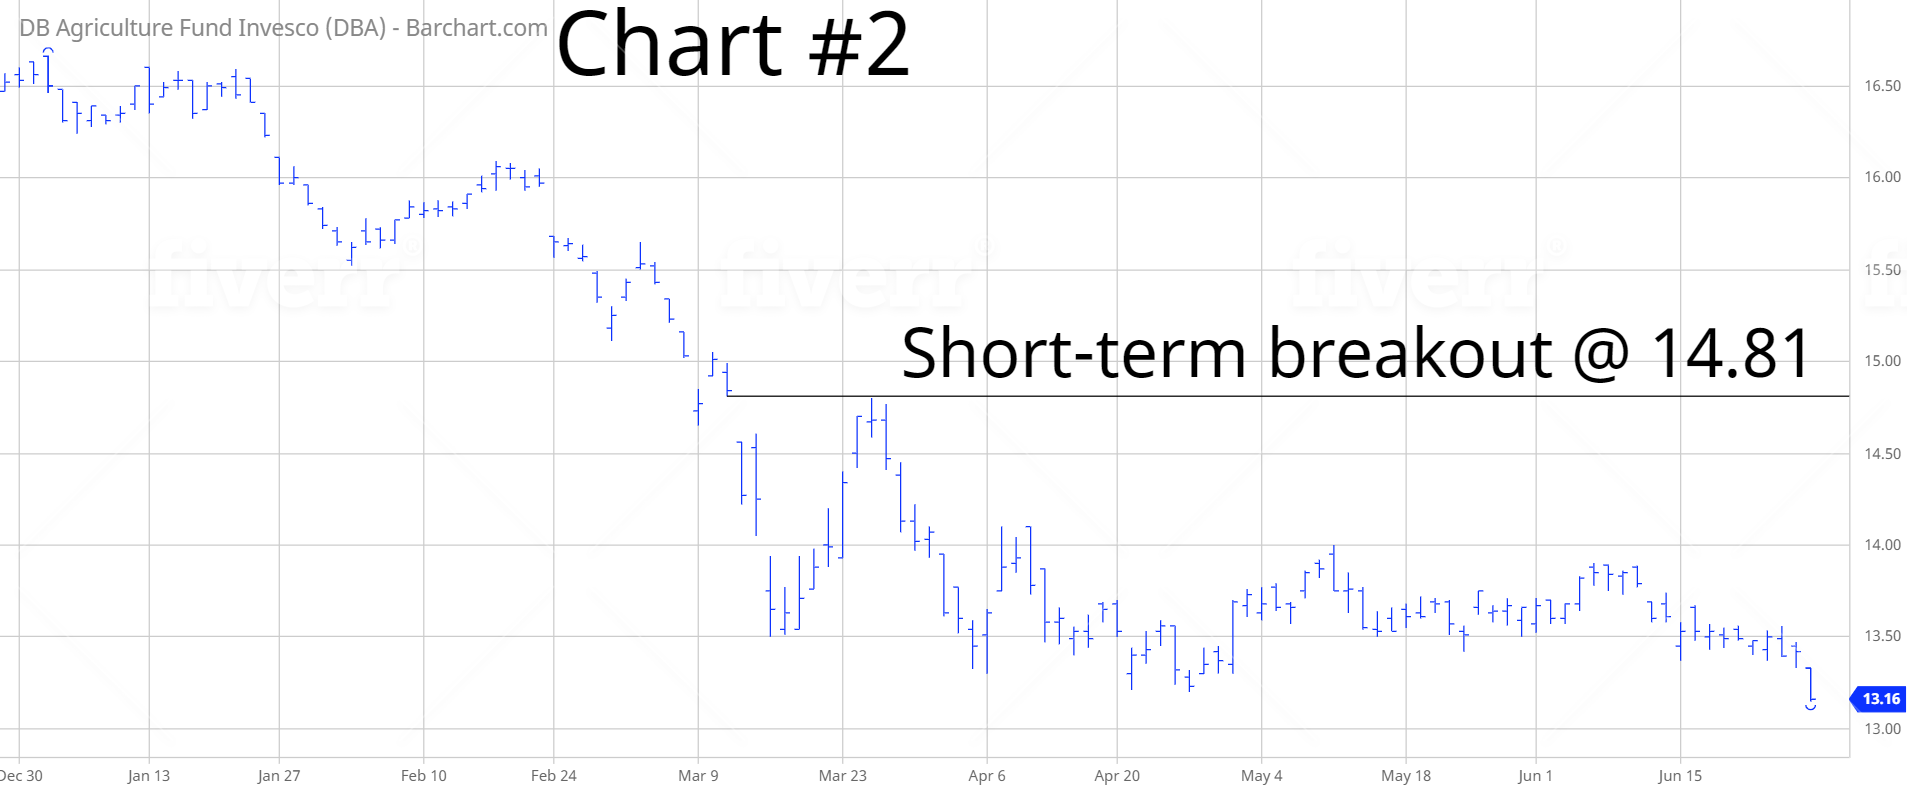
In terms of the short-term momentum, the bears have the upper hand. The next level of support is 12.69. DBA has drifting lower for the past six months. Most likely, this decline will continue until there is a resolution with COVID-19. In order to recapture the momentum, the bulls need a weekly close above 14.81.
Based on the Aroon Oscillator, DBA has an moderately oversold reading of -60. The Aroon Oscillator is programmed differently than most stochastic indicators. The oscillator fluctuates between -100 and +100. A reading of 0 would indicate a neutral position. Therefore, a reading of -60 with DBA is considered slightly oversold. The ETF is overdue for a short-term correction.
LONG-TERM VIEW
Within the global investment community, there are five different asset classes. The list includes stocks, bonds, commodities, cash and alternative investments. Commodities are the most volatile asset class within the group. However, they are also the most predictable in terms of following long-term cycles. This is especially true of commodities from agriculture, energy and food. Why? Because these three sectors are heavily related to fluctuations within the global economy. Before we continue, let’s examine all ten sectors within the commodity asset class. Please review the following table.
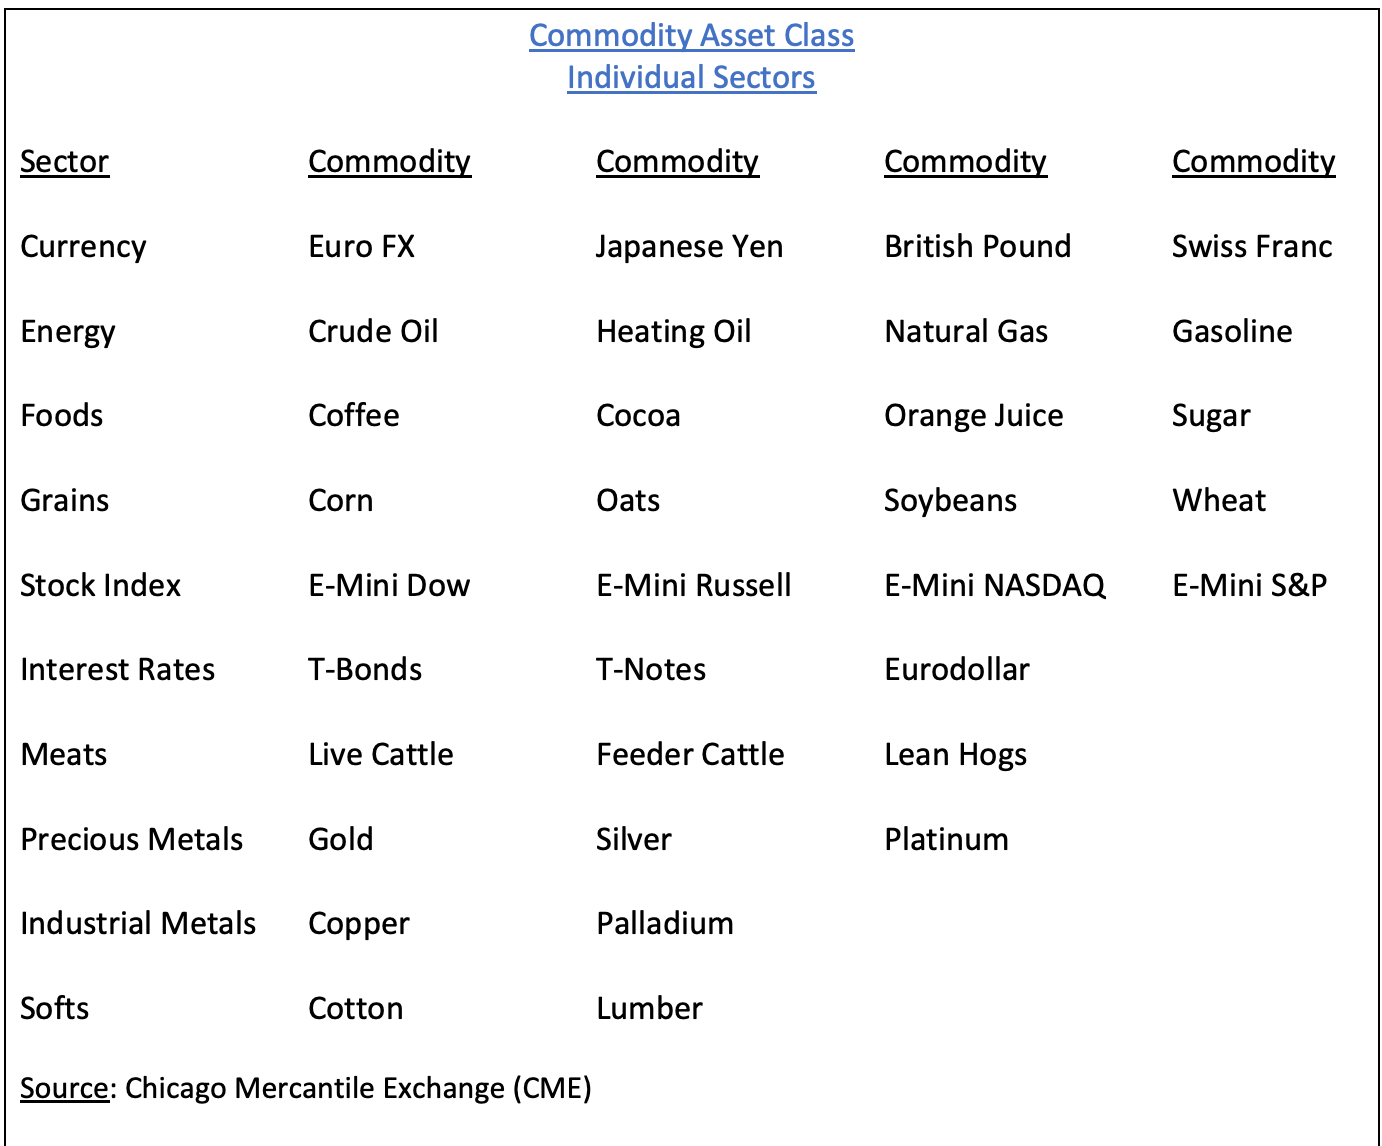
There are a total of 33 individual commodities within the commodity universe. Arguably, the most important sector is energy. Why? Because without energy, it’s impossible to create other goods and services. Consequently, the energy sector has the greatest influence on the global economy.
In regard to the long-term commodity cycle, are we in a bullish phase or bearish phase? In order to answer this question, let’s examine a 20-year chart of the Bureau of Labor Statistics Commodity Index (Chart #1). The most recent secular bull market began in October 2001. Many commodity experts claim the bull market ended in April 2011. Based on 259 years of commodity price action, the vast majority of secular bull markets will last 25 to 30 years. Therefore, it’s highly unlikely that the secular bull market ended in 2011. Of course, anything is possible. However, if in fact the bull market ended in 2011, it will be one of the shortest secular commodity bull markets of the past 200 years.
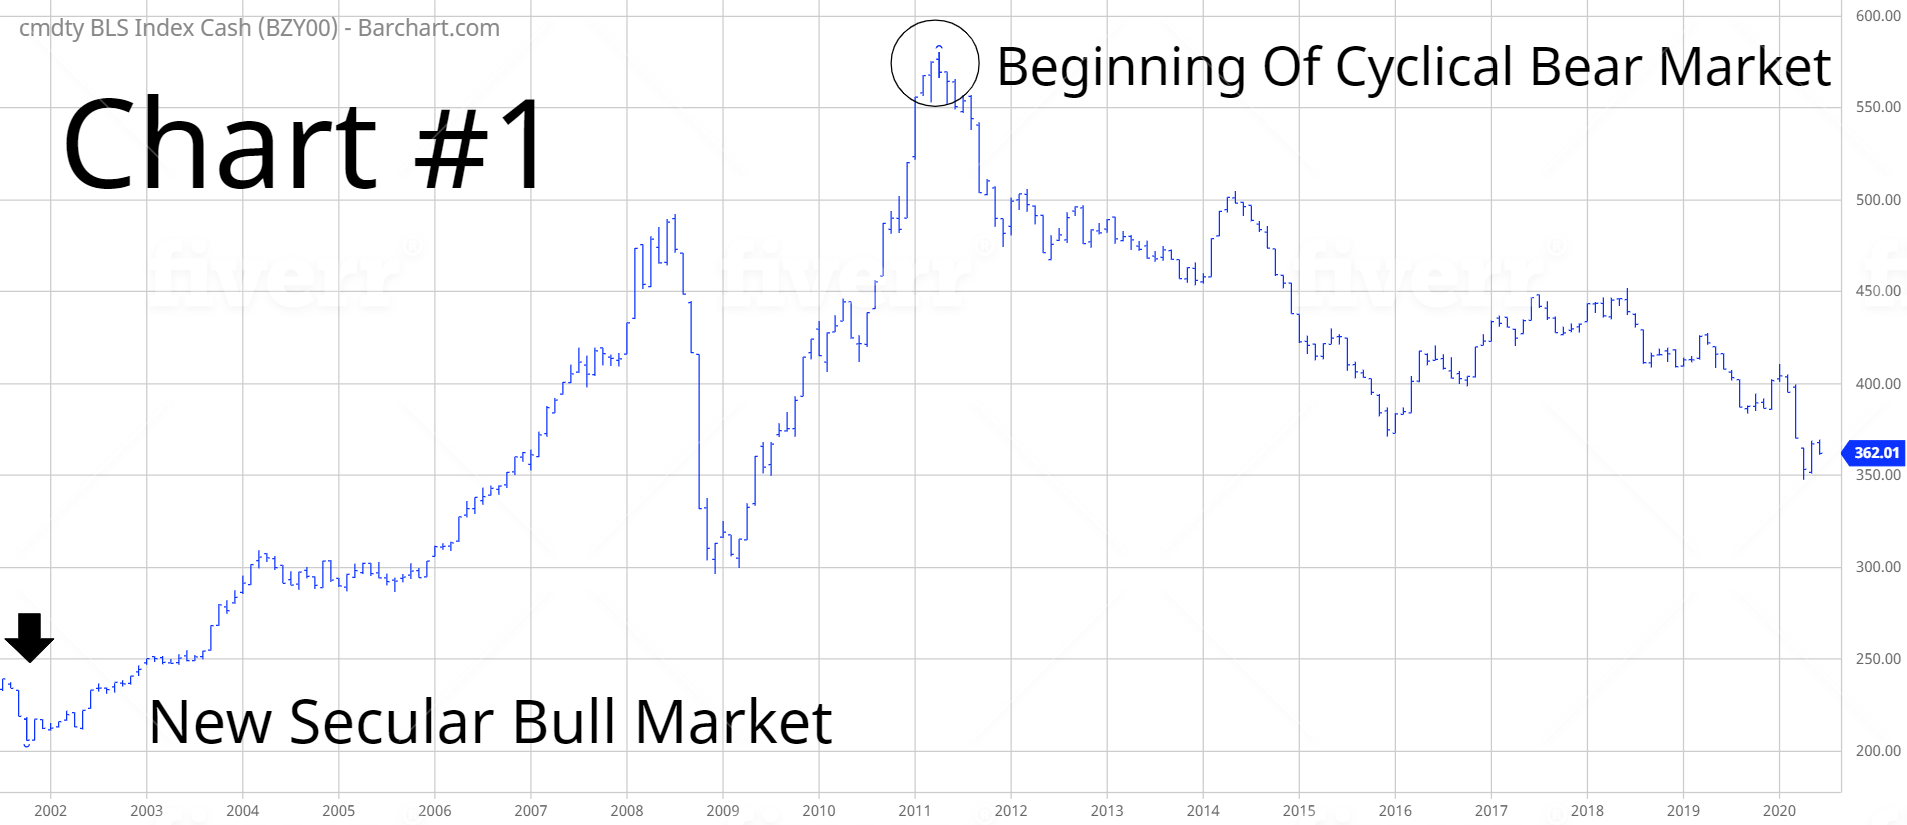
The most likely scenario is that 2011 marked the beginning of a cyclical bear market, which is scheduled to end in 2020 or 2021. Therefore, the secular bull market is still intact. Based on historical averages, the secular bull market (which began in 2001) should continue until the late-2020s. In fact, it could continue until the early-2030s.
As a side note, cyclical bull/bear markets typically last 4 to 12 years. It appears that a new cyclical commodity bull market will begin in 2021. As a result, we can expect sharply higher commodity prices for the next 5 to 8 years (beginning in 2021).
In terms of DBA, the long-term view is bearish. The next level of support is 10.98. In order to recapture the momentum, the bulls need a weekly close above 38.16. From a long-term perspective, DBA has tremendous upside potential.
SHORT-TERM CHART – DBA ETF
Please review the 6-month chart of DBA (Chart #2). In regard to the short-term trend, the bears have the upper hand. The next level of support is 12.69. Based on the current chart pattern, this decline will probably continue. In order to recapture the bullish trend, DBA needs a weekly close below 14.81.
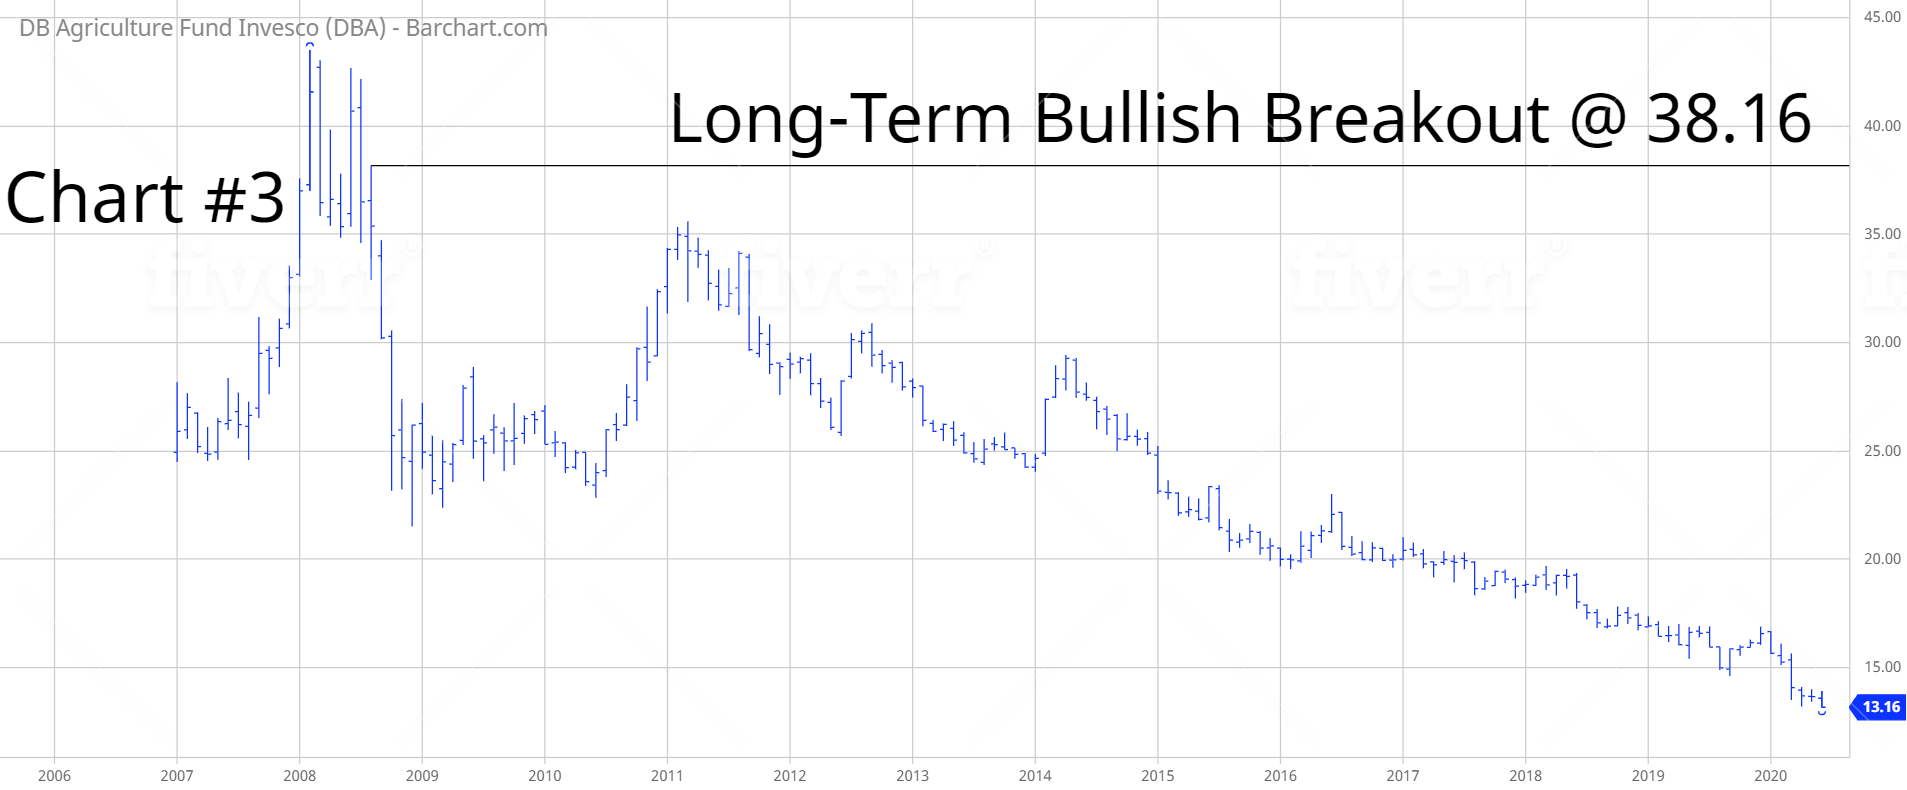
LONG-TERM CHART – DBA ETF
Please review the attached 15-year chart of DBA (Chart #3). The long-term trend is bearish. The next level of support is 10.98. In order to create a bullish chart pattern, the bulls need a weekly close above 38.16. Most likely, DBA will form a major low within the next six months. From a long-term perspective, DBA has tremendous upside potential.