SPDR S&P 500 ETF (SPY)
Key Statistics
Thank you for reading this post, don't forget to subscribe!
Minor Support Level 404.00 Minor Resistance Level 447.89
Major Support Level 155.73 Major Resistance Level 463.91
Minor Buy Signal 453.42 Minor Sell Signal 398.18
Major Buy Signal 474.40 Major Sell Signal 139.54
BRIEF OVERVIEW – SPY
Currently, the most hotly contested topic within the global investment ecosystem is inflation versus deflation. The debate between inflation and deflation has been raging since 2008, when the Federal Reserve launched its first quantitative easing program in an effort to prevent the collapse of the banking system. For the past 13 years, money managers, corporate executives, economists and financial historians have attempted to settle the inflation-deflation argument using historical data and empirical research. Is the US economy trending toward inflation or deflation? More importantly, how should investors position their portfolios? Let’s discuss the details.
Based on data provided by the Saint Louis Federal Reserve, inflation peaked in 1980 and has been trending lower for the past 41 years. Inflation has been practically non-existent for the past decade. Since 2010, the average annual rate of inflation has been 1.8%. However, many people in the global investment community remain skeptical of these numbers because several items have been excluded or improperly reported. For example, health care, home prices and educational expenses are not adequately represented in the monthly calculations. Therefore, the US rate of inflation is probably underreported. Please review the following tables.
US Inflation Rate
1980 – 2001
Date Inflation Rate Date Inflation Rate
1980 13.5% 1991 4.2%
1981 10.3% 1992 3.0%
1982 6.2% 1993 3.0%
1983 3.2% 1994 2.6%
1984 4.3% 1995 2.8%
1985 3.6% 1996 3.0%
1986 1.9% 1997 2.3%
1987 3.6% 1998 1.6%
1988 4.1% 1999 2.2%
1989 4.8% 2000 3.4%
1990 5.4% 2001 2.8%
Source Federal Reserve Bank of St Louis
US Inflation Rate
2002 – 2020
Date Inflation Rate Date Inflation Rate
2002 1.6% 2011 3.2%
2003 2.3% 2012 3.2%
2004 2.7% 2013 1.5%
2005 3.4% 2014 1.6%
2006 3.2% 2015 0.1%
2007 2.8% 2016 1.3%
2008 3.8% 2017 2.1%
2009 0.4% (-) 2018 2.4%
2010 1.6% 2019 1.8%
2020 1.4%
Source Federal Reserve Bank of St Louis
The Bureau of Labor Statistics (BLS) is responsible for calculating the monthly rate of inflation, more commonly known as the Consumer Price Index (CPI). In addition to calculating the monthly CPI, the BLS also includes the “core” rate of inflation. The core rate is incredibly unpopular among investors because it fails to include food and energy prices. In an effort to determine prices at the wholesale level, the BLS releases the Producer Price Index (PPI), which is typically made available to the general public 24 hours after the release of the CPI. Both of these inflation indices have been altered several times during the past few decades, which explains why the general public has very little faith in the data.
In an effort to provide investors with exposure to the S&P 500, the SPDR family of exchange-traded funds introduced the S&P 500 ETF on 22 January 1993. The ticker symbol is SPY. The ETF allows investors to participate in the S&P 500 without the burden of owning shares of each company within the index. SPY is historically significant because it was the very first exchange-traded fund listed in the United States. SPY is easily the most heavily traded ETF, with daily volume quite often exceeding 100 million shares.
SHORT-TERM VIEW
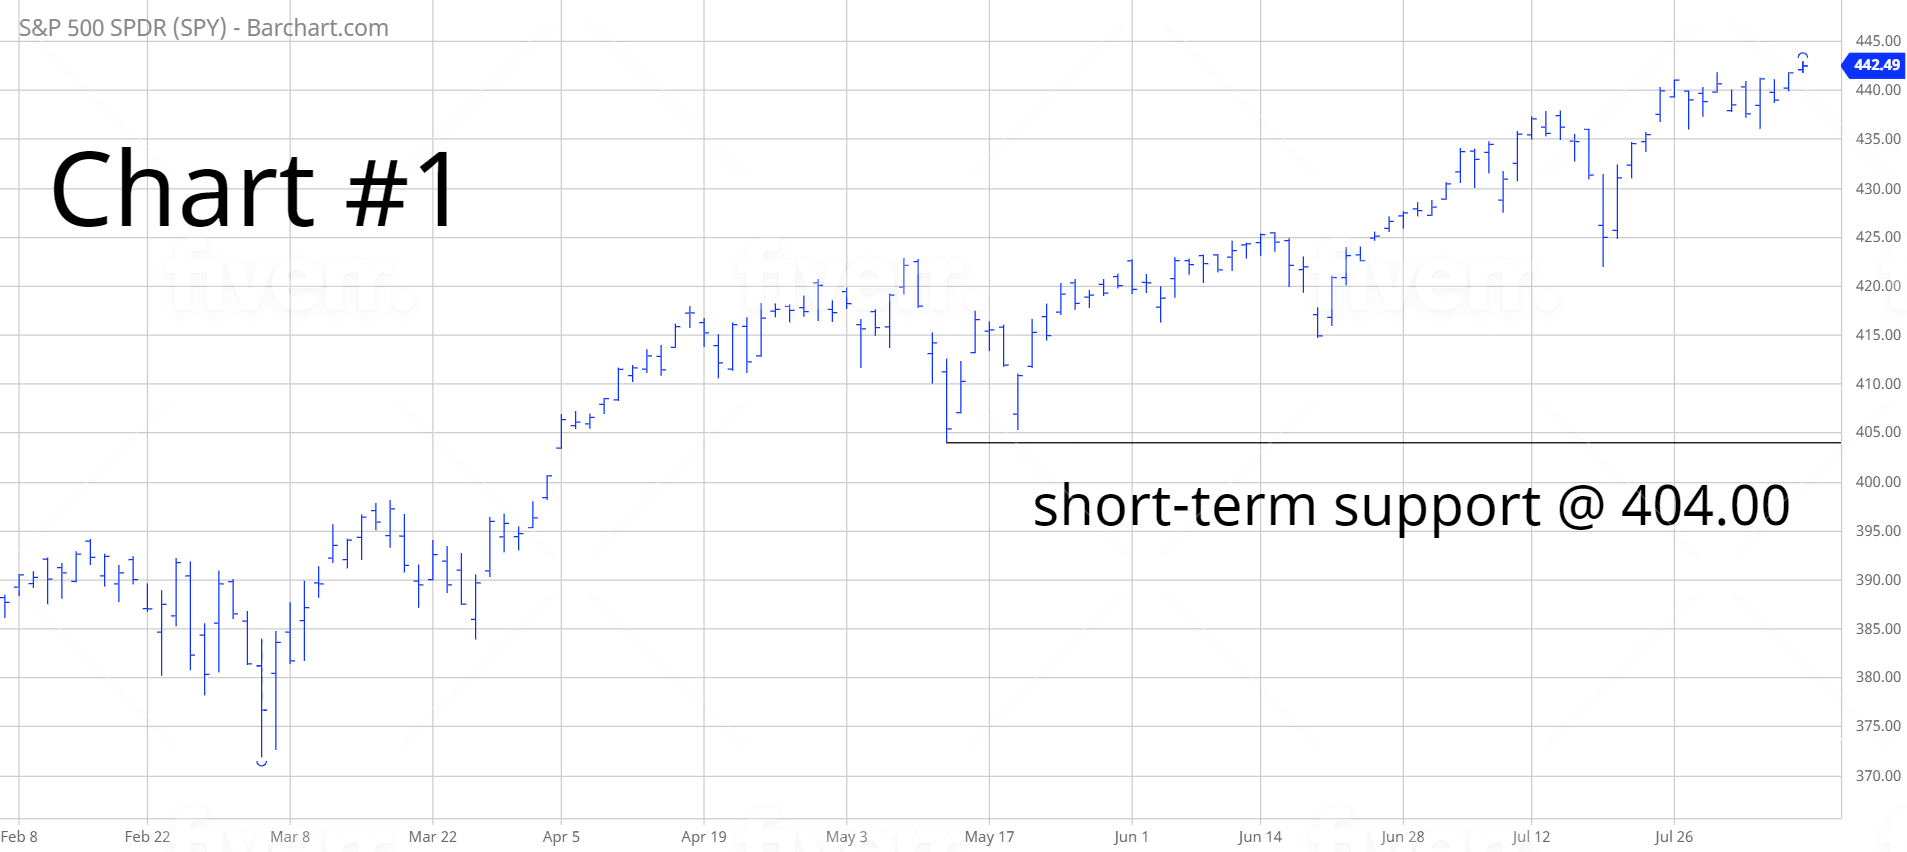
Essentially, SPY has been in a continuous uptrend since the pandemic low in March 2020. There have been a few short-term declines along the way. However, the vast majority of the momentum has been in favor of the bulls. The next level of resistance is 447.89. The bears need a weekly close below 404.00 in order to recapture the momentum.
LONG-TERM VIEW
Over the long run, it’s impossible to accurately forecast the true rate of inflation because there are so many variables and moving parts. However, we can form an educated guess by reviewing the items that constitute the majority of our monthly living expenses. Let’s begin by creating a list of the most common living expenses.
Average Annual Expenditures
2016 – 2019
Category 2016 2017 2018 2019
Food 7,203 7,729 7,923 8,169
Housing 18,886 19,884 20,091 20,679
Clothing 1,803 1,833 1,866 1,883
Transportation 9,049 9,576 9,761 10,742
Healthcare 4,612 4,928 4,968 5,193
Entertainment 2,913 3,203 3,226 3,090
Education 1,329 1,491 1,407 1,443
Miscellaneous 959 1,010 993 899
Source Bureau of Labor Statistics | US Dollars
This table contains a list of the most common living expenses for the average American consumer. Based on data provided by the BLS, average annual expenditures in 2019 was $63,036. Let’s review the percentage increase of each item over the course of the past four years.
Average Annual Price Increase
Food 3.4%
Housing 2.4%
Clothing 1.1%
Transportation 4.7%
Healthcare 3.1%
Entertainment 1.5%
Education 2.1%
From 2016 through 2019, the most common living expenses increased by 2.6% per year. How does this number compare to the official rate of inflation during the same time period? As you can see from the table, the average annual rate of inflation from 2016 through 2019 was 1.9%. On the surface, the difference between 2.6% and 1.9% appears to be rather miniscule. However, on a percentage basis, there is a huge disparity between these two numbers. Specifically, the difference is 36.8%. In other words, the most common living expenses for the average American consumer is 36.8% above the US government’s official rate of inflation. Based on this data, American consumers are experiencing levels of inflation well above the official stated rate. It’s difficult to deny that inflation doesn’t exist in the United States.
For the past several years, economists and money managers have argued that the data gathered by the Bureau of Labor Statistics does not accurately reflect the true level of inflation. As we mentioned previously, it’s impossible to correctly forecast the true rate of inflation because there are too many variables. The inflation rate can be substantially influenced simply by using different data. For example, Statista is one of the most highly respected research companies in the world. Several months ago, the company completed a comprehensive study on the cost of healthcare in the United States. Please review the following table.
Annual Change In Medical Costs
- 2010 9.0%
- 2011 9.0%
- 2012 8.5%
- 2013 7.5%
- 2014 6.5%
- 2015 6.8%
- 2016 6.2%
- 2017 5.5%
- 2018 5.7%
- 2019 5.7%
- 2020 6.0%
Based on the data collected by Statista, the cost of healthcare in the United States increased by 6.9% per year over the course of the past 11 years. From 2016 through 2019, the average increase was 5.8%. This number is dramatically above the BLS number. According to the Bureau of Labor Statistics, healthcare costs expanded by 3.1% from 2016 through 2019. The data provided by Statista is 87% above the BLS data. This is huge!
The healthcare data certainly suggest that inflation numbers in the United States are most likely underreported. As investors, should we be concerned that US inflation is probably trending at a much higher pace than the official BLS numbers? At least for now, investors appear to be completely unfazed by this discrepancy. The stock market is in the midst of the greatest bull market of all-time. However, as inflation begins to grind its way higher during the next several years, this could become a major problem for stock market investors.
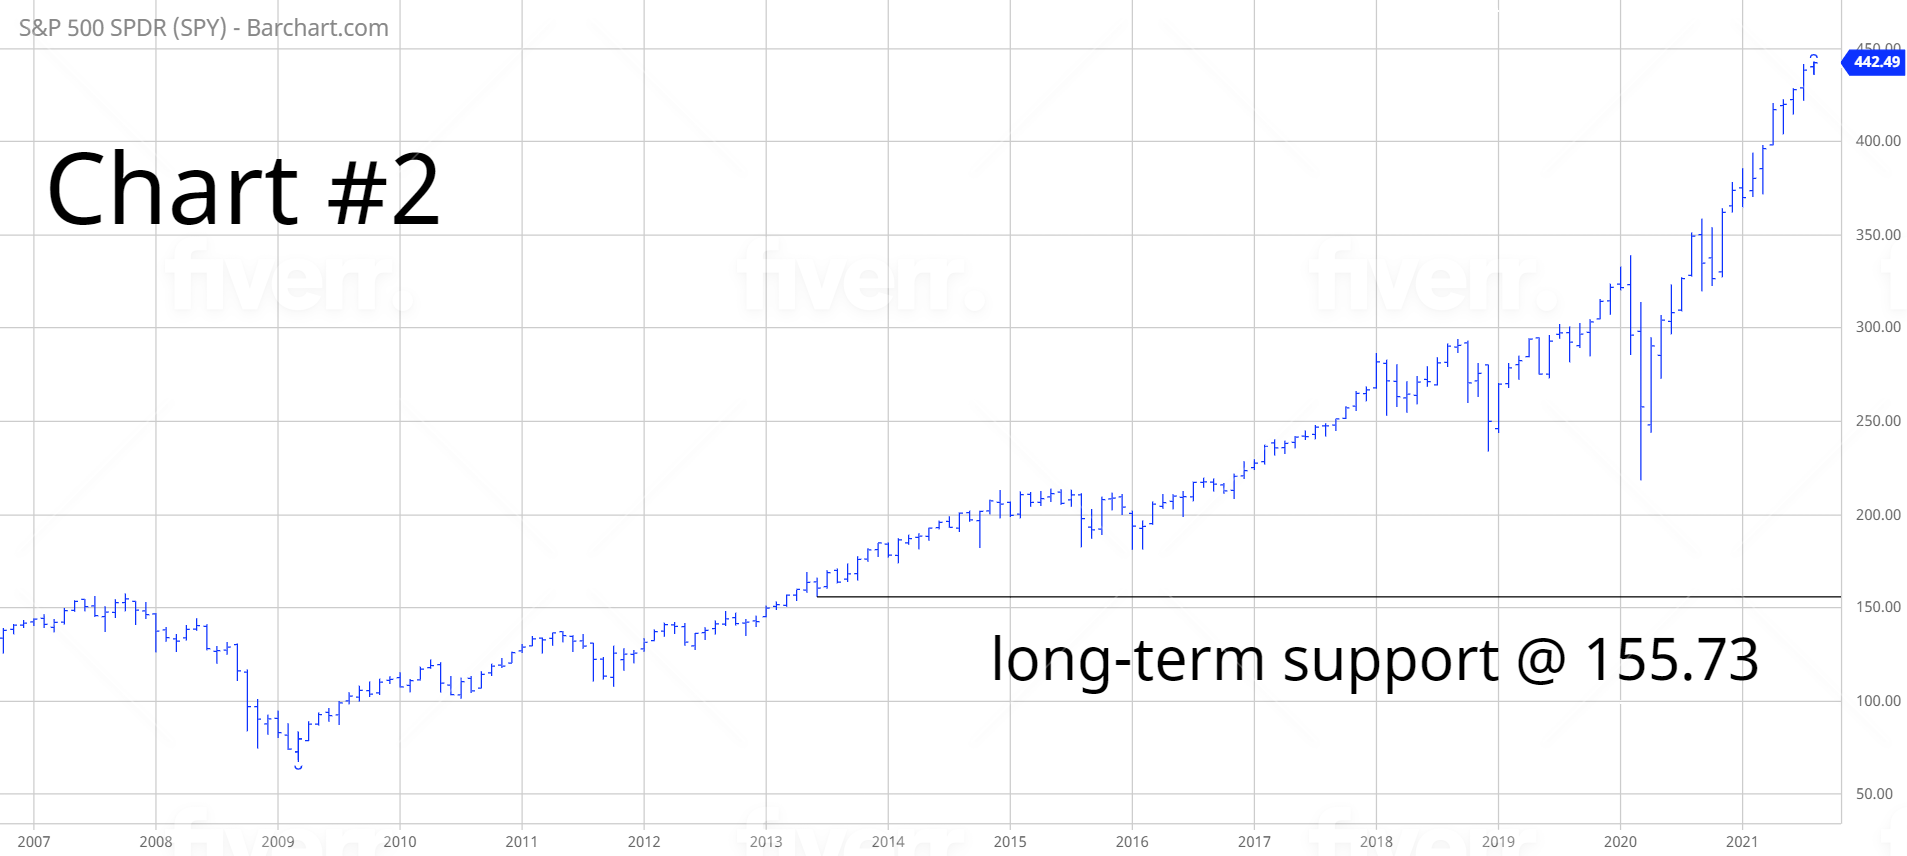
In regard to SPY, the long-term view remains extremely bullish. The next resistance level is 463.91. A weekly close below 155.73 is needed in order to reverse the momentum. It’s highly unlikely that the long-term momentum will turn bearish any time in the near future. Global central banks continue to print unlimited sums of money. As long as the money printing continues, equity prices will drift higher.
SHORT-TERM TREND – SPY
Please review the 6-month chart of SPY (Chart #1). The ETF remains in bullish territory on a short-term basis. The next level of resistance is 447.89. The chart pattern will remain bullish as long as SPY stays above 404.00 on a weekly closing basis. The most likely scenario is a continuation of higher prices.
LONG-TERM TREND – SPY
Please review the 15-year chart of SPY (Chart #2). The long-term chart pattern is clearly in favor of the bulls. The next level of resistance is 463.91. A weekly close below 155.73 is needed to flip the chart into a bearish formation.