

SPDR Dow Jones Industrial Average ETF (DIA)
Key Statistics
Thank you for reading this post, don't forget to subscribe!
Minor Support Level 315.83 Minor Resistance Level 351.09
Major Support Level 112.14 Major Resistance Level 366.69
Minor Buy Signal 357.05 Minor Sell Signal 307.90
Major Buy Signal 376.33 Major Sell Signal 101.33
BRIEF OVERVIEW – DIA
When World War I officially ended on 11 November 1918, the vast majority of economists and financial professionals were forecasting a sharp economic contraction in the United States. This forecast was based on the fact that government expenditures increased exponentially from 1914 through 1918, in response to the war effort. US gross domestic product (GDP) exploded during this time period. However, economists were certain that GDP would return to a more normal growth rate following the end of the war. These economic forecasts proved to be 100% correct, as fiscal spending declined substantially beginning in 1919, while the country was attempting to find its footing in a post-war economic environment.
US Gross Domestic Product
- 1914 – 36.831
- 1915 – 39.048
- 1916 – 50.117
- 1917 – 60.278
- 1918 – 76.567
- 1919 – 79.090
- 1920 – 89.246
- 1921 – 74.314
As you can see from the data, thanks to excessive fiscal outlays, the US economy enjoyed four consecutive years of unprecedented economic prosperity. Although specific data is unavailable, many financial historians claim that US GDP growth during WWI was very similar to the growth that occurred during various phases of the Industrial Revolution. In both instances, economic activity far exceeded historical averages.
In 1914, as the United States entered WWI, the domestic economy produced $36.831 billion of goods and services. When the war ended in November 1918, annual economic growth had surged to $76.567 billon. This represented a massive increase of 108% in less than five years. Even to this day, 100+ years removed from the end of WWI, the US economy has never experienced such a remarkable period of creating goods and services.
As we previously mentioned, the overwhelming majority of professional economists were quite confident that the production of goods and services would experience a sharp decline beginning in 1919. As the data clearly indicate, the US economy eventually suffered a brutal contraction. However, it did not unfold until two full years after the official end of the war. What happened? Why did the US economy continue to expand in 1919 and 1920, even though fiscal spending fell substantially beginning in late-1918? In 1918, a global pandemic was unleashed across the planet. It was an influenza pandemic commonly referred to as the Spanish flu. Officially, the pandemic continued from February 1918 through April 2020. It infected about 500 million people, which accounted for 30% of the world’s population.
As you can see from the GDP data, the pandemic had no effect on the US economy in 1919. In fact, economic growth in 1919 actually exceeded the level from 1918. Why did the economy continue to expand despite the pandemic? Experts claim that massive fiscal spending from the war effort spilled over into 1919, even though the war ended in late-1918. Many financial historians were quite surprised by the strength of the economy in 1919 because, in an attempt to prevent the spread of the Spanish flu, the federal government forced many businesses to shut down their operations. This explains why the economy exploded in 1920. The production of goods and services increased by 12.8% to $89.246 billion. Pent-up demand for goods and services in 1919 caused by the pandemic, spilled over into 1920. Consequently, the United States enjoyed a booming economy in 1920.
Economic activity was rather subdued in 1921 based on the fact that consumers spent so heavily in 1920. Therefore, GDP declined substantially in 1921. On a percentage basis, the US economy collapsed by 16.7%. In fact, activity was so weak that many economists and statisticians labeled 1921 as a mini-depression. Even today, financial historians refer to 1921 as the “forgotten depression.” Please review the following data.
US Gross Domestic Product
- 1922 – 74.140
- 1923 – 86.238
- 1924 – 87.786
- 1925 – 91.449
- 1926 – 97.885
- 1927 – 96.466
- 1928 – 98.305
- 1929 – 104.6
As you can see, 1922 was a rather uneventful year. The slow economic activity from 1921 carried over into 1922. However, the economy experienced a dramatic surge in 1923. The production of goods and services soared to $86.238 billion, a substantial increase of 16.3% from the previous year. In fact, the US economy continued to generate impressive levels of growth for the remainder of the decade. From 1922 through 1929, the economy soared by 41.1%. This marked the greatest decade of economic expansion in the history of the United States. Over the course of the next few decades, this time period became known as the Roaring Twenties.
The SPDR family of exchange traded funds (managed by State Street Global Advisors) introduced the Dow Jones Industrial Average ETF on 14 January 1998. The ticker symbol is DIA. This ETF is a perfect vehicle for investors who wish to participate in the performance of DJIA. DIA is an extremely popular ETF, with an average daily volume of nearly six million shares. The ETF is commonly referred to as “Diamonds.” The top five holdings include UnitedHealth Group, Goldman Sachs, Home Depot, Boeing and Amgen.
SHORT-TERM VIEW – DIA
DIA remains in bullish territory on a short-term basis. The next level of resistance is 351.09. In order to recapture the momentum, the bears need a weekly close below 315.83. The most likely scenario is a continuation of higher prices.
Based on the Aroon Oscillator, DIA has a neutral reading of -28. The Aroon Oscillator is programmed differently than most stochastic indicators. The oscillator fluctuates between -100 and +100. A reading of 0 would indicate a neutral position. Therefore, a reading of -28 is considered fairly neutral. Based on the current level of the oscillator, the next big move could be in either direction. The most likely direction is a breakout to the upside.
LONG-TERM VIEW – DIA
Many economists and financial historians believe that the United States is headed for a repeat of the 1920s. They point to the fact that today’s social and economic landscape is eerily similar to the 1920s. For example, the planet was dealing with a global pandemic from 1918 through 1920, very similar to COVID-19 in 2020 and 2021. Additionally, there was a great deal of social unrest mixed with an increase in violence and crime throughout the 1920s. The vast majority of violence and crime in the 1920s was attributed to the rise of organized crime and street gangs. Today, we are experiencing an inordinate amount of social unrest and an uptick in crime.
In regard to the economy, the 1920s were marked with a wave of technological innovation, increased levels of speculation, easy access to capital and a booming stock market. Consumers were introduced to several new gadgets and electronic devices. Examples include: automobile, airplane, television, refrigerator, washing machine and instant camera. The introduction of the assembly line also occurred in the 1920s, which substantially increased worker productivity. Consumers and businesses had virtually unlimited access to loans and other lines of credit. This easy access to capital added fuel to the stock market and other forms of speculation.
Are we witnessing a repeat of the 1920s in terms of technological innovation and extreme levels of speculation? Yes, it certainly appears as though innovation and speculation are following the same path of the 1920s. We are all familiar with Bitcoin, blockchain technology and decentralized finance. Most likely, the financial services industry will experience massive disruption over the course of the next decade. This is very similar to what occurred in the 1920s when mainstream adoption of the automobile negatively affected several industries. In regard to speculation, stocks are near an all-time high and speculative fever is running rampant. Access to credit is available to practically anyone these days, very similar to the 1920s, as speculators borrowed money to “play” the stock market.
If the US economy is indeed on the verge of experiencing another Roaring Twenties, we should be prepared for a massive economic contraction in 2022. As we previously discussed, the production of goods and services plummeted in 1921, one year after the end of the global pandemic. During the past six months, the domestic economy has enjoyed a huge burst of activity caused by the COVID lockdown in 2020. The current rate of growth is unsustainable. Therefore, a contraction in 2022 is quite possible. If we follow the path of the 1920s, investors can expect substantial economic growth and an extraordinary bull market from 2023 through 2029.
Please review the similarities between the 1920s and 2020s:
- Global pandemic from 1918 through 1920.
- Global pandemic from 2019 through 2021.
- Major technological innovations in the 1920s.
- Major technological innovations in the 2020s.
- Social unrest in the 1920s.
- Social unrest in the 2020s.
- Rise in violence and crime throughout the 1920s (organized crime).
- Rise in violence and crime throughout the 2020s (cyber-crime).
- Easy access to credit throughout the 1920s.
- Easy access to credit throughout the 2020s.
- Booming stock market in the 1920s.
- Booming stock market in the 2020s.
- Substantial income gap between the rich and the poor in the 1920s.
- Substantial income gap between the rich and the poor in the 2020s.
- Automation of work throughout the 1920s (assembly line).
- Automation of work throughout the 2020s (robotics).
- Major changes in transportation in the 1920s (automobiles).
- Major changes in transportation in the 2020s (self-driving cars).
In regard to DIA, the long-term view remains extremely bullish. The next resistance level is 366.69. A weekly close below 112.14 is needed in order to reverse the momentum. It’s highly unlikely that the long-term momentum will turn bearish any time in the near future. However, if global central banks begin to reduce their money printing programs, the bull market could unravel very quickly.
SHORT-TERM TREND – DIA
Please review the 6-month chart of DIA (Chart #1). DIA remains in bullish territory on a short-term basis. The next level of resistance is 351.09. The chart pattern will remain bullish as long as DIA stays above 315.83 on a weekly closing basis. The most likely scenario is a continuation of higher prices.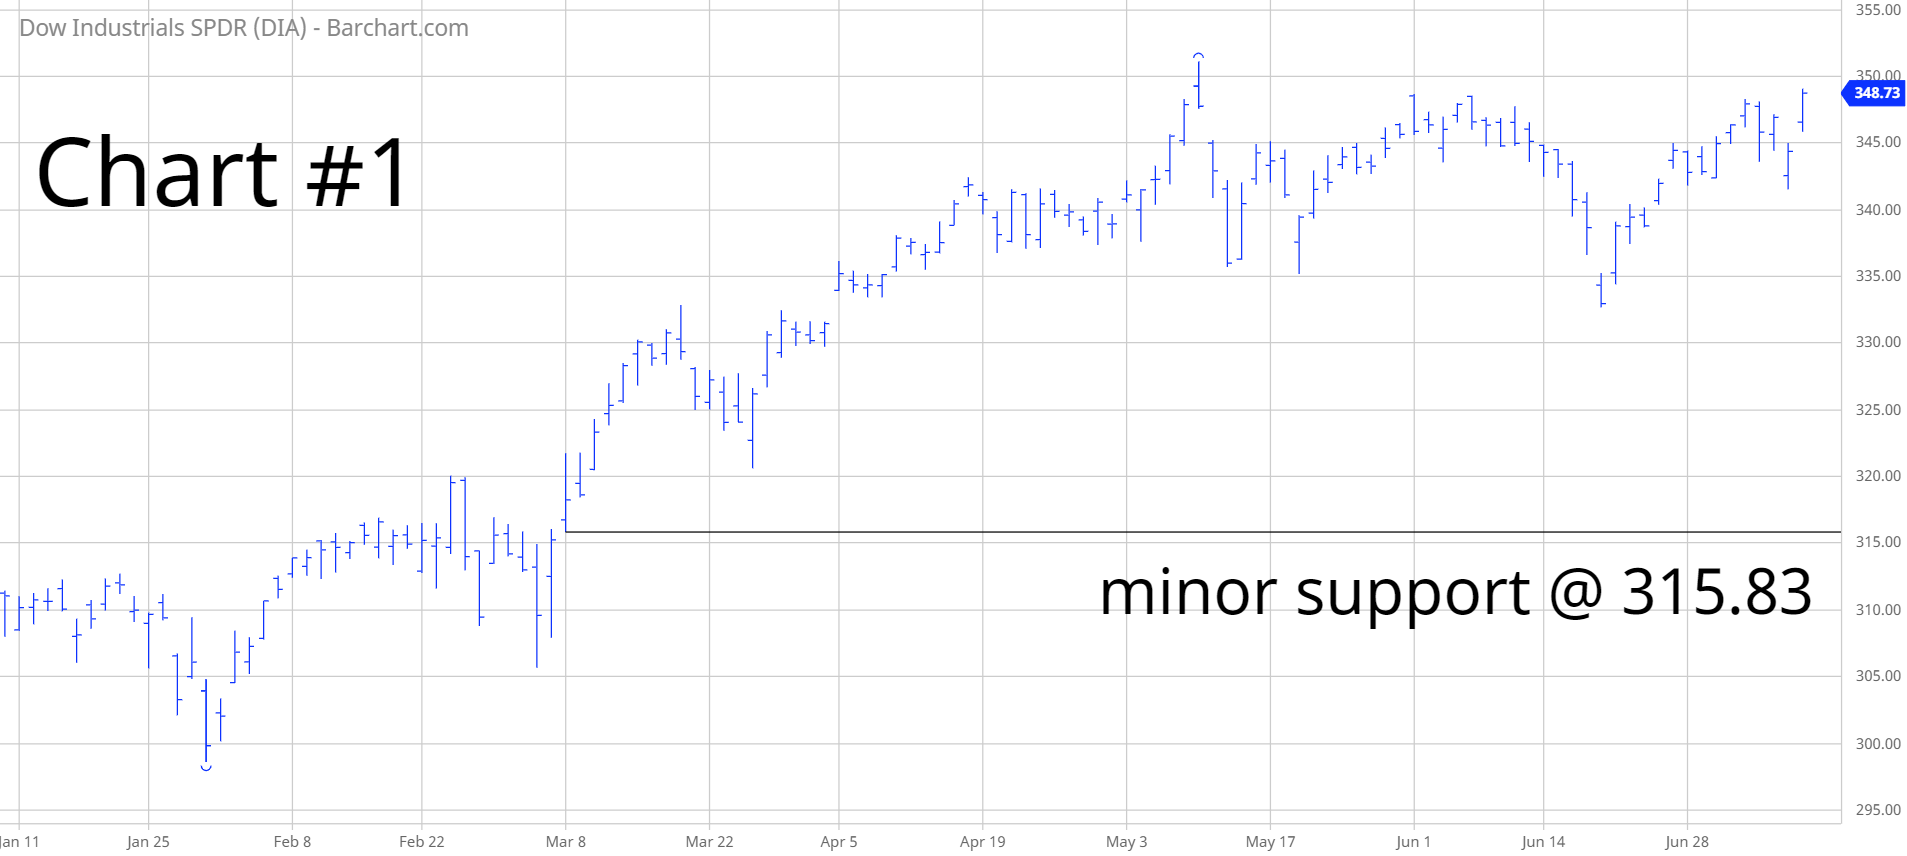
LONG-TERM TREND – DIA
Please review the 15-year chart of DIA (Chart #2). The long-term chart pattern continues to remain extremely bullish. The next level of resistance is 366.69. A weekly close below 112.14 is needed to flip the chart into a bearish formation.

