US Oil Fund ETF (USO)
Key Statistics
Thank you for reading this post, don't forget to subscribe!
Minor Support Level 16.88 Minor Resistance Level 68.80
Major Support Level 4.93 Major Resistance Level 714.40
Minor Buy Signal 81.40 Minor Sell Signal 9.50
Major Buy Signal 829.12 Major Sell Signal 1.24
BRIEF OVERVIEW – US Oil Fund ETF USO
Crude oil is arguably the most important industrial commodity on the planet. It is the single biggest source of primary energy. Crude oil accounts for 30% of all energy used by humans. This explains why investors are keenly interested in trying to determine its future direction.
With the exception of copper, crude oil is probably the best indicator for determining the future direction of the global economy. Obviously, without energy, it’s impossible to generate economic growth. Has the recent collapse in the crude oil market increased the likelihood of a global depression? Let’s examine the details.
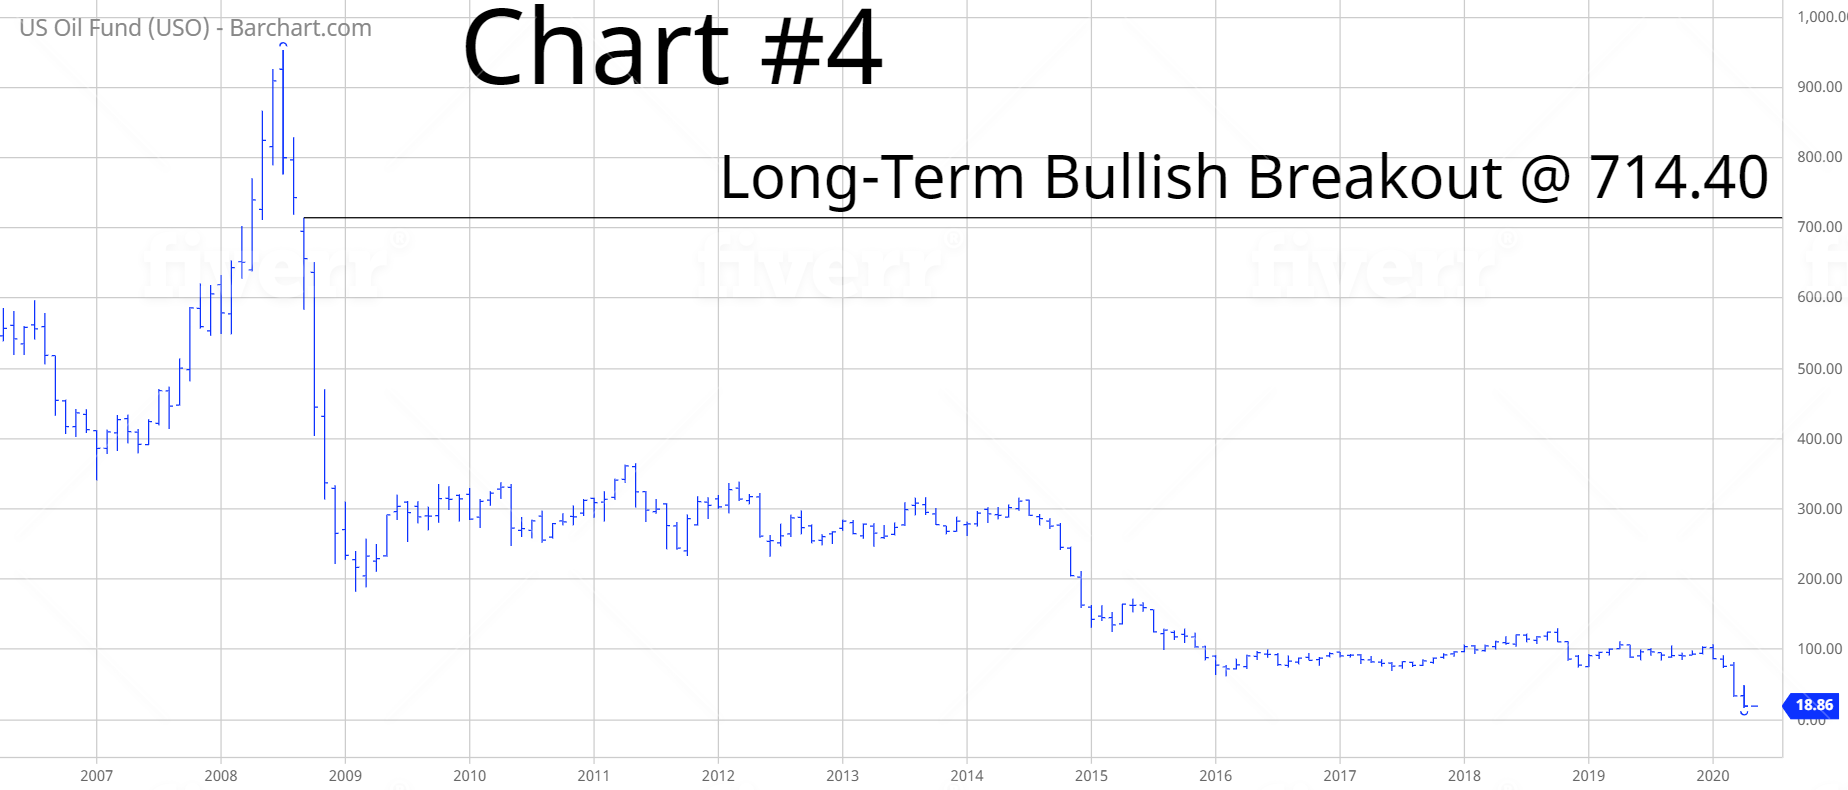
On 20 April, crude oil set a record by becoming the first commodity in modern history to fall below the price of $0. In fact, crude oil fell $40.32 below $0 (Chart #1). Most likely, this anomaly will never be repeated again. What happened? Why did crude oil experience such a violent decline? In a single word, the reason energy markets collapsed is “oversupply.” This problem had been brewing in the crude oil market for the past few months. The coronavirus was the straw that broke the camel’s back. It became a perfect storm scenario.
During the overnight trading session on 20 April, rumors began to circulate that the global storage capacity had reached its limit. Investors began to panic as everyone tried to liquidate the May futures contract at the same time. Speculators and hedgers simply disappeared in terms of providing liquidity for the May contract. This explains why crude oil experienced a “flash crash.” During the next trading session on 21 April, the market stabilized rather quickly and the price rallied well above $0. Most professional crude oil traders and energy experts agree that this type of price collapse will probably never occur again.
United States Commodity Funds LLC introduced a crude oil tracking ETF in April 2006. It trades under the ticker symbol USO. It tracks the price of crude oil using the West Texas Intermediate (WTI) crude oil spot futures contract traded on the New York Mercantile Exchange. USO is an extremely popular product within the ETF investment community. The average daily volume during the past 90 days is approximately 18 million shares. The ETF has 196.9 million shares outstanding.
SHORT-TERM VIEW – US Oil Fund ETF USO
In regard to the short-term view, the bears are in complete control of USO. The ETF has been steadily declining since January. The next level of support is 16.88. In order to recapture the momentum, the bulls need a weekly close above 68.80.
Based on the Aroon Oscillator, USO has an oversold reading of -64. The Aroon Oscillator is programmed differently than most stochastic indicators. The oscillator fluctuates between
-100 and +100. A reading of 0 would indicate a neutral position. Therefore, a reading of -64 is certainly near the lower end of the range. Based on its oversold reading, USO could easily generate a short-term rally.
LONG-TERM VIEW – US Oil Fund ETF USO
Given the fact that crude oil is the driving force behind the performance of USO, let’s take a long-term “big picture” view of the market.
In December 1998, the price fell to a 13-year low @ $10.98 per barrel. The world oil supply was completely out of balance with global demand. The majority of the supply glut was blamed on OPEC’s inability to prevent its members from cheating on their production quotas.
At the time in 1998, OPEC was producing approximately 40% of the world’s crude oil. As a result, they had a dramatic influence on the price.
In early 1999, the members of OPEC held a series of meetings in order to address the issue of overproduction and cheating. This marked the beginning of a massive 9-year bull market in crude oil. The market experienced a price increase of 1,241% from December 1998 through July 2008. Crude oil peaked @ $147.27 on July 14, 2008.
The record bull market ended with the great financial crisis of 2008. The price of crude oil plummeted from July 2008 through January 2009. The price dropped from $147 to $33 in less than six months.
Along with all other commodities, crude oil enjoyed a nice rally for the next few years as the Federal Reserve injected over $2 trillion into the banking system in order to stimulate our nation’s economy. The market enjoyed a substantial rally from 2009 through 2013, as prices increased from $33 to $114.
In 2014, OPEC found itself facing the same problems that plagued the oil cartel in the late 1990s. The vast majority of the OPEC members were cheating on their production quotas, which caused a major oversupply problem in the world oil market. Crude oil prices collapsed from $114 to $26 in less than three years.
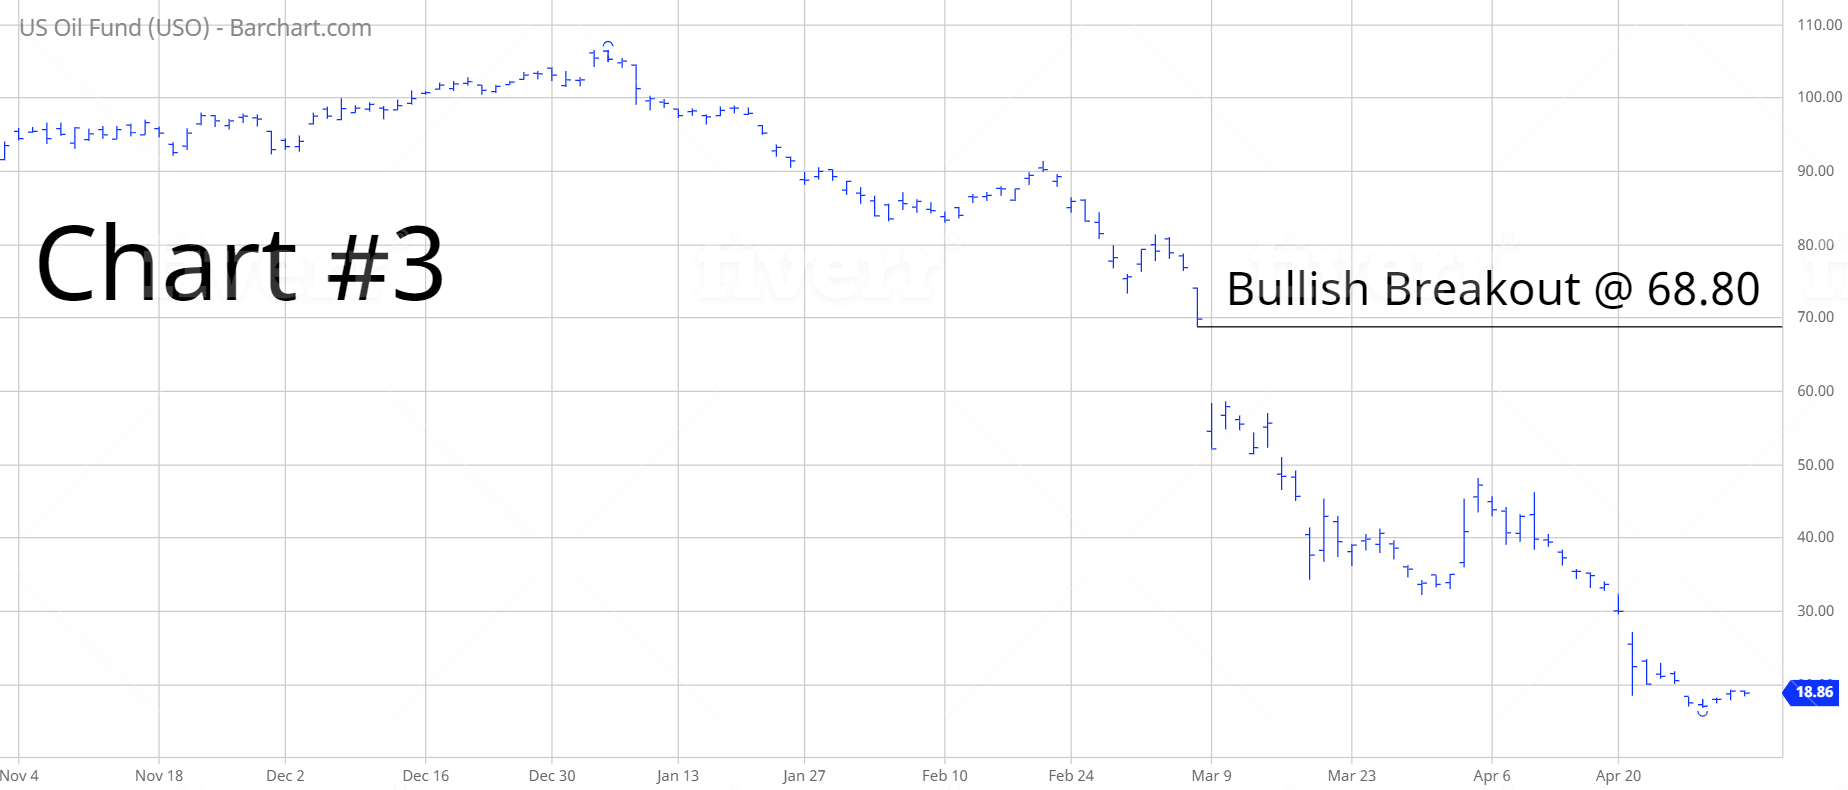
Thanks to aggressive monetary action by the Federal Reserve, crude oil enjoyed a nice recovery beginning in February 2016. Over the course of the next 32 months, the market gained 195% (Chart #2). However, the party ended in October 2018, as energy experts finally faced the realization that the global economy was not strong enough to support $80 crude oil.
Prior to the coronavirus outbreak in January, crude oil prices were drifting lower. However, the market collapsed on 9 March when Saudi Arabia and Russia were unable to reach an agreement concerning crude oil production cuts. The global pandemic was the straw that broke the camel’s back. The crude oil market simply could not handle the “double whammy” of excessive oil production and COVID-19 at the same time. This explains why the price collapsed on 20 April.
Where do we go from here? Most likely, crude oil will trade sideways for the next 12 to 18 months. However, the next “big move” will be to the upside. Prices are headed dramatically higher over the course of the next 3 to 5 years. Thanks to historically low oil prices, the entire energy sector is on the verge of collapse. Oil exploration companies are shutting down their operations at a record pace. When crude oil demand finally returns in a few years, there will be no available supply to meet the demand. Consequently, prices will move dramatically higher. In fact, crude oil could easily exceed its all-time high from 2008 @ $147 per barrel. Be prepared for much higher prices.
In regard to USO, the long-term view is certainly bearish. The ETF is hovering near its all-time low. Since its inception in 2006, USO has fluctuated between 16.88 and 953.36. Based on its current price of 18.86, USO is undeniably in a long-term bear market. In order to reverse the bearish momentum, the bulls need a weekly close above 714.40.
SHORT-TERM CHART
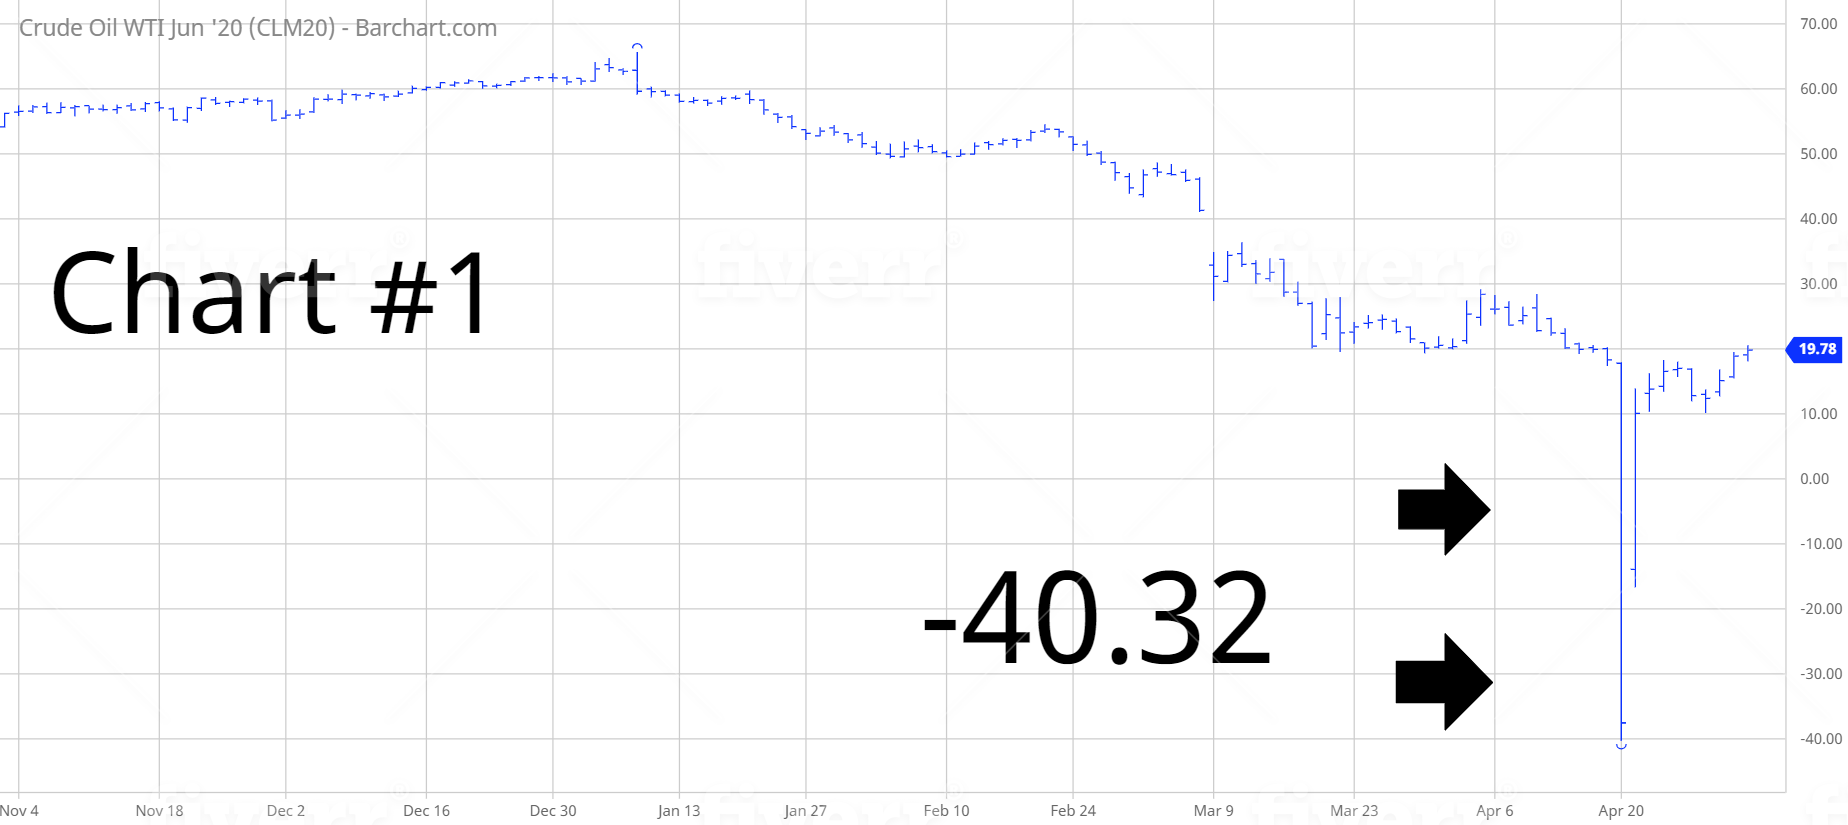
Please review the attached 6-month chart of USO (Chart #3). The bears are in control of the short-term trend. The next level of support is 16.88. In order to reverse the bearish chart pattern, the bulls need a weekly close above 68.80.

LONG-TERM CHART
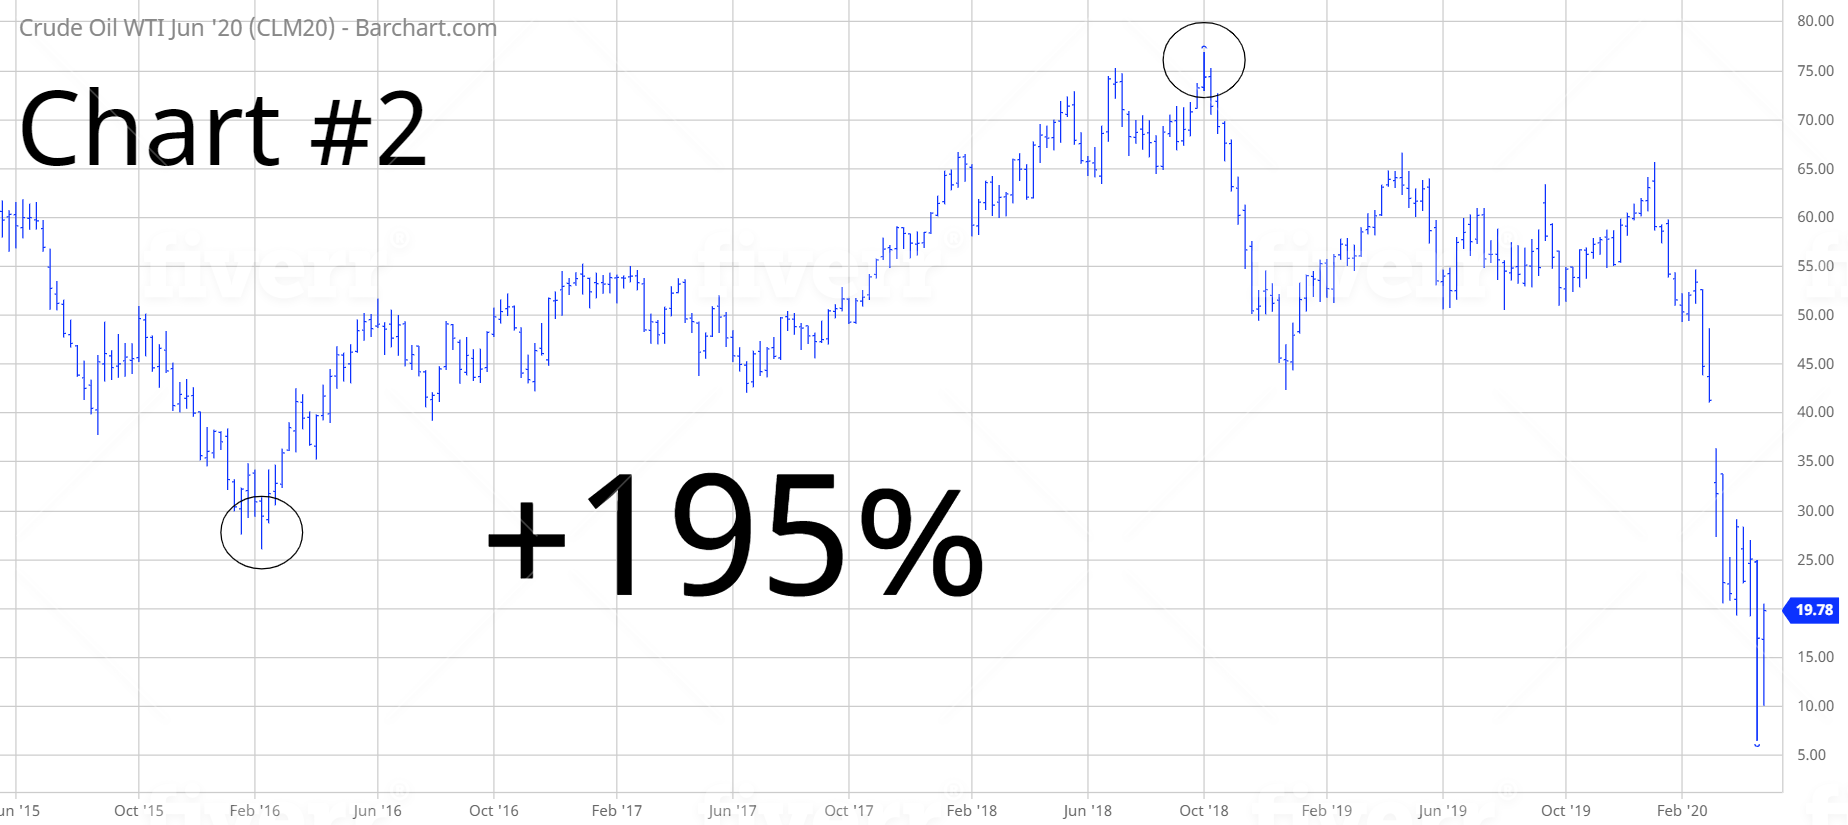
Please review the attached 14-year chart of the USO (Chart #4). This chart covers the entire trading history of the ETF. The long-term chart pattern is incredibly bearish. However, don’t be surprised if USO embarks on a massive bull run by the end of 2021. Thanks to COVID-19, the crude oil supply chain is in the process of being destroyed. This is very bullish on a long-term basis. Bullish breakout occurs @ 714.40.