iShares Core US Aggregate Bond ETF (AGG)
Key Statistics
Minor Support Level 111.08 Minor Resistance Level 117.68
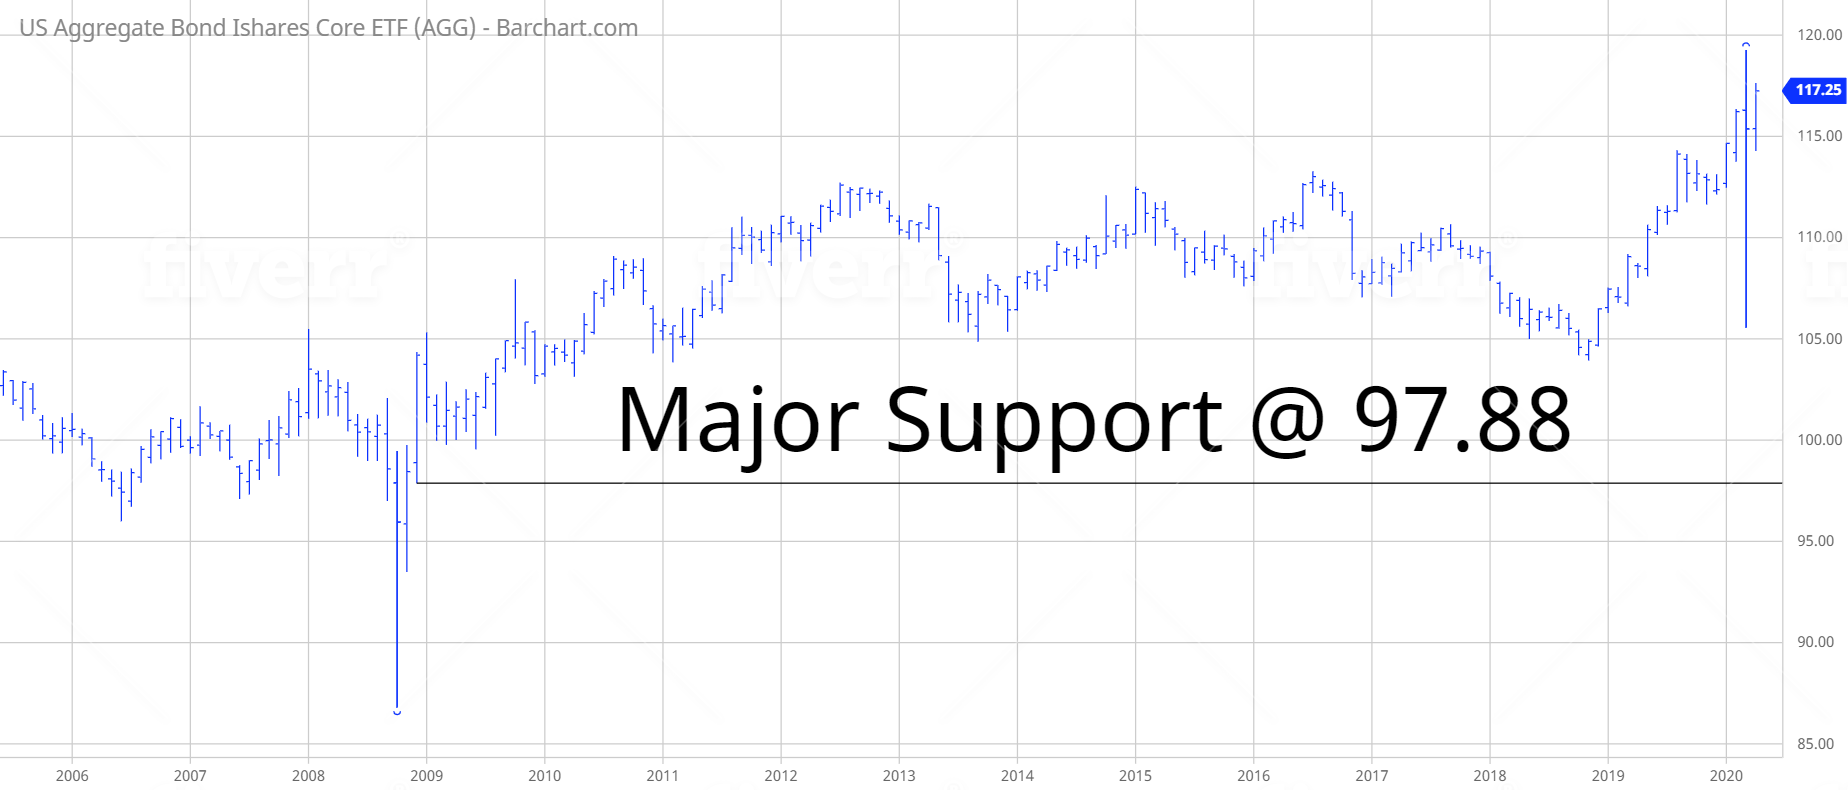
Thank you for reading this post, don't forget to subscribe!Major Support Level 97.88 Major Resistance Level 124.51
Minor Buy Signal 119.27 Minor Sell Signal 109.00
Major Buy Signal 127.75 Major Sell Signal 93.51
BRIEF OVERVIEW
On 16 August 1971, President Richard Nixon undertook one of the boldest moves in modern American history when he removed the United States from the Bretton Woods Agreement by closing the gold window. What exactly happened when Nixon closed the gold window? What were the economic ramifications? Let’s review the details.
Essentially, the Bretton Woods Agreement was designed to increase global trade by requiring all participating countries to use the US Dollar as their payment mechanism. In exchange for conducting all commercial trading in Dollars, participating countries were allowed to convert their US Dollars into gold.
This system worked quite well from its inception beginning in 1944. For the next 20 years, all 44 countries who signed the Bretton Woods Agreement were quite pleased with the results. Global trade increased dramatically, particularly for those countries who were attempting to recover from the devastation of World War II. Beginning in the mid-1960s, a few of the larger participating countries (i.e. France, Japan & West Germany) began to experience economic problems in their home countries. In an effort to stabilize their domestic economy, each country began to sell its holdings of US Dollars in exchange for gold. Of course, the simultaneous selling of the Dollar forced the value of the greenback to decline. Member countries became increasingly nervous as they watched the value of their Dollar holdings lose purchasing power. Very soon, all countries were selling Dollars in exchange for gold.
Over the course of the next few years, the United States tried to stabilize its declining currency. However, the Dollar continued to erode in value against the majority of the currencies within Bretton Woods Agreement. In August 1971, President Nixon met secretly with Federal Reserve Chairman Arthur Burns, Treasury Secretary John Connally and IMF undersecretary Paul Volcker. The purpose of the meeting was to devise a strategy to stabilize the value of the US Dollar. After three days of intense debate, Nixon followed the advice of Secretary Connally by suspending the convertibility of the US Dollar into gold. For all practical purposes, Nixon’s announcement on 15 August 1971 ended the Bretton Woods Agreement. This marked the unofficial beginning of floating exchange rates and unlimited fiat money creation.
How did Wall Street react to Nixon’s announcement? The response on Wall Street was incredibly bullish. Nixon made a brilliant strategic move by making his announcement to the American public when the financial markets were closed on Sunday, 15 August. This gave investors 24 hours to digest the information before the stock market reopened on 16 August. The Dow Jones Industrial Average (DJIA) enjoyed its largest advance ever, with a gain of 31 points. Sophisticated Wall Street investors were fully aware that closing the gold window allowed the Federal Reserve to print unlimited sums of money. Of course, nobody in 1971 could have possibly imagined that the Fed would embark on a $6 trillion money printing program over the course of the next five decades.
Since Nixon closed the gold window in 1971, many investors have been predicting the collapse of the US Dollar, extreme levels of inflation and sky high interest rates in response to unlimited money creation and the elimination of gold convertibility. So far, these dire forecasts have been 100% wrong. In fact, just the opposite has occurred. During the past 40+ years, the United States has enjoyed a stable currency, very low rate of inflation and record low interest rates. The “doom and gloom” crowd has been completely wrong in regard to Wall Street’s reaction to the closing of the gold window. In fact, based on the level of today’s interest rates, there’s no reason to expect the “doom and gloom” forecast to bear any fruit at least for the next few years.
The iShares family of exchange traded funds (managed by BlackRock) introduced the Core US Aggregate Bond ETF, with the objective of providing investors with broad exposure to US investment-grade bonds. The ETF was launched on 22 September 2003, using the ticker symbol AGG. The ETF has 7,656 different holdings of debt instruments. By far, the largest holdings consist of US Treasury securities with various levels of maturity. The percentage of Treasury securities is 41.4%.
SHORT-TERM VIEW
Generally speaking, bond ETFs generate a fairly low level of volatility. However, in response to COVID-19, the entire ETF universe has experienced a dramatic spike in volatility. This includes AGG. After generating a nasty decline during the first two weeks of March, AGG has enjoyed a substantial rally. The bulls are in complete control of the short-term momentum. The next level of resistance is 117.68. In order to reclaim the momentum, the bears need a weekly close below 111.08. At least for now, the path of least resistance is to the upside.
LONG-TERM VIEW
Over the course of the past 50 years, there have been an endless stream of research reports, term papers, theses, dissertations and essays explaining why Nixon’s closing of the gold window would create global hyperinflation along with a collapse of the currency markets. As we briefly discussed earlier, these catastrophic predictions never materialized. There was a brief period of inflationary pressures in the late-1970s and early-1980s. However, it had absolutely no connection to Nixon’s decision to exit the Bretton Woods Agreement. Instead, the inflation spike from 1979 thru 1981 was nothing more than a bout of cost-push inflation as a result of poor policy decisions made by the Carter administration. Thanks to aggressive actions taken by Federal Reserve chairman Paul Volcker, the inflation disappeared in 1982. So far, it has never returned. Please review the following table.
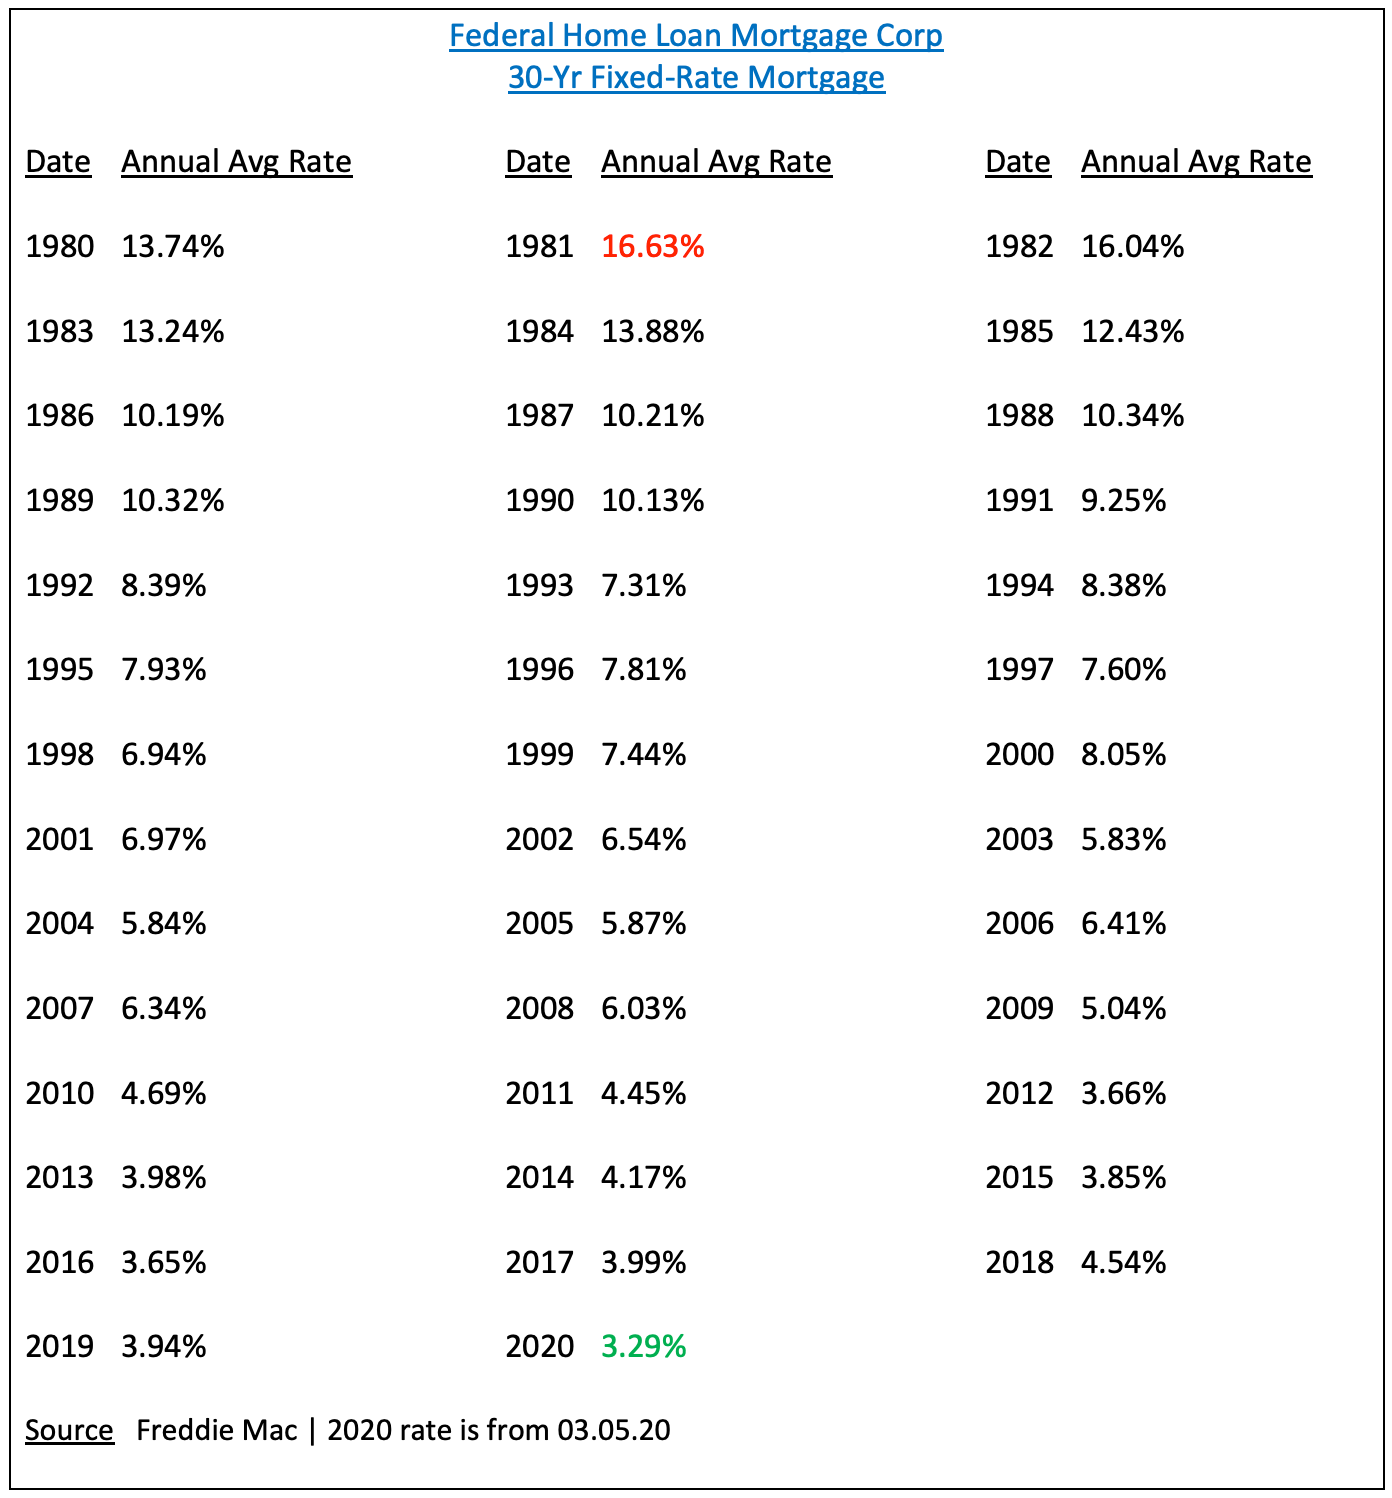
The table displays the average annual interest rate for a 30-year mortgage from 1981 through 2020. As the table clearly indicates, interest rates have been steadily declining for the past 40 years. In fact, mortgage rates fell to their lowest level ever on 5 March @ 3.29%. Freddie Mac began recording 30-year mortgage rates on a monthly basis in March 1971. The rate of 3.29% on 5 March was the lowest level on record. Essentially, interest rates have been continuously falling for 40 years. Nixon’s closing of the gold window in 1971 had the exact opposite effect on interest rates, inflation and collapse of the US Dollar. Why didn’t the domestic economy experience hyperinflation after the US exited the Bretton Woods Agreement? Please review the following table.
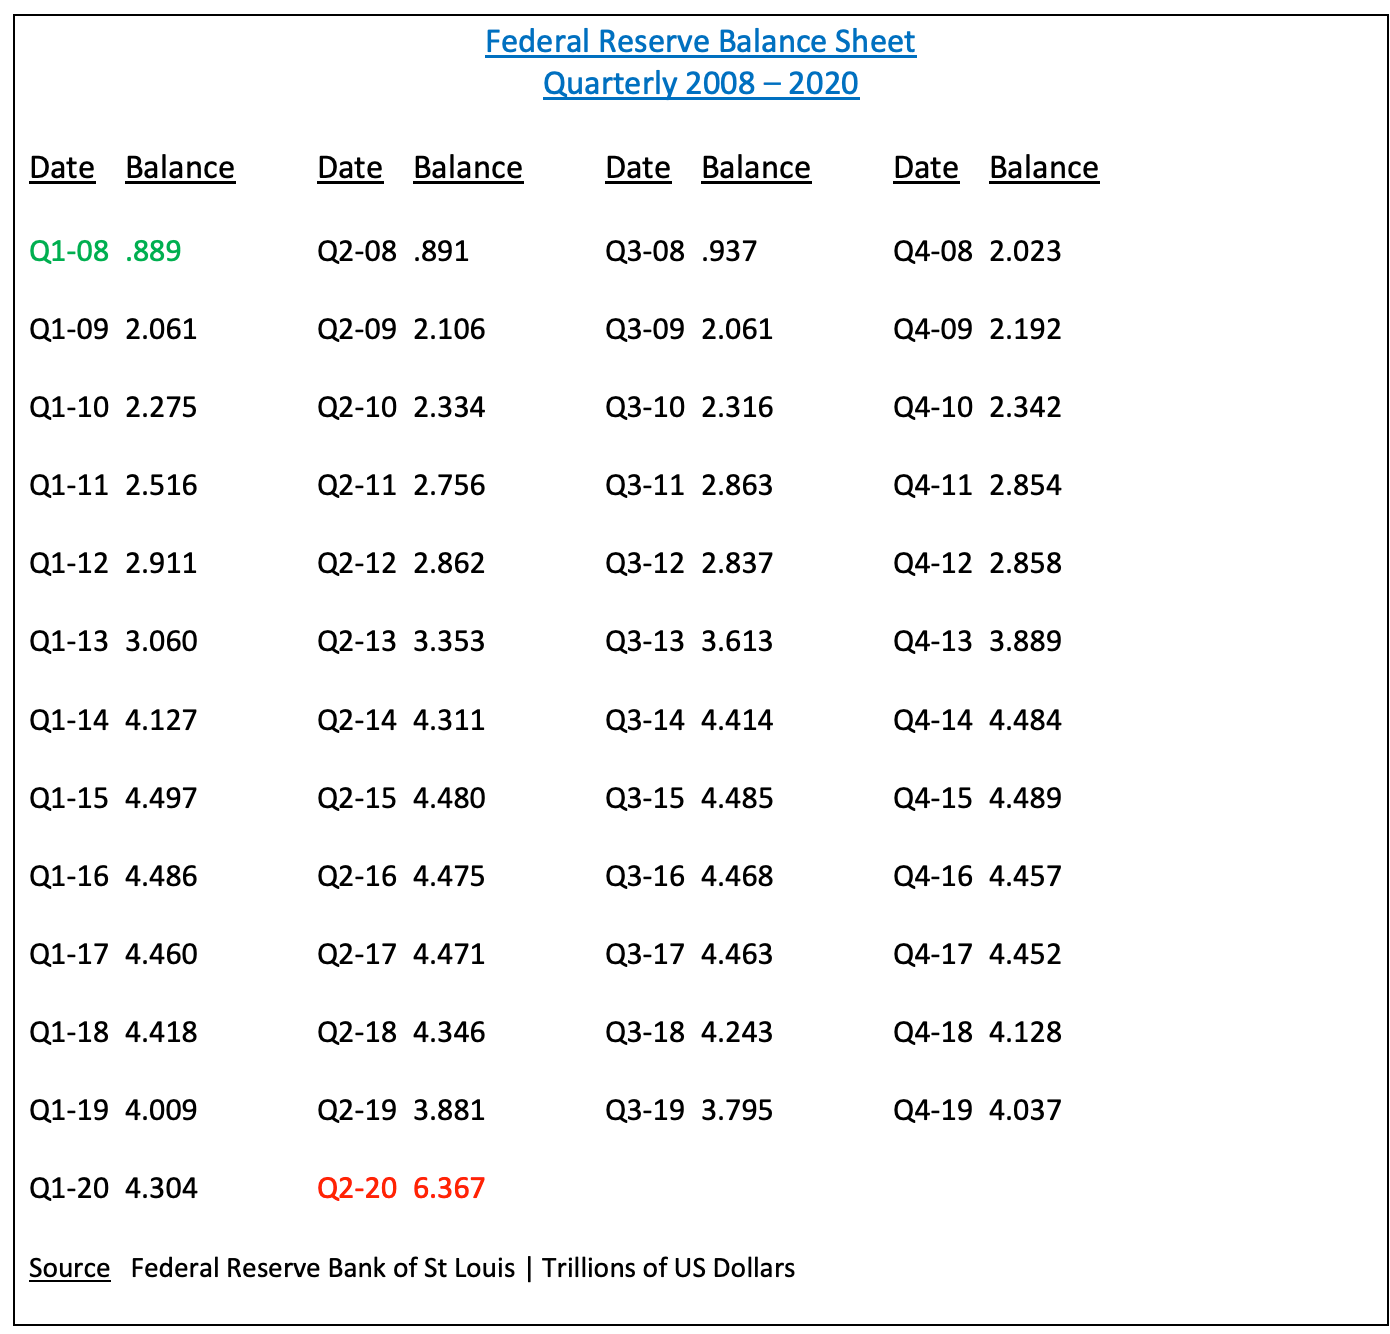
This table displays the Fed balance sheet beginning in 2008. As you can see, the balance sheet exploded following the global financial crisis. It exploded again in March in response to the coronavirus. However, economists and investors have learned over the course of the past decade that a large Fed balance sheet does not necessarily create hyperinflation. Why? Because the banks (who were the recipients of Fed money creation) never made an effort to place these Dollars into the hands of businesses and individuals. Instead, the money simply remained on bank balance sheets earning a risk-free rate of return. The banks had no incentive to lend these currency units to small businesses, large corporations or individual consumers. Until the banks become aggressive lenders, the risk of massive inflation is minimal.
In regard to the long-term momentum, the bulls are in control of AGG despite the recent volatility. In fact, AGG recorded a new all-time high on 9 March @ 119.27. The most likely scenario is a continuation of higher prices as the global economy attempts to recover from COVID-19.
SHORT-TERM CHART
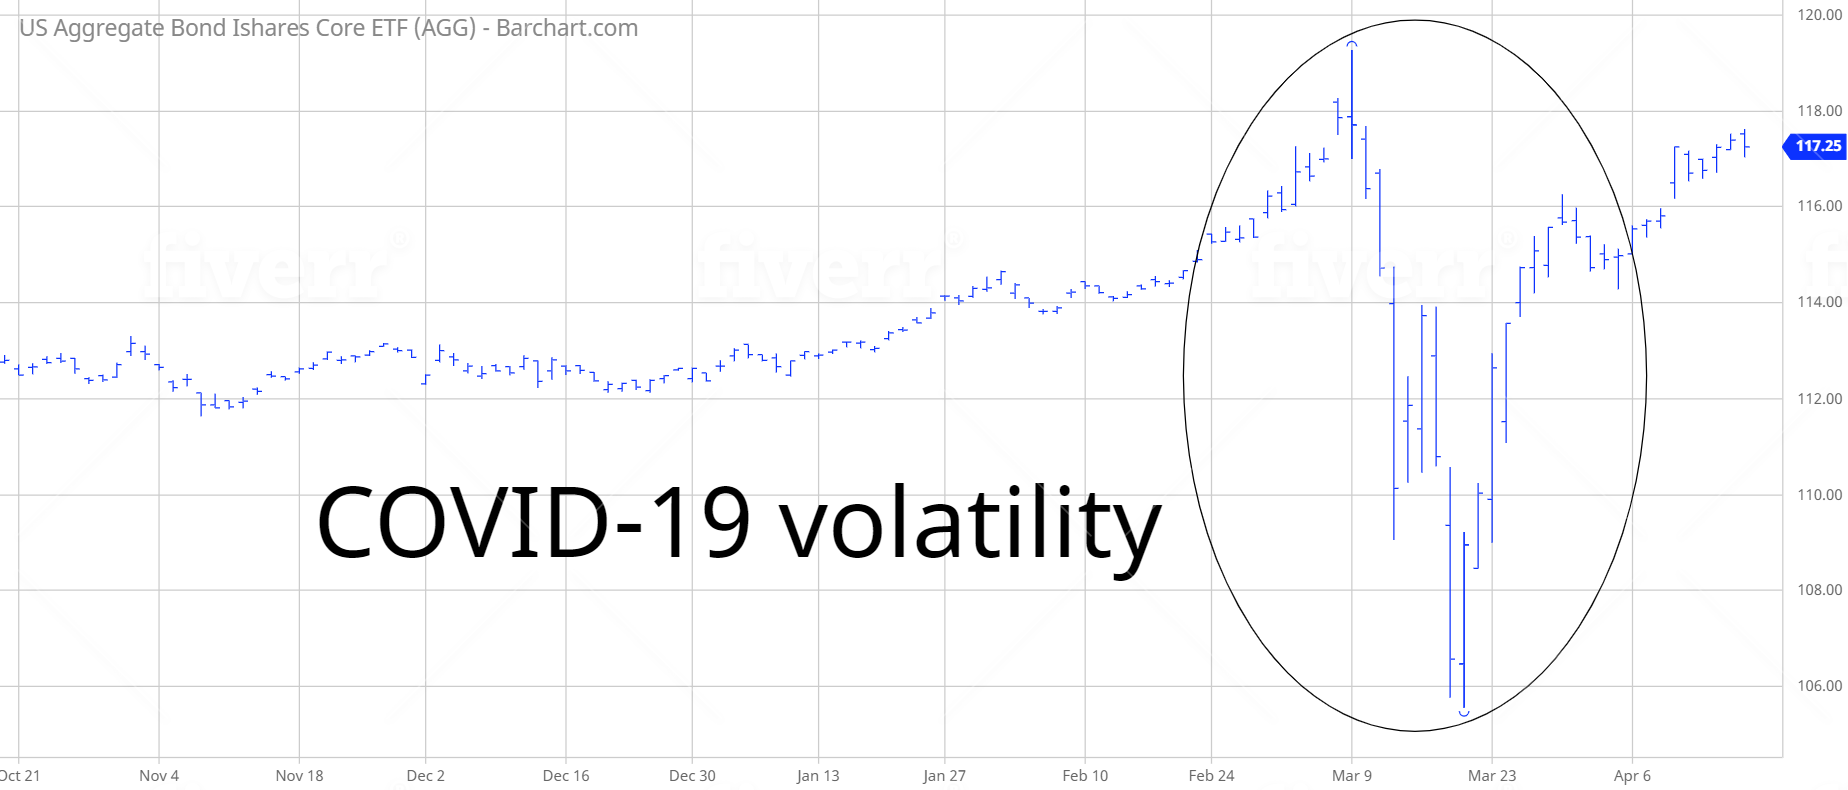
Please review the 6-month chart of AGG. You will notice the extreme volatility. Over the course of nine trading days, AGG generated a 6-month high and 6-month low. Of course, this volatility can be attributed to COVID-19. For now, the short-term chart pattern is bullish. The bears need a weekly close below 111.08 in order to reverse the trend.
LONG-TERM CHART
Please review the 15-year chart of AGG. The long-term chart pattern remains bullish. It would take a weekly close below 97.88 to push the momentum in favor of the bears. This type of decline is certainly possible, but not likely.