SPDR S&P 500 ETF (SPY)
Key Statistics – SPY
Minor Support Level 239.75 Minor Resistance Level 308.47
Thank you for reading this post, don't forget to subscribe!Major Support Level 107.43 Major Resistance Level 347.65
Minor Buy Signal 313.84 Minor Sell Signal 233.80
Major Buy Signal 355.97 Major Sell Signal 99.57
BRIEF OVERVIEW – SPY
Approximately two months ago, the greatest bull market in the history of Wall Street was finally defeated. This spectacular bull market began on 9 March 2009. The climax was achieved on 12 February 2020. From peak-to-climax, the bull market lasted 3,991 days. In terms of the “20% correction rule,” the bull market officially ended on 11 March 2020. It could easily take 100 years before Wall Street experiences another bull market of this magnitude.
Going forward, the most important question is, “How long will the bear market continue?” Of course, it’s impossible to answer this question with any degree of accuracy. However, we can take an educated guess based on technical analysis and chart patterns.
Arguably, the most reliable technical indicator was created by a twelfth century Italian mathematician by the name of Leonardo Fibonacci. The vast majority of mathematical historians consider Fibonacci to be the greatest mathematician of the Middle Ages. In fact, many experts in the field of mathematics claim that Fibonacci was one of the ten greatest mathematicians of all-time.
Without question, Fibonacci’s greatest contribution to the field of mathematics was his creation of the Hindu-Arabic numeral system. Fibonacci used this numeral system to dramatically simplify commercial bookkeeping, converting weights and measures, calculating interest payments and the exchange of money between merchants. Although his creation of the Hindu-Arabic numeral system was his crowning achievement within the field of mathematics, Fibonacci will always be most famously known for the Fibonacci numbers.
What are Fibonacci numbers? They are a sequence of numbers developed by Fibonacci in circa 1202. Fibonacci numbers are used in the study of nature, music, agriculture, computer applications, price forecasting and several other fields of study. Stock and commodity traders use “Fib” numbers to calculate support and resistance levels.
The most common Fib levels are:
- .236
- .382
- .500
- .618
- 1.000
- 1.236
- 1.382
- 1.500
- 1.618
- 2.000
- 2.236
- 2.382
- 2.500
- 2.618
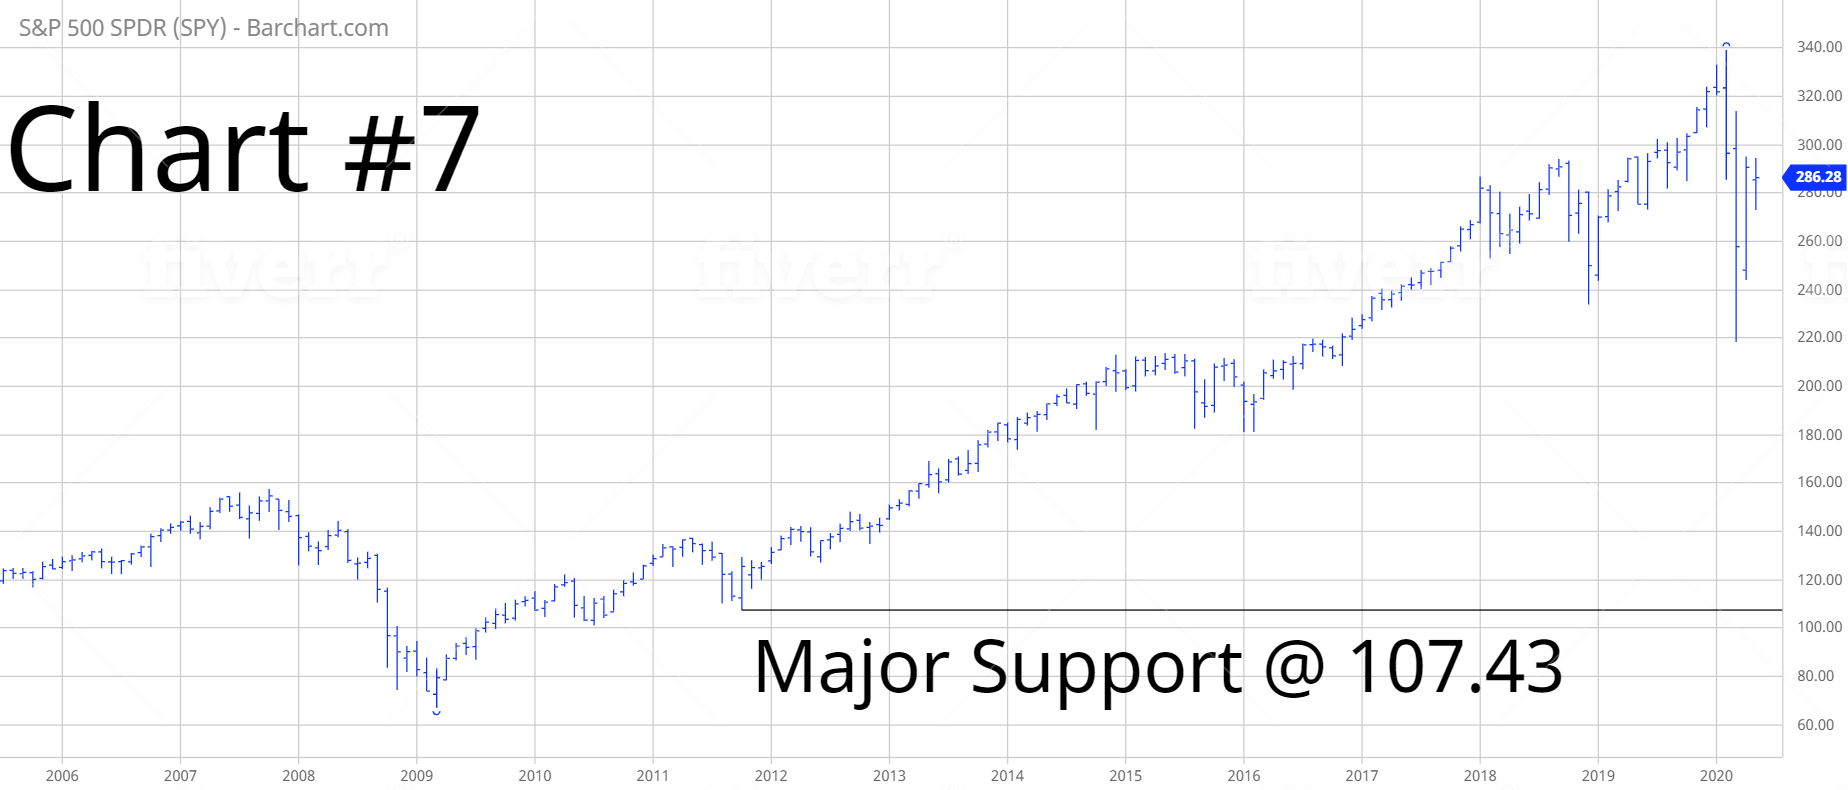
In an effort to determine the direction of the stock market, let’s use the Fib numbers to calculate resistance levels. The first step is to calculate the value of the recent trading range (Chart #1). The range is 1,202 points. Please review the following table.
| Range | Fib Ratio | Resistance Level |
| 1202 | .236 | 2474 |
| 1202 | .382 | 2650 |
| 1202 | .500 | 2792 |
| 1202 | .618 | 2933 |
| 1202 | 1.000 | 3393 |
| 1202 | 1.236 | 3676 |
| 1202 | 1.382 | 3852 |
| 1202 | 1.500 | 3994 |
| 1202 | 1.618 | 4135 |
| 1202 | 2.000 | 4595 |
| 1202 | 2.236 | 4878 |
| 1202 | 2.382 | 5054 |
| 1202 | 2.500 | 5196 |
| 1202 | 2.618 | 5337 |
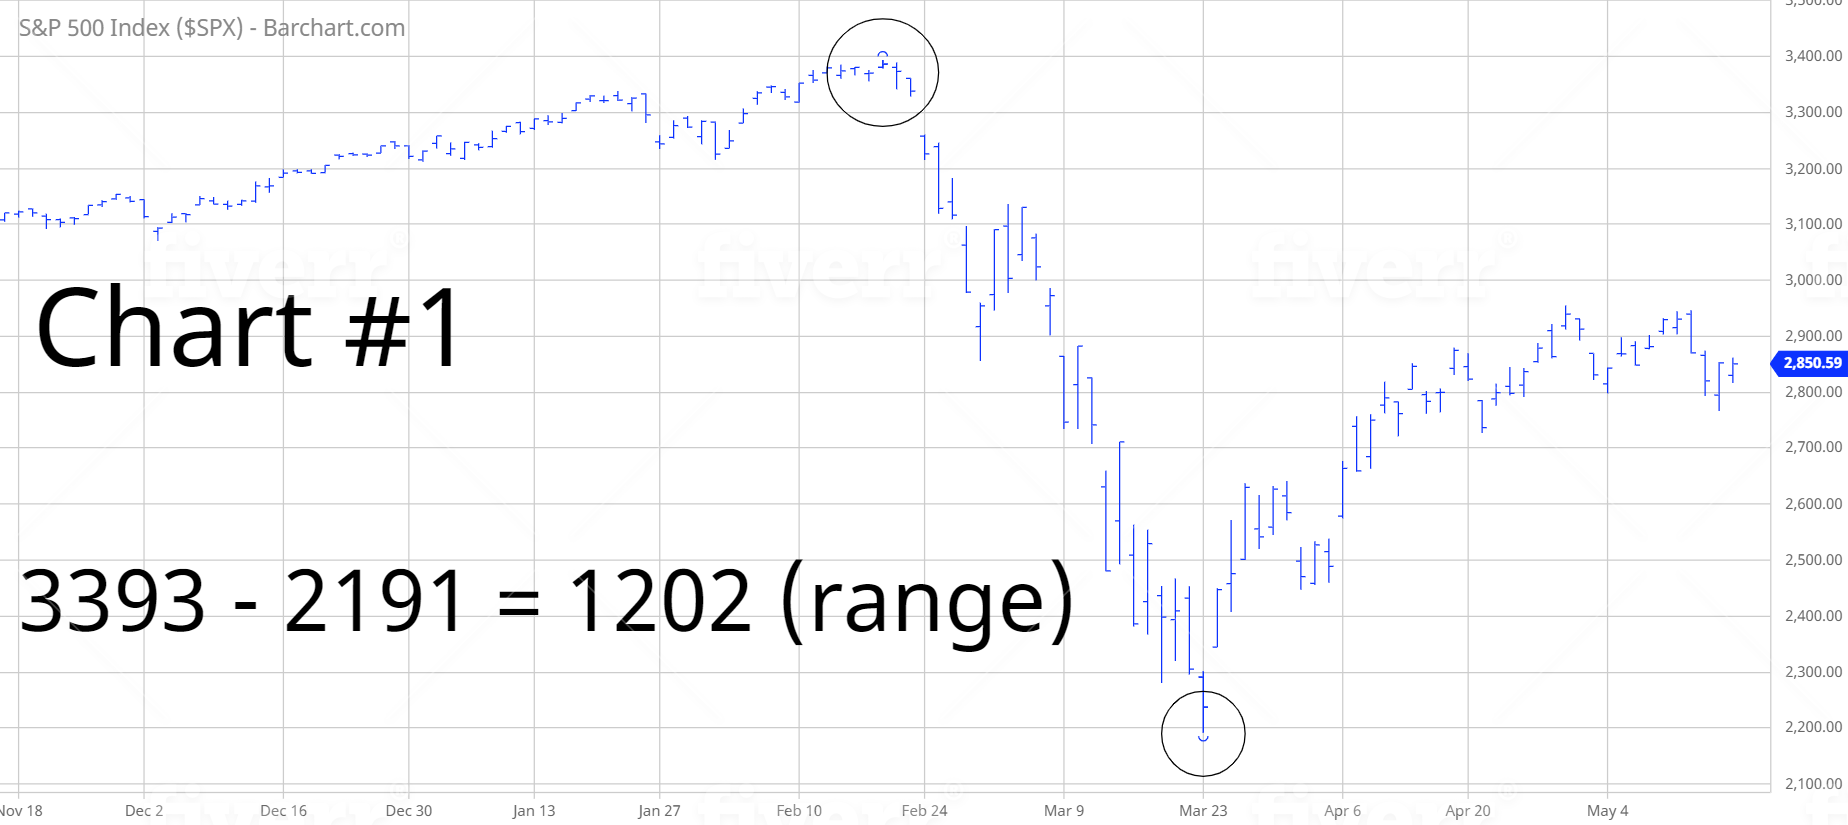
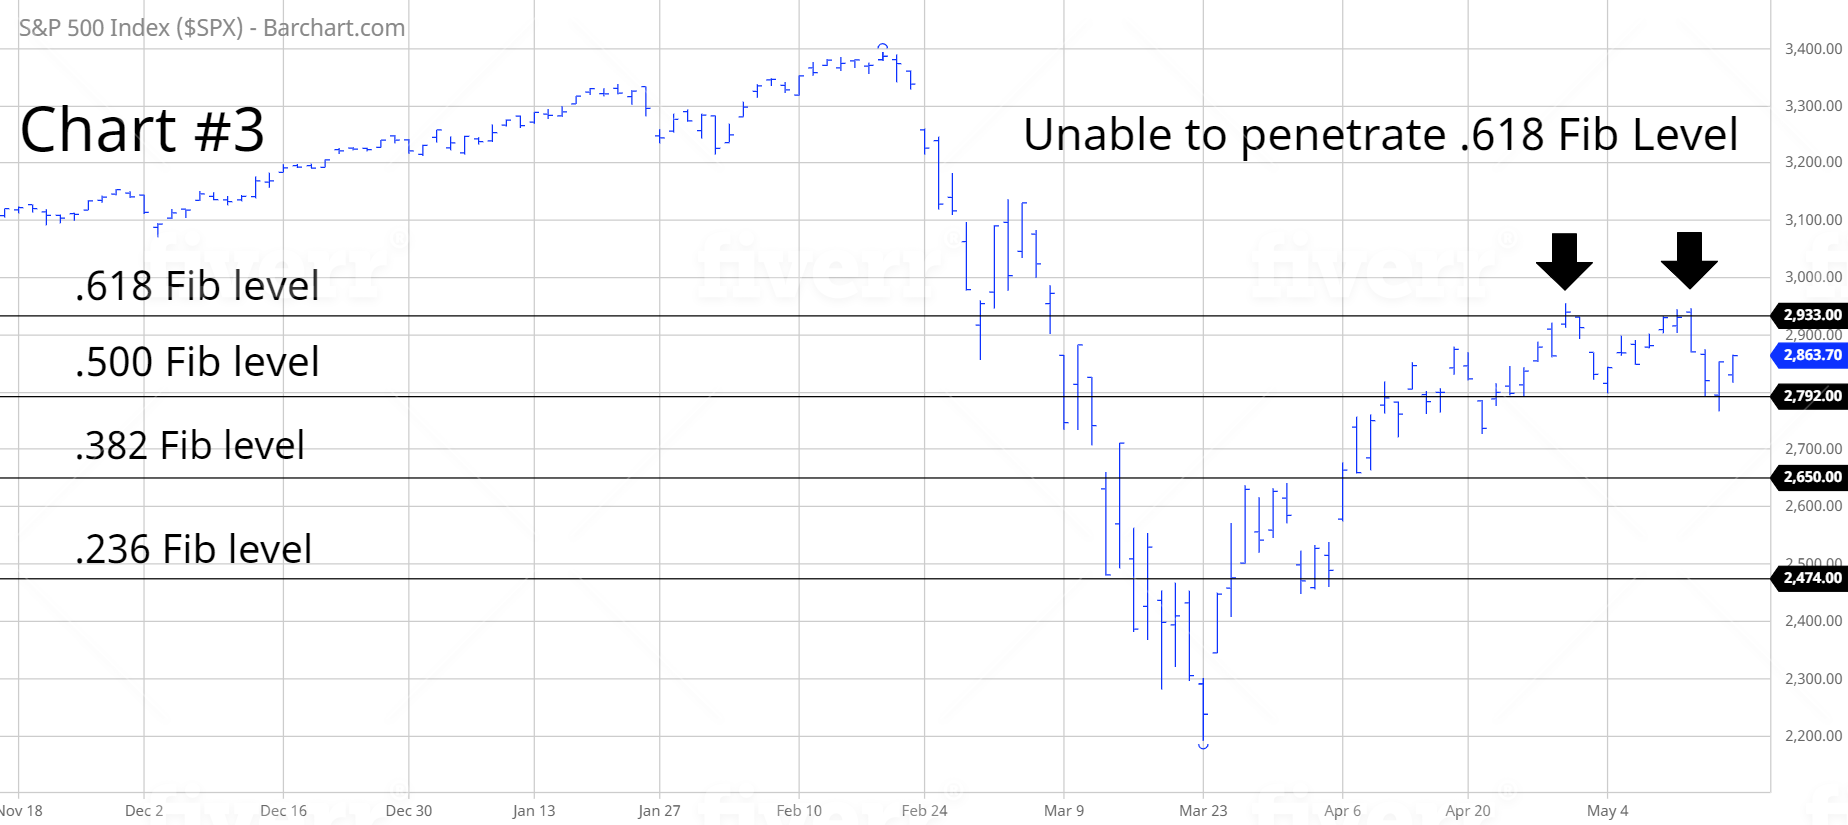
The S&P 500 (SPX) recorded an all-time high on 19 February @ 3393. Over the course of the next four weeks, the stock market suffered a brutal decline. The S&P lost 35.4% of its value, generating an important low on 23 March @ 2191. During the past six weeks, the stock market has enjoyed a substantial recovery. The S&P 500 has advanced 34.8% from its 23 March low (Chart #2). The recovery high occurred on 29 April @ 2954. As you can see from the table, the rally ran out of momentum near the .618 Fibonacci ratio @ 2933 (Chart #3). The S&P has failed to penetrate the .618 Fib level on two separate occasions. This is not a good sign for the stock market bulls. However, if the bulls can successfully push SPX above 2933 on a weekly closing basis, the market could easily move much higher very quickly. The next Fib level does not occur until 3393. This explains why 2933 is such a critical number. At least for now, it appears that the bears will be successful in keeping SPX below 2933.
In an effort to provide investors with exposure to the S&P 500, the SPDR family of exchange- traded funds introduced the S&P 500 ETF on 22 January 1993. The ticker symbol is SPY. The ETF allows investors to participate in the S&P 500 without the burden of owning shares of each company within the index. SPY is historically significant because it was the very first exchange- traded fund listed in the United States. SPY is easily the most heavily traded ETF, with daily volume usually exceeding 100 million shares.
SHORT-TERM VIEW – SPY
Despite the recent advance, the bears are in control of the short-term momentum. The next level of support is 239.75. In order to recapture the momentum, the bulls need a weekly close above 308.47. The most likely scenario is a trading range with a slight bias to the downside.
LONG-TERM VIEW – SPY
The Standard & Poor’s Index consists of 500 large cap stocks divided into 11 different sectors. Many investors meticulously study each sector in an effort to determine the future direction of the S&P index. Based on historical studies, energy, financials and materials have a tendency to outperform all other sectors during a bull market. Therefore, if the S&P 500 is in a true bull market, these three sectors need to be leading the way higher. As you can see from the table, energy, financials and materials have generated poor results during the past 12 months, particularly the energy sector. This is not a good sign for the stock market bulls.
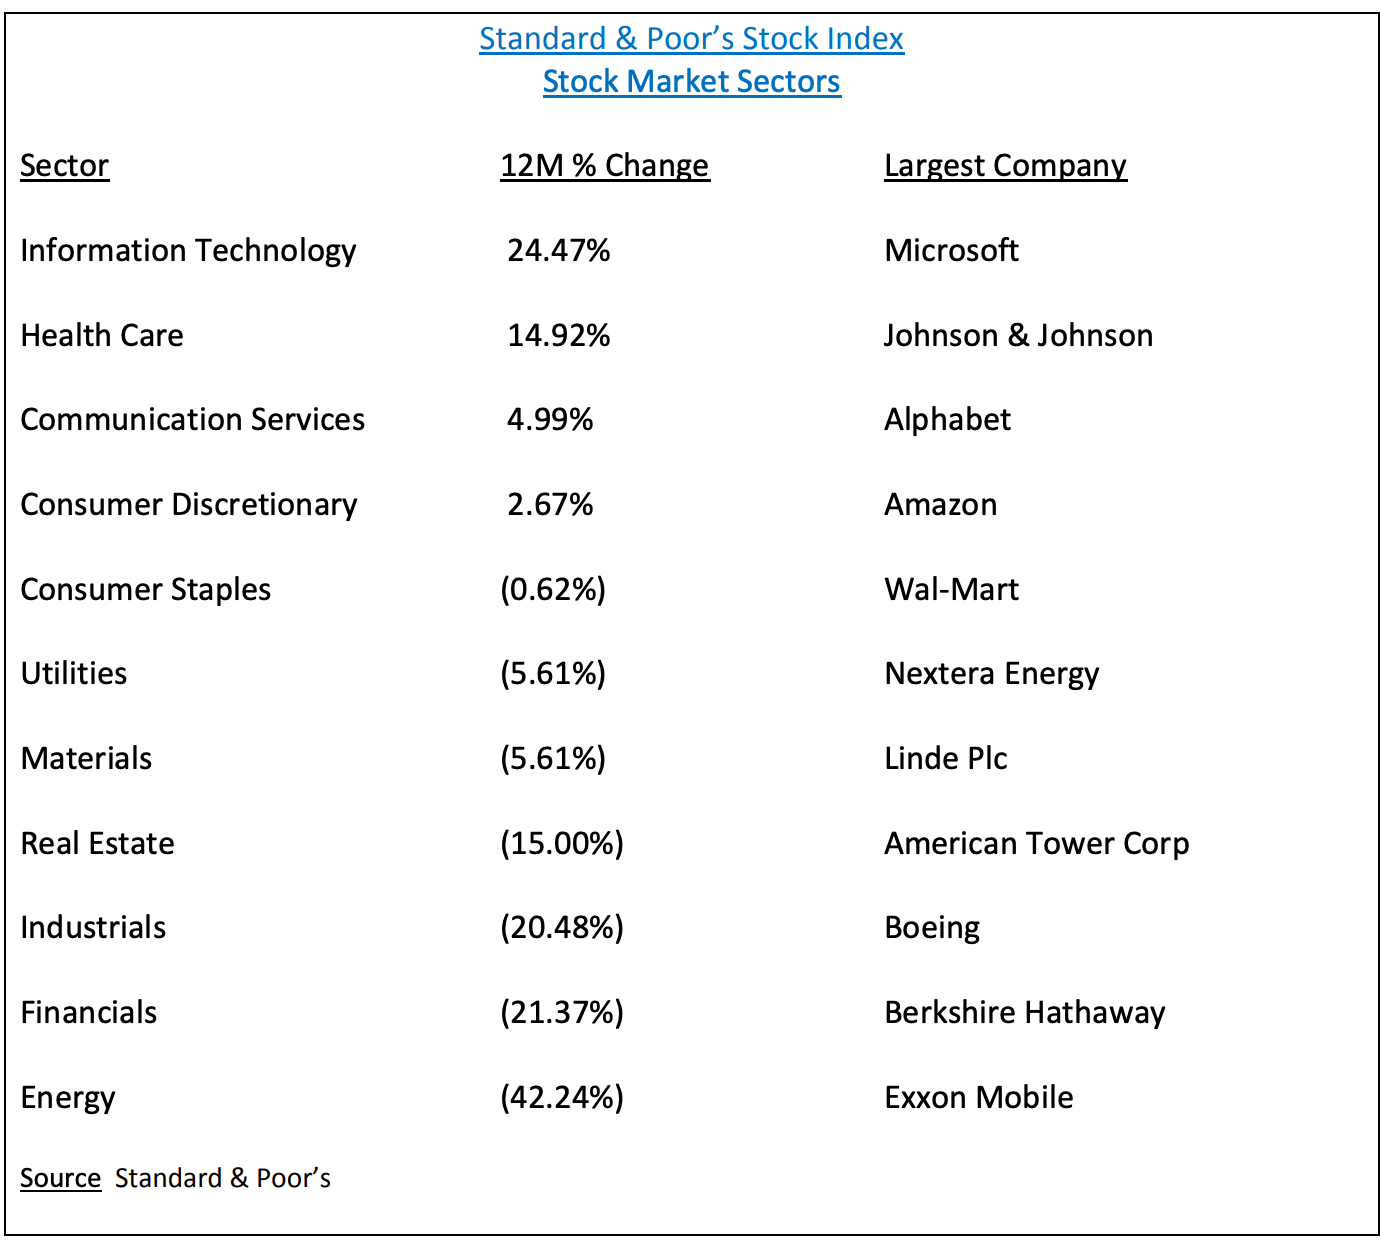
Based on the data from the table, it’s easy to see that investors have rotated out of the speculative sectors and into more defensive sectors. This is a clear indication that investors are preparing for another leg down in the stock market.
Without question, the most disturbing sector in the table is the financials. Typically, financial stocks perform exceptionally well during periods of low interest rates. Currently, interest rates are near their lowest level in recorded history. Why are financial stocks performing so poorly? Why are investors avoiding the bank stocks? Most likely, investors are fearful that COVID-19 will continue wreak havoc on the global economy, thus creating a slew of new charge-offs and bankruptcies.
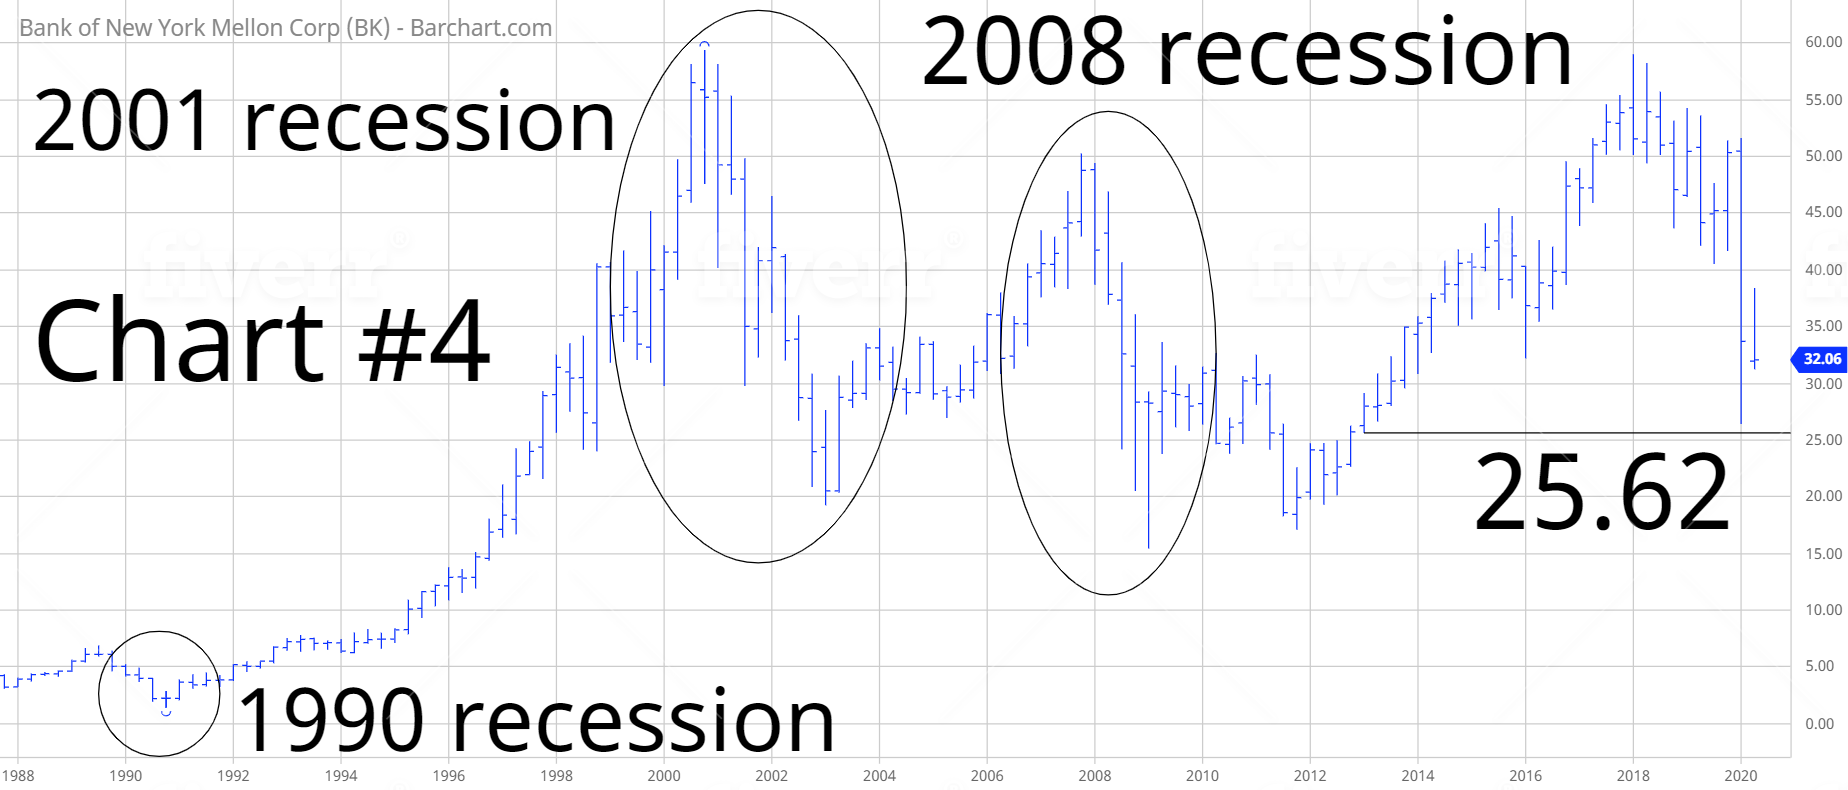
If we are truly on the verge of a multi-year recession, bank stocks will perform poorly. Historically, financial companies have always struggled during periods of economic weakness. Bank of New York is a perfect example (Chart #4). As you can see from the chart, the stock has performed poorly during the past three economic contractions. The most disturbing part of this chart is the recent price action. BK is on the verge of falling below the critical support level @ 25.62. A weekly close below 25.62 opens the door to sharply lower prices. Bank of New York is not the only stock on the verge of penetrating important support levels. Several large banks and financial services firms are within striking distance of violating important support levels. This is not a good sign for the overall stock market.
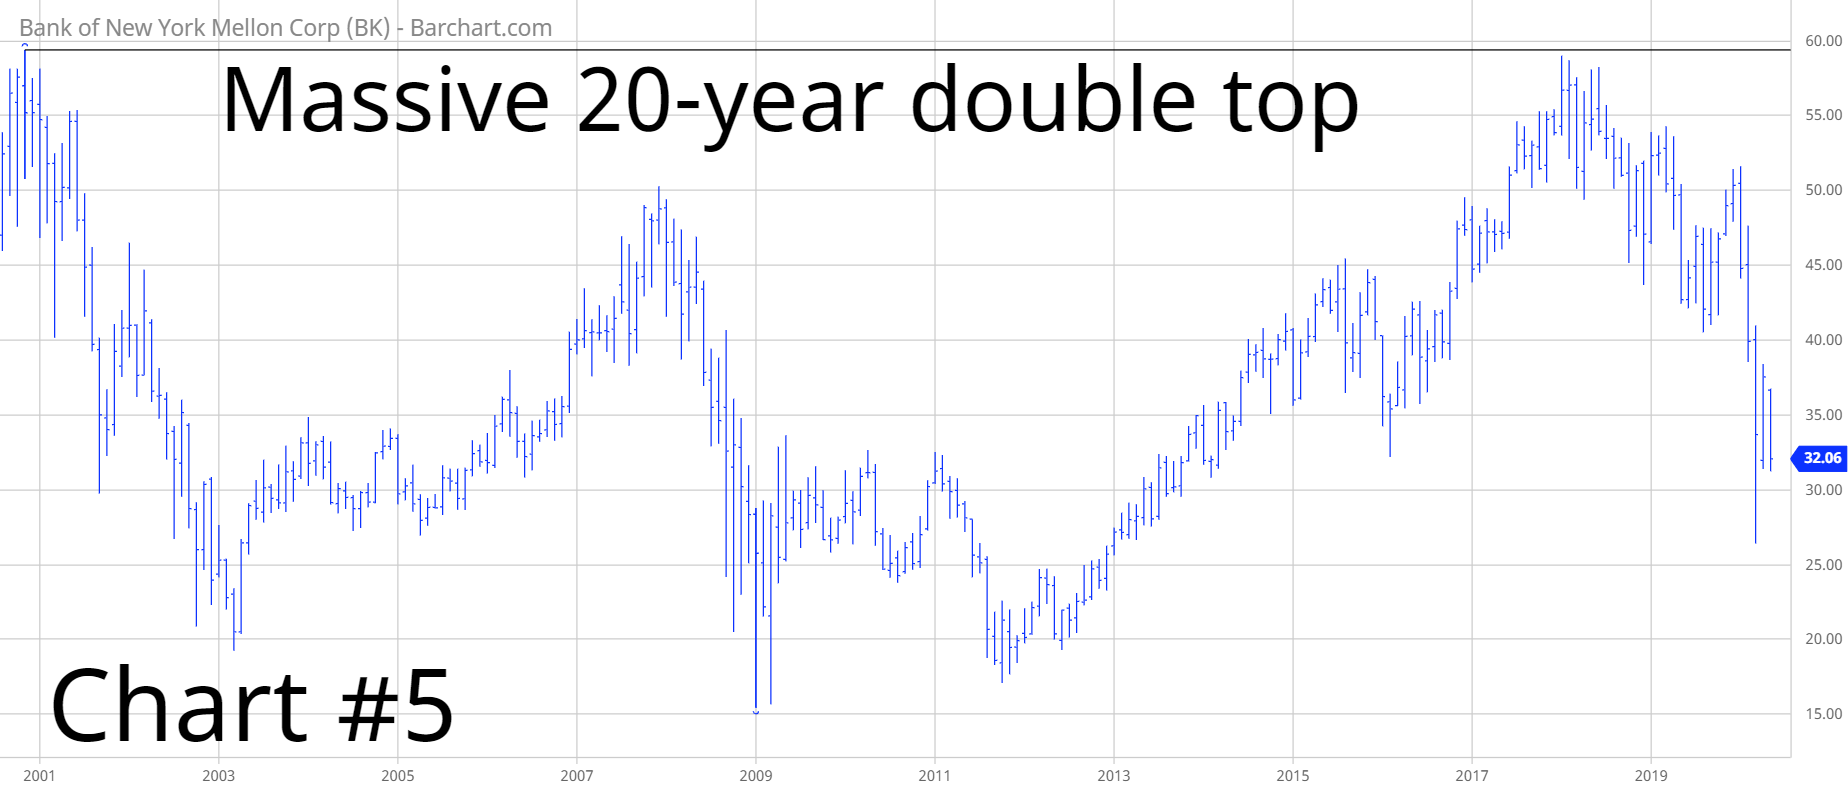
By the way, Bank of New York was selected as a proxy for the entire financial sector because BK is the oldest continuously operating bank in the United States. The bank was founded by Alexander Hamilton and Andrew Burr in 1784. Bank of New York has a history of being one of the most conservative banks in the country. If BK is struggling to remain profitable in this environment, this is probably a good indication that all banks are struggling. Please review Chart #5. In February, BK was unable to penetrate its high from the days of the internet mania in late-2000. This is a very ominous sign.
In regard to SPY, the long-term momentum is still bullish despite the sharp decline during the past few months. In order to reverse the momentum, the bears need a weekly close below 107.43. At least for now, it appears highly unlikely that SPY will lose its long-term momentum to the bears.
SHORT-TERM CHART – SPY
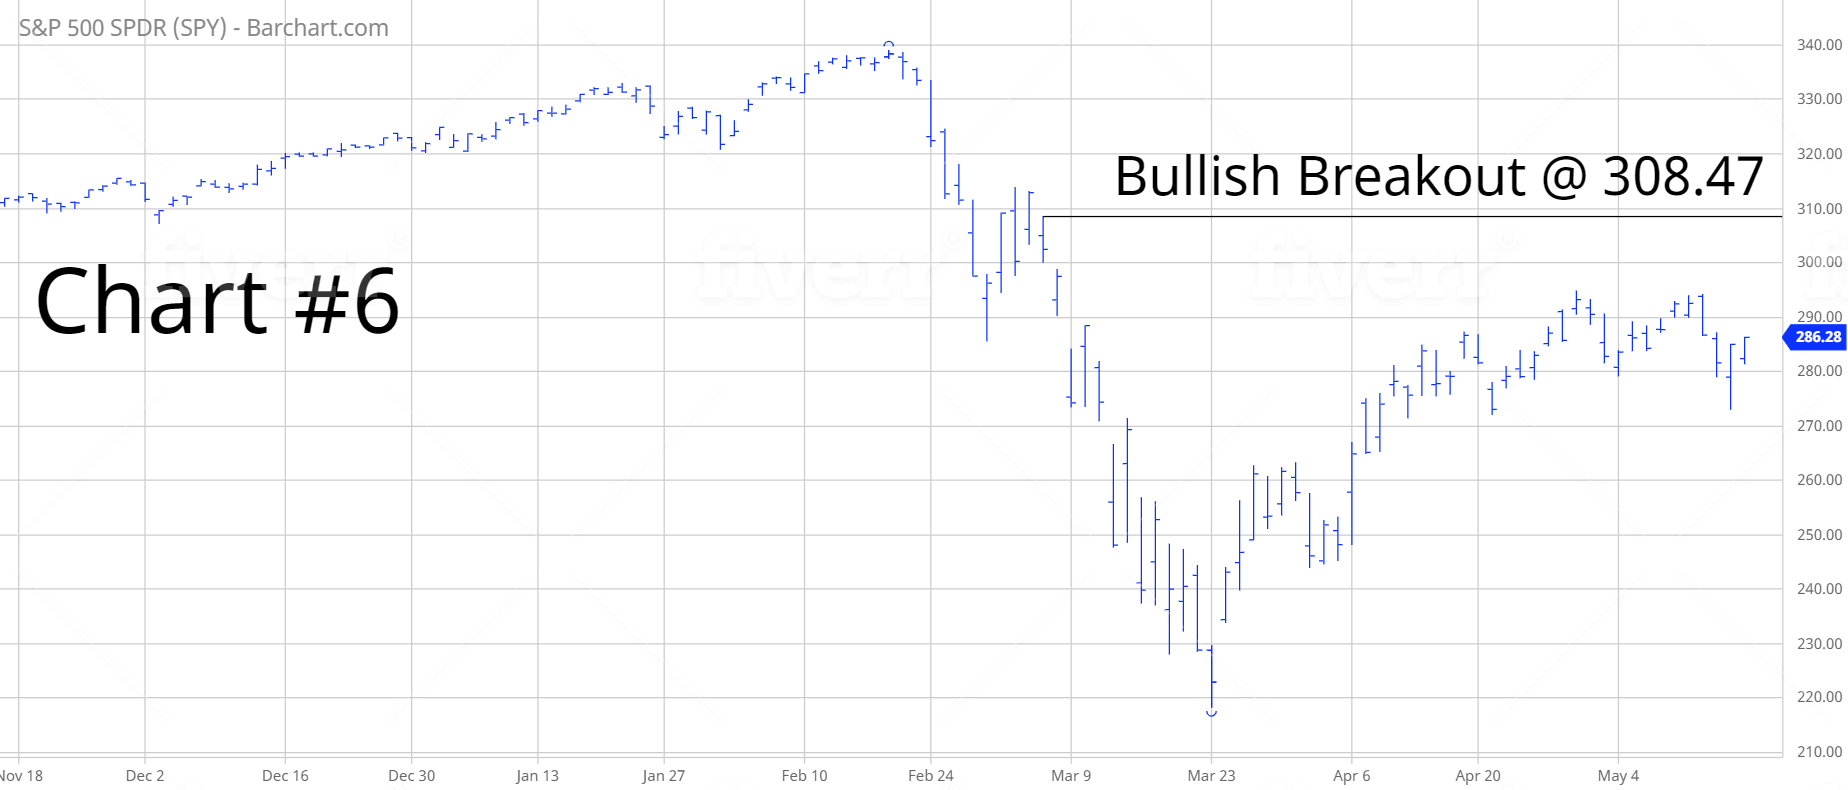
Please review the 6-month chart of SPY (Chart #6). Despite the recent advance, the bears are in control of the short-term trend. The chart pattern remains bearish. The next level of support is 239.75. In order to flip the chart pattern in favor of the bulls, SPY must produce a weekly close above 308.47. Many Wall Street analysts are forecasting another sharp leg to the downside. This scenario is certainly possible. However, the most likely outcome is a trading range with a slight bias to the downside.
LONG-TERM CHART – SPY
Please review the 15-year chart of SPY (Chart #7). The long-term chart has been continuously bullish since 2009. Even though the stock market entered bear market territory on 11 March, the SPY chart pattern still remains bullish. A weekly close below 107.43 is needed to reverse the trend in favor of the bears.