SPDR Dow Jones Industrial Average ETF (DIA)
Key Statistics
Minor Support Level 181.05 Minor Resistance Level 233.60
Thank you for reading this post, don't forget to subscribe!Major Support Level 112.14 Major Resistance Level 289.00
Minor Buy Signal 237.17 Minor Sell Signal 176.96
Major Buy Signal 295.87 Major Sell Signal 101.33
BRIEF OVERVIEW – Dow Jones ETF – DIA
It’s officially over! The greatest bull market in the history of Wall Street has finally been defeated. This spectacular bull market began on 9 March 2009. The climax was achieved on 12 February. From peak-to-climax, the bull market lasted 3991 days. In terms of the “20% correction rule,” the bull market officially ended on 11 March. It could easily take 100 years before Wall Street experiences another bull market of this magnitude.
The bull market was thwarted by the most unlikeliest of culprits. For the past several years, investors have been pondering and prognosticating about how the world’s greatest equity bull market would finally succumb to defeat. Of course, most stock market experts agreed that the bull market would unravel due to some type of economic event. At the end of the day, the bull market was defeated by a global viral infection. Nobody saw it coming. Very often, this is precisely how these multi-year bull markets end. Markets are designed to frustrate as many people as possible. The recent outbreak of the coronavirus definitely frustrated the overwhelming majority of the investment community.
Obviously, the most important questions going forward are, “How long will the bear market continue and how far will equity prices decline?” Before we attempt to answer these questions, let’s enjoy one final glimpse of this historic bull market. Please review the following table.
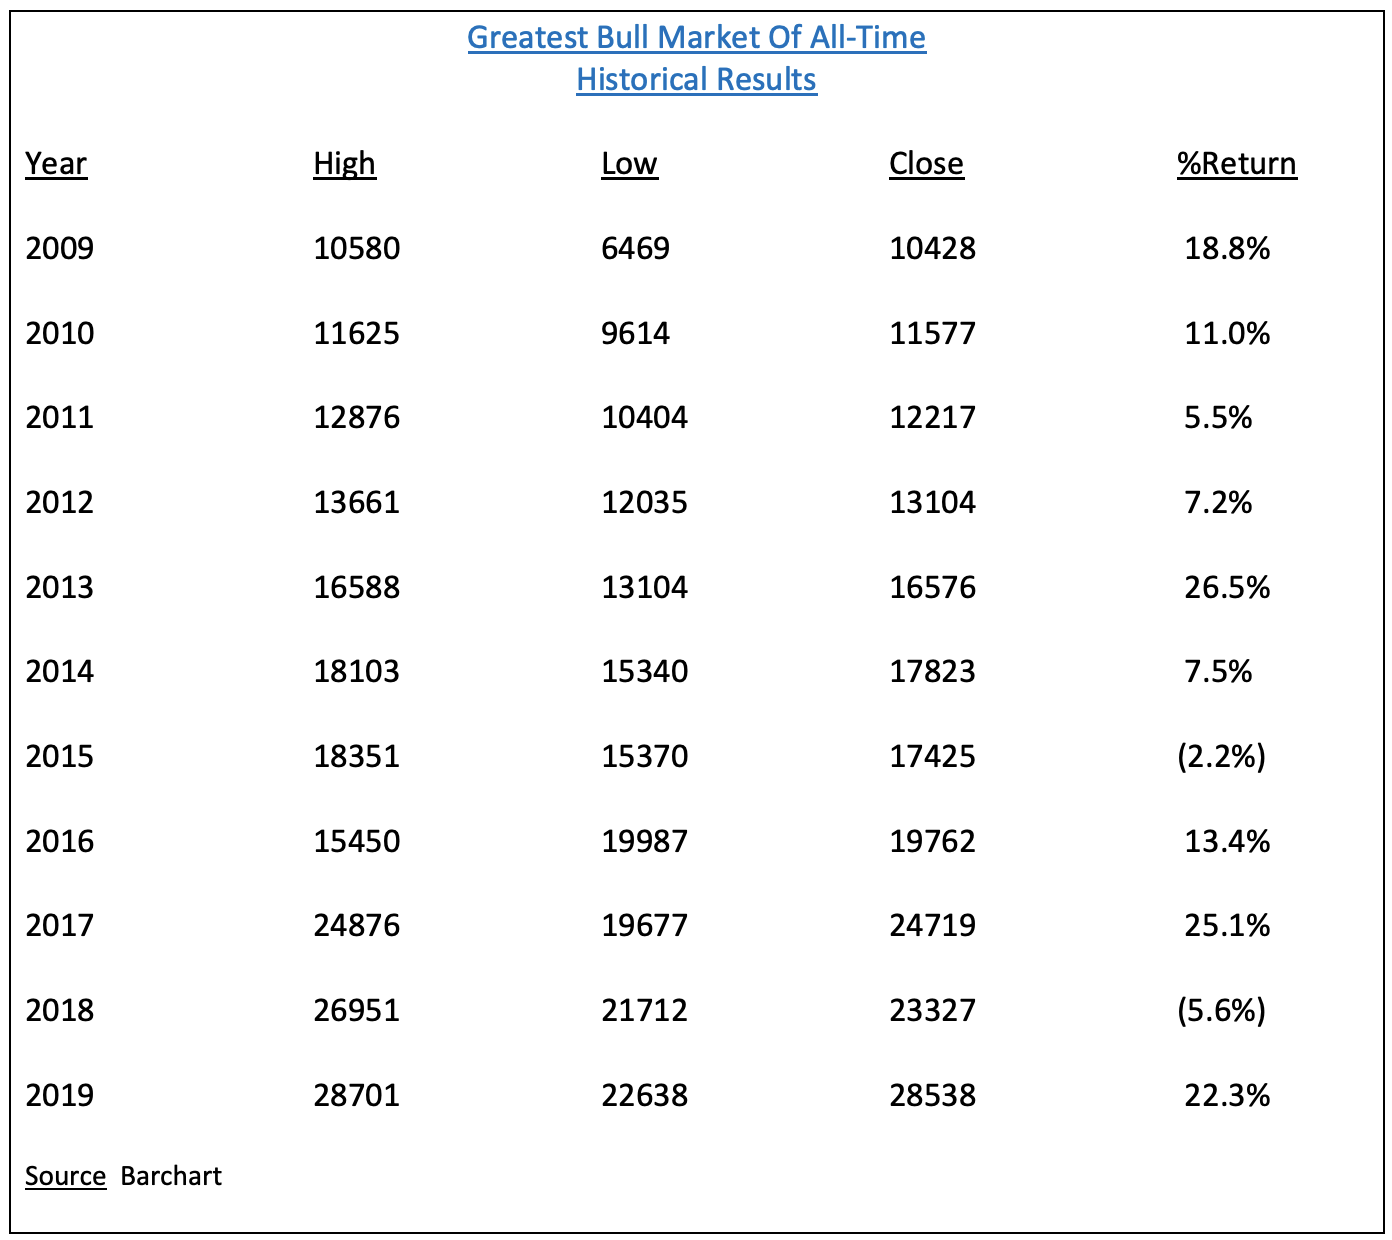
As you can see, DJIA generated a spectacular performance over the course of 11 years. The index suffered only two small losing years during its historic advance. The average annual rate of return was 11.8%.
The SPDR family of exchange traded funds (underwritten by State Street Global Advisors) introduced the Dow Jones Industrial Average ETF on 14 January 1998. The ticker symbol is DIA. This ETF is a perfect vehicle for investors who wish to participate in the performance of DJIA. DIA is an extremely popular ETF, with an average daily volume of nearly six million shares. The ETF is commonly referred to as “Diamonds.”
SHORT-TERM VIEW – Dow Jones ETF – DIA
For the first time in several months, the bears are in complete control of the short-term momentum. The next level of support is 181.05. The recent decline has been absolutely brutal. Therefore, the bulls will have a very difficult time recapturing the momentum. The important number for the bulls is a weekly close above 233.60 (highly unlikely).
Based on the Aroon Oscillator, DIA has an extremely oversold reading of -88. The Aroon Oscillator is programmed differently than most stochastic indicators. The oscillator fluctuates between -100 and +100. A reading of 0 would indicate a neutral position. Therefore, a reading of -88 with DIA is considered aggressively oversold. However, speculative markets can remain oversold for extended periods of time. Even though the oscillator reading is -88, DIA could easily continue to drift lower.
LONG-TERM VIEW – Dow Jones ETF – DIA
Let’s return to the questions that we posed a few minutes ago. “How long will the bear market continue and how far will equity prices decline?” These are the most important questions that Wall Street money managers are struggling to answer as the global economy remains locked down as a result of the coronavirus.
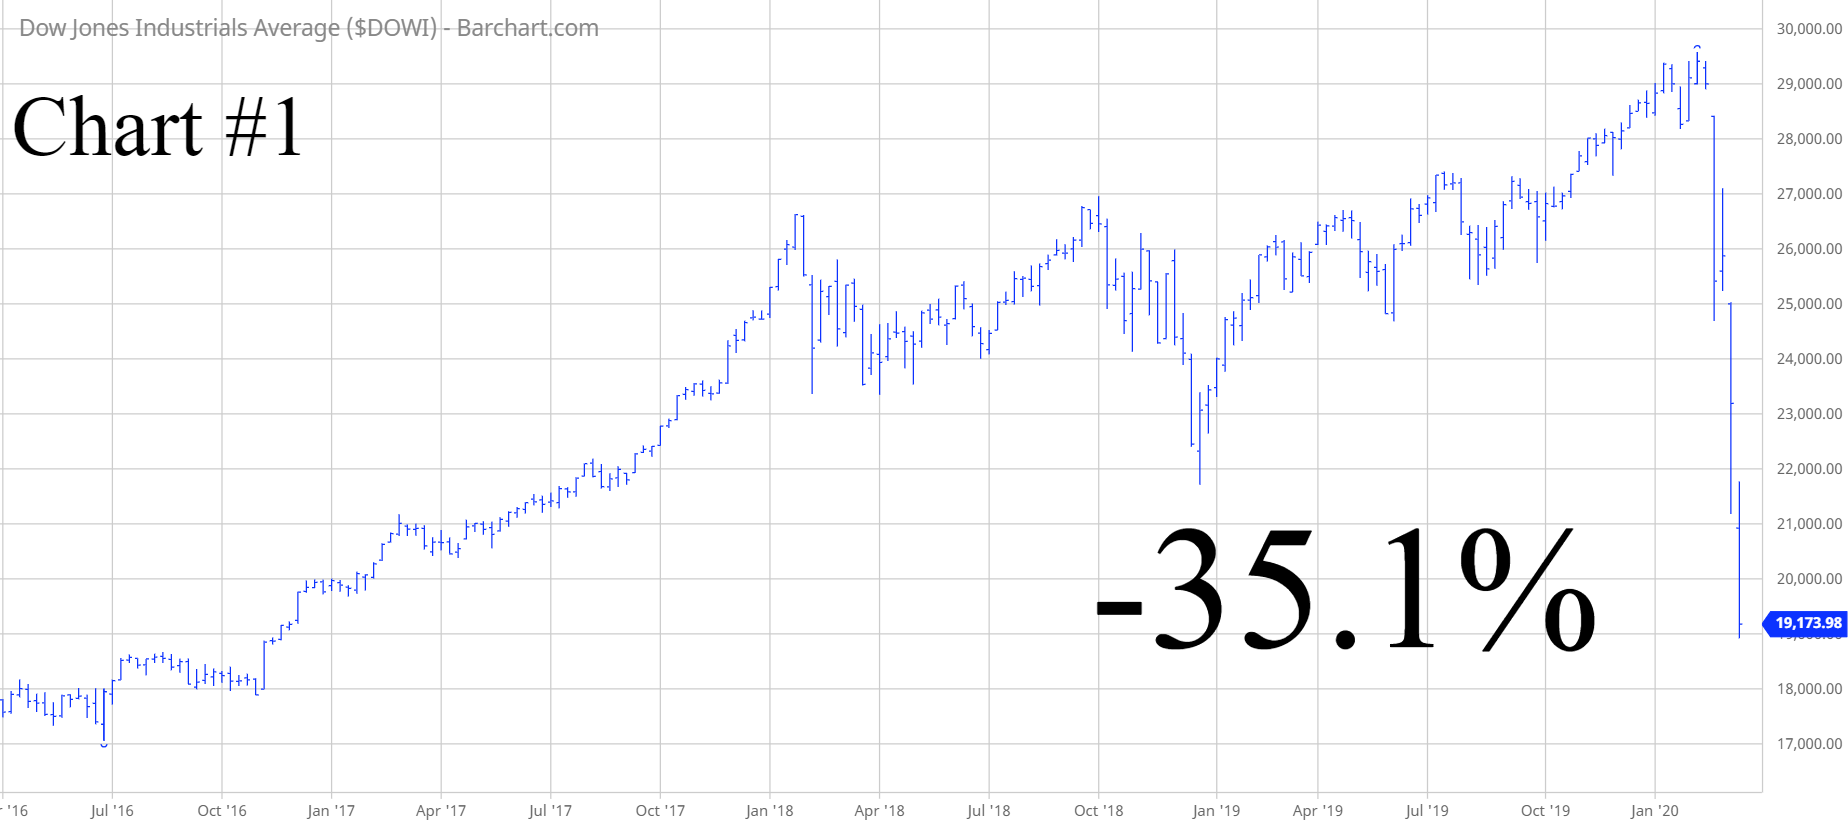
Please review Chart #1. DJIA has lost 35.1% of its value since 12 February. This represents the most brutal decline in such a short period of time since the Great Depression. Very briefly, let’s review the three nastiest bear markets of the past 100 years.

- Bear market beginning in 2007 – Down 59% over 27 months
- Bear market beginning in 1973 – Down 48% over 21 months
- Bear market beginning in 1929 – Down 86% over 34 months
Of course, it’s impossible to accurately forecast the duration and percentage decline of the current bear market. However, we can take an educated guess by examining the bear markets from 1929, 1973 and 2007. The average duration of the bear was 27 months. The average decline was 68%. If the current stock market meltdown is similar to the three worst bear markets of the past 100 years, then we can expect this bear to end in June 2023, with a value of 9462 for DJIA. This type of decline seems unfathomable considering how strong the stock market has been during the past decade. It’s almost incomprehensible to believe that a simple viral outbreak could cause so much turmoil in the financial markets.
Let’s take a broader view of historical bear markets. Instead of only concentrating on the three worst bear markets, let’s examine all bear markets since 1929. Please review the tables.
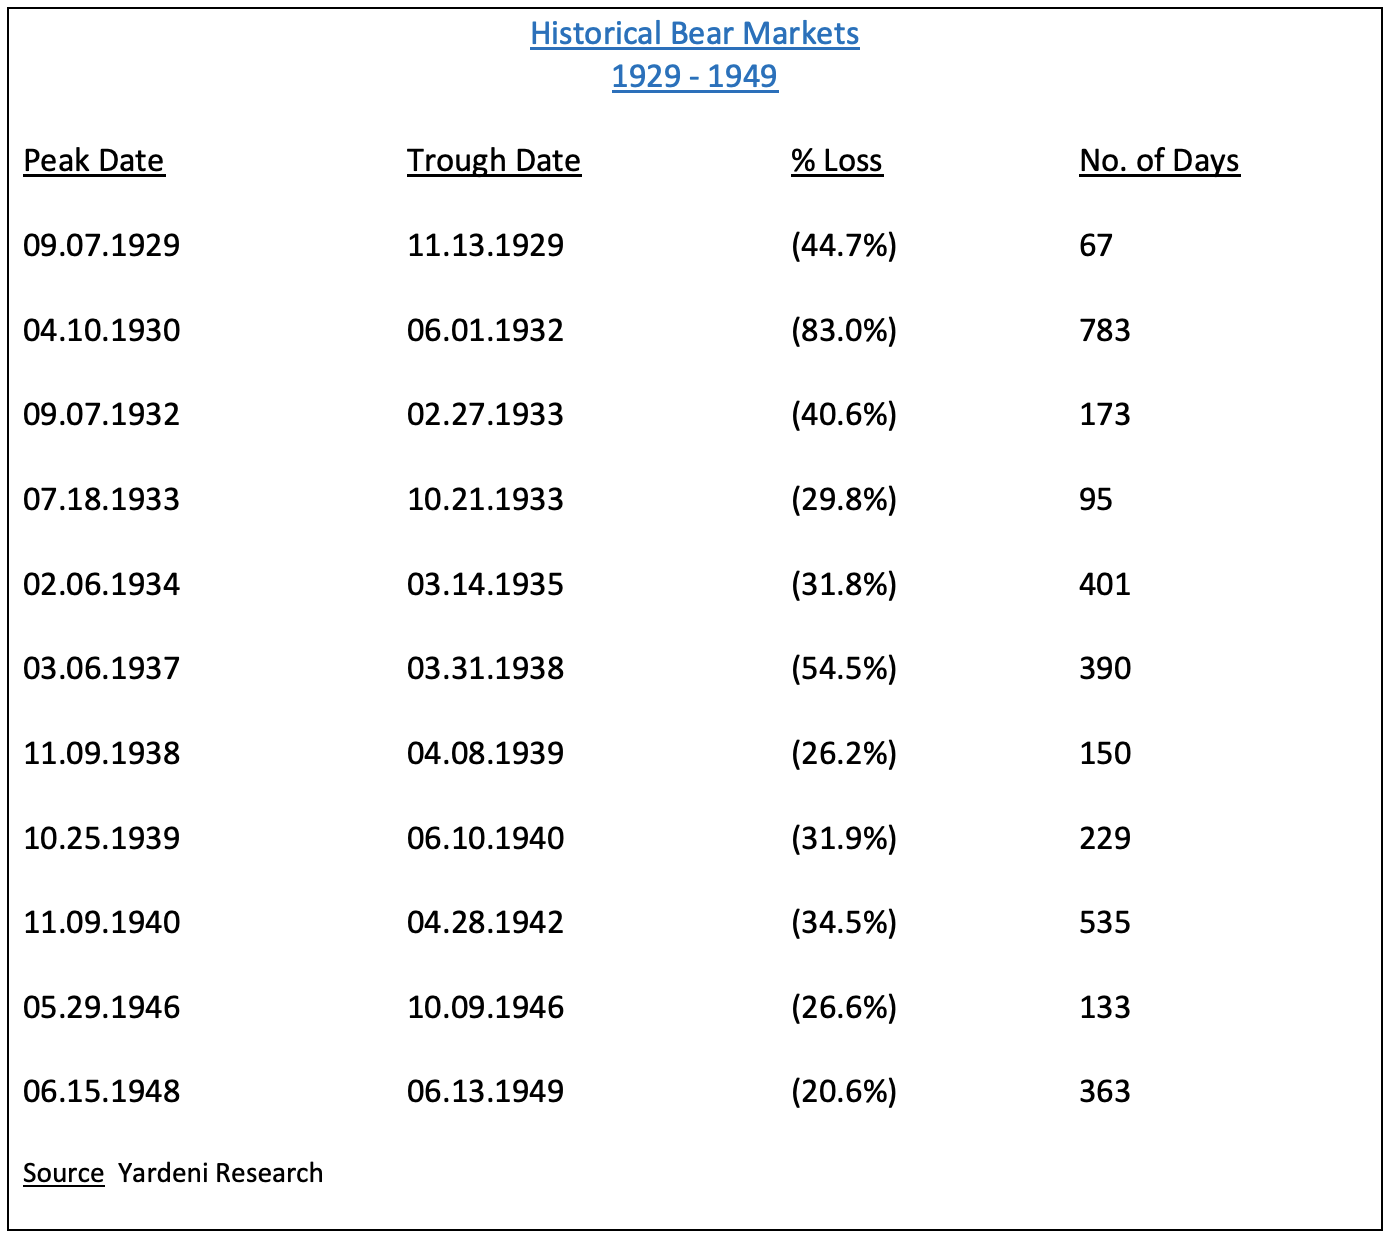
Since 1929, the average duration of a bear market has been 344 days. The average decline is 37%. If the current stock market meltdown is similar to an average bear market, we can expect the coronavirus bear market to end in February 2021, with a value 18628 for DJIA. Based on the fact that equity markets have not suffered a substantial decline in over ten years, it should not be a surprise if the coronavirus bear market is more painful than an average bear market.
In regard to the long-term momentum, the bulls are still in control of DIA despite the recent sharp decline. It would take a weekly close below 112.14 to push the long-term momentum in favor of the bears. This type of decline is rather unlikely.
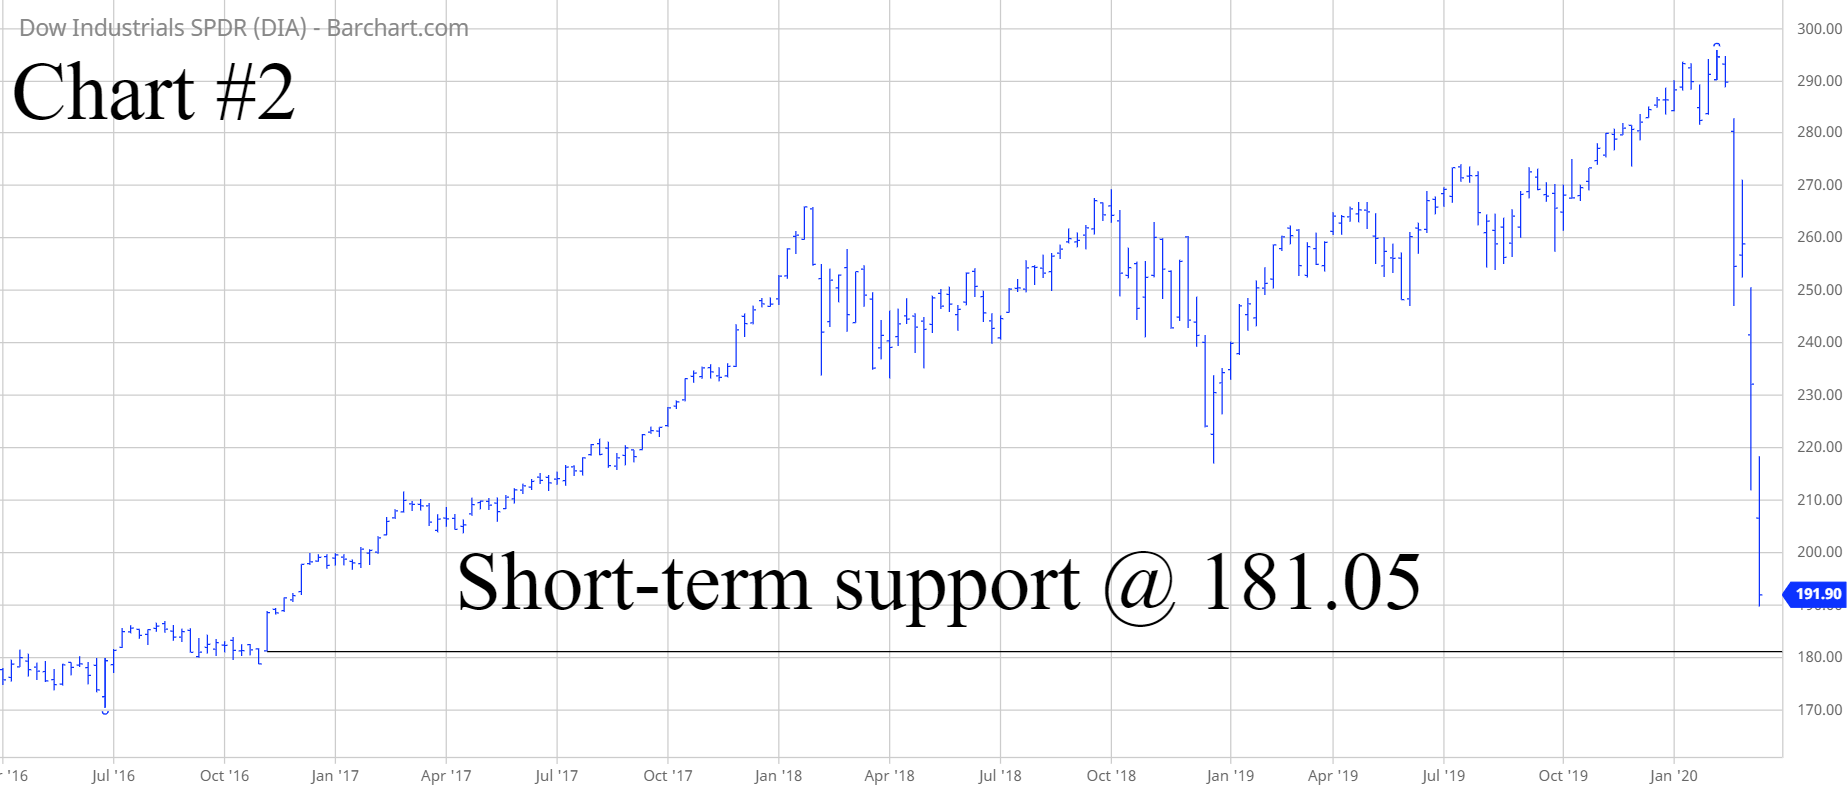
SHORT-TERM CHART – Dow Jones ETF – DIA
Please review the 4-year chart of DIA (Chart #2). The coronavirus has caused the short-term chart pattern to surrender its bullish position. The bears have the upper hand. The next level of support is 181.05. Based on the extreme nature of the recent decline, the bulls will have a very difficult time recapturing the momentum. The important number for the bulls is a weekly close above 233.60.
LONG-TERM CHART – Dow Jones ETF – DIA
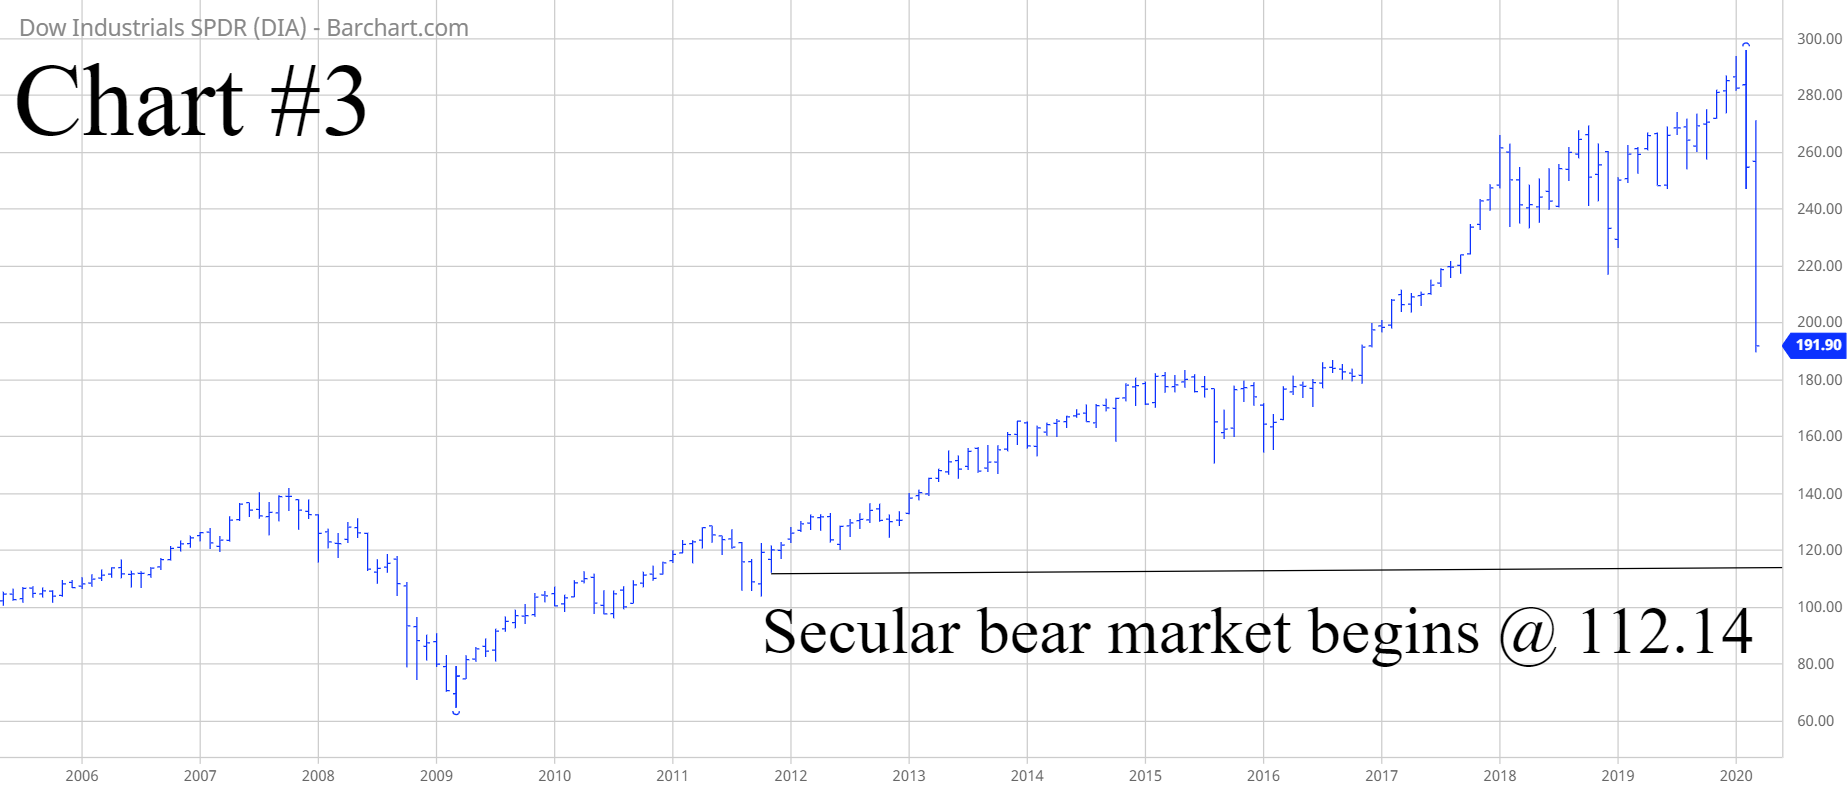
Please review the fifteen-year chart of DIA (Chart #3). Despite the recent decline, the long-term chart pattern is still bullish. It would take a weekly close below 112.14 to push the momentum in favor of the bears. A new secular bear market would begin @ 112.14. This type of decline is certainly possible, but not likely.