The Current State Of The Global Economy
Coronavirus Crisis Offers Attractive Investment Opportunities
The coronavirus pandemic has created the most severe financial dislocation to the global economy since the days of the Great Depression dating back to the early-1930s. The virus has effectively shut down the entire world economy, as people are experiencing major disruptions to their daily lives. How long can we expect this economic crisis to impact financial markets? Of course, it’s impossible to answer this question. However, we can provide an educated guess by examining previous health-related crises over the course of the past several decades. Please review the following table.
Thank you for reading this post, don't forget to subscribe!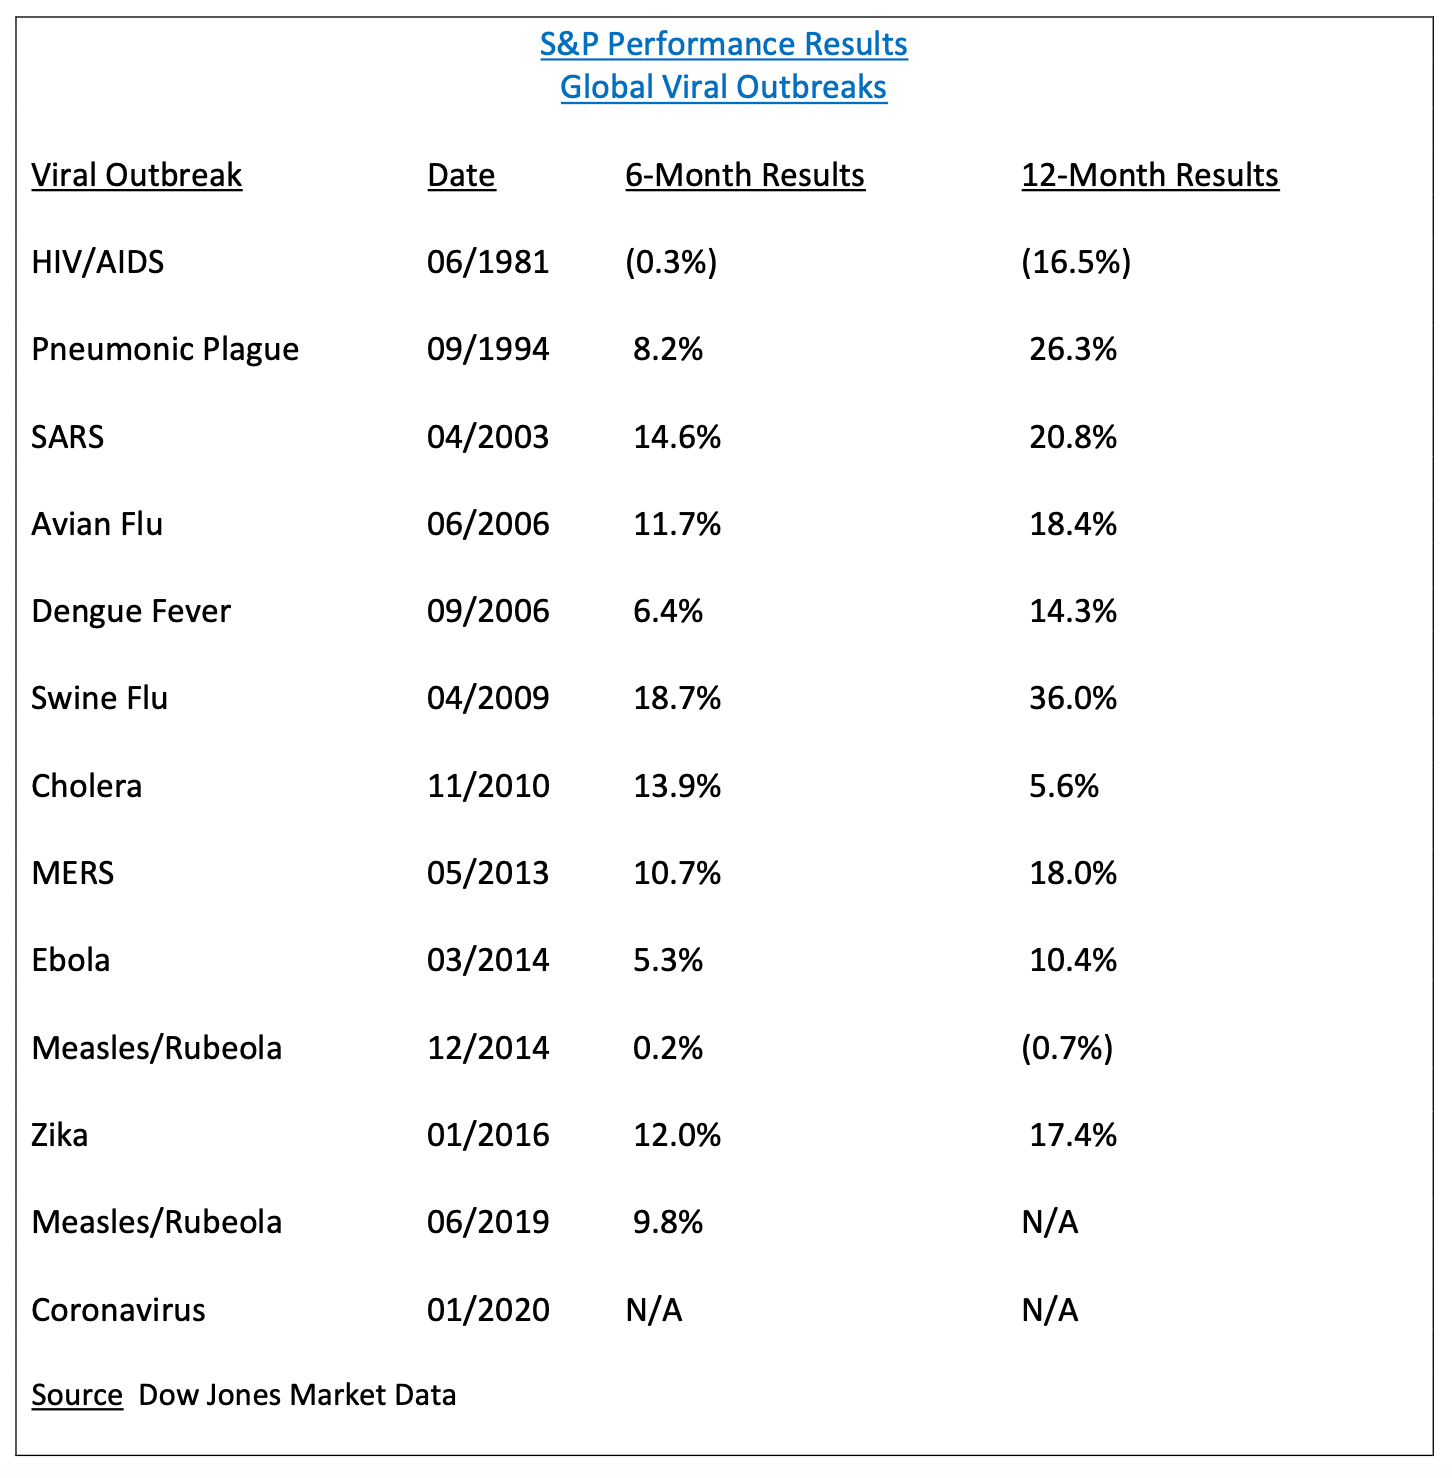
Based strictly on stock market performance, history tells us that global health crises are generally not responsible for creating bear markets. As you can see from the table, there have been 13 major epidemics and/or global health outbreaks during the past four decades. The data in the table clearly indicate that major health crises do not adversely affect the intermediate-term performance of the stock market (based on the S&P 500 stock index). The only negative impact occurred in 1981, when the HIV virus became a major health concern. Twelve months following the initial HIV outbreak, the S&P generated a decline of 16.5%. However, many Wall Street professionals argue that the S&P index was declining because the North American economy was in the midst of a severe recession. They claim that the poor performance of the stock market could not be attributed to the HIV crisis. Most likely, this argument is correct. Stocks were headed lower primarily because of the US recession, not because of the HIV epidemic.
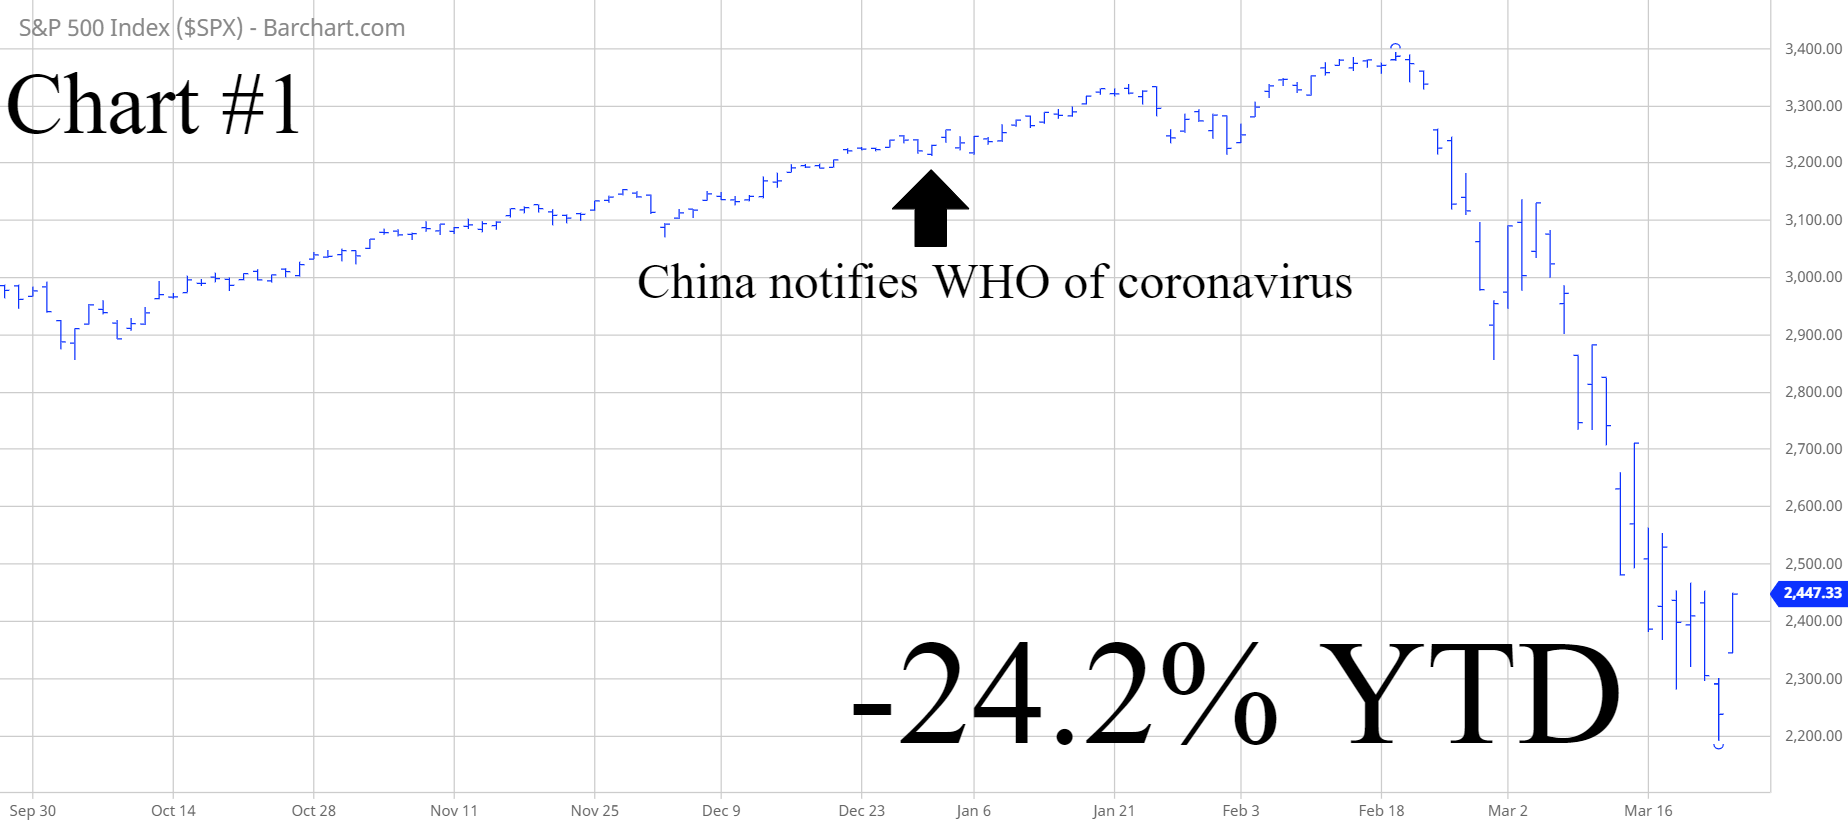
Will the coronavirus be responsible for unleashing a long-term (secular) bear market in global stocks? Based on historical research, the answer is “No.” In fact, historical data suggests the S&P 500 stock index could actually generate a positive rate of return over the course of the next 12 months. Officially, Chinese authorities notified the World Health Organization (WHO) on 31 December 2019 concerning the coronavirus. Based on the data provided in the table, investors should not be surprised if global stock prices are in positive territory by the end of 2020.
As of 24 March, the S&P 500 stock index is down 24.2% for 2020 (Chart #1). Many investors will argue that it’s highly unlikely for the stock market to recover all of its losses by the end of the year. The general consensus among the investment community is that the current bear market is different than previous bear markets. Why? Because investors believe that the coronavirus is unlike previous epidemics and pandemics. They think the coronavirus is potentially more catastrophic because of its global reach. The virus has devastated economic growth across the board in all countries. All major continents have been negatively impacted practically at the same time. No country has escaped the wrath of the virus.
Coronavirus Bear Market Versus Other Historical Bear Markets
Even though most investors currently feel like today’s bear market is somehow different, is that actually true? Is the current bear market noticeably different than a typical bear market? Let’s briefly explore the current bear market. Let’s compare it to other bear markets of the past. Specifically, let’s review all US stock market declines (greater than 20%) dating back to 1928. Please review the following tables.
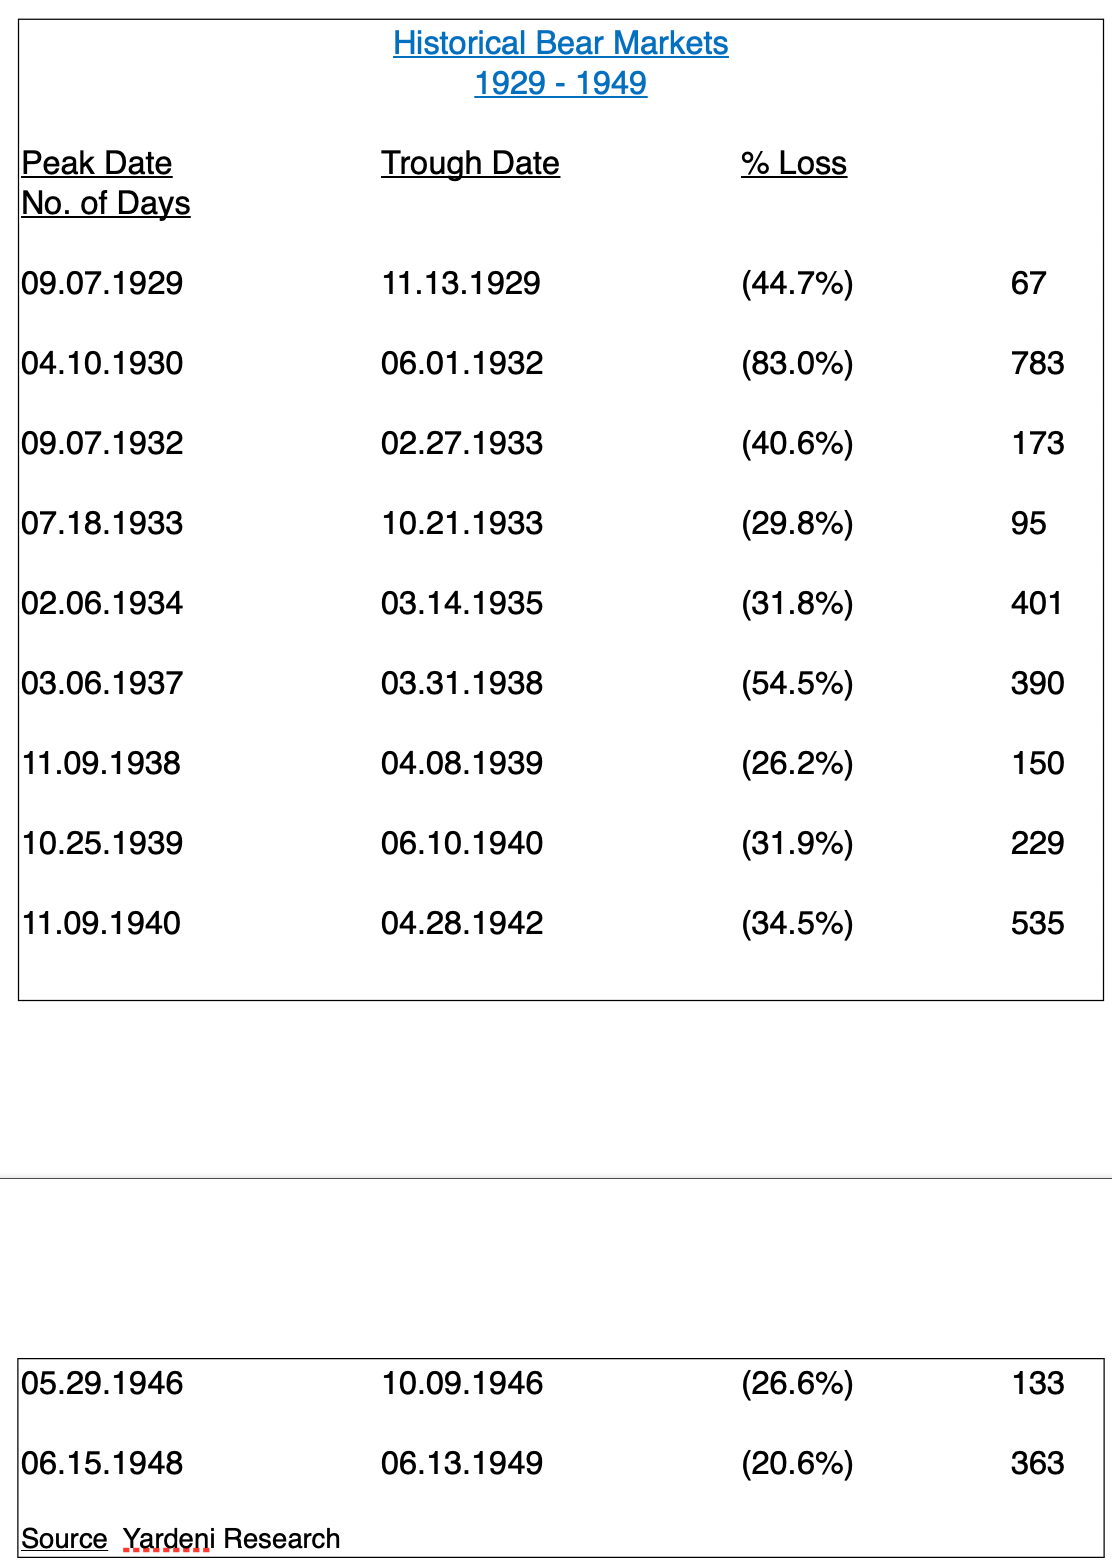

Since 1929, there have been 21 bear markets based on the S&P 500 stock index. The average duration of each bear market has been 344 days. The average decline is 37%. If the current stock market meltdown is similar to an average bear market, we can expect the coronavirus bear market to end in February 2021, with a value of 2137.
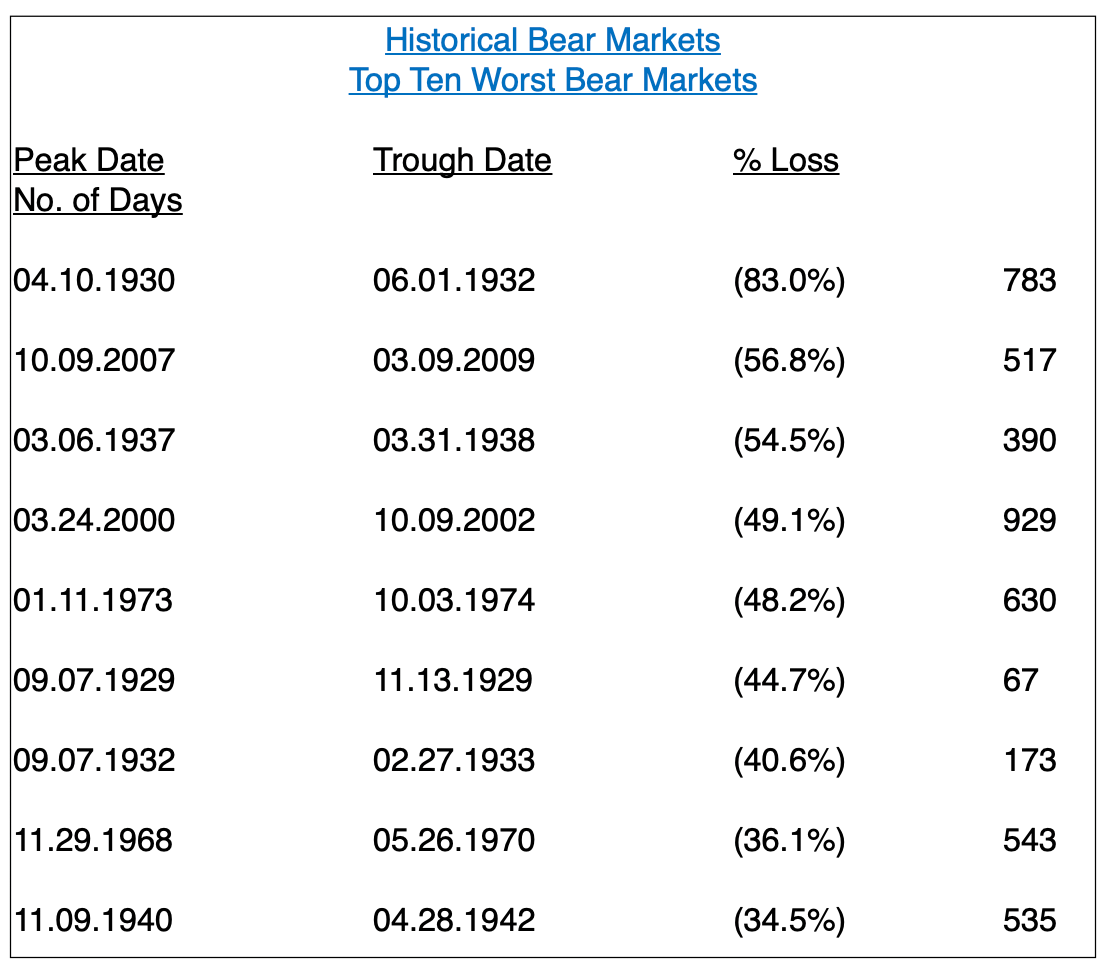
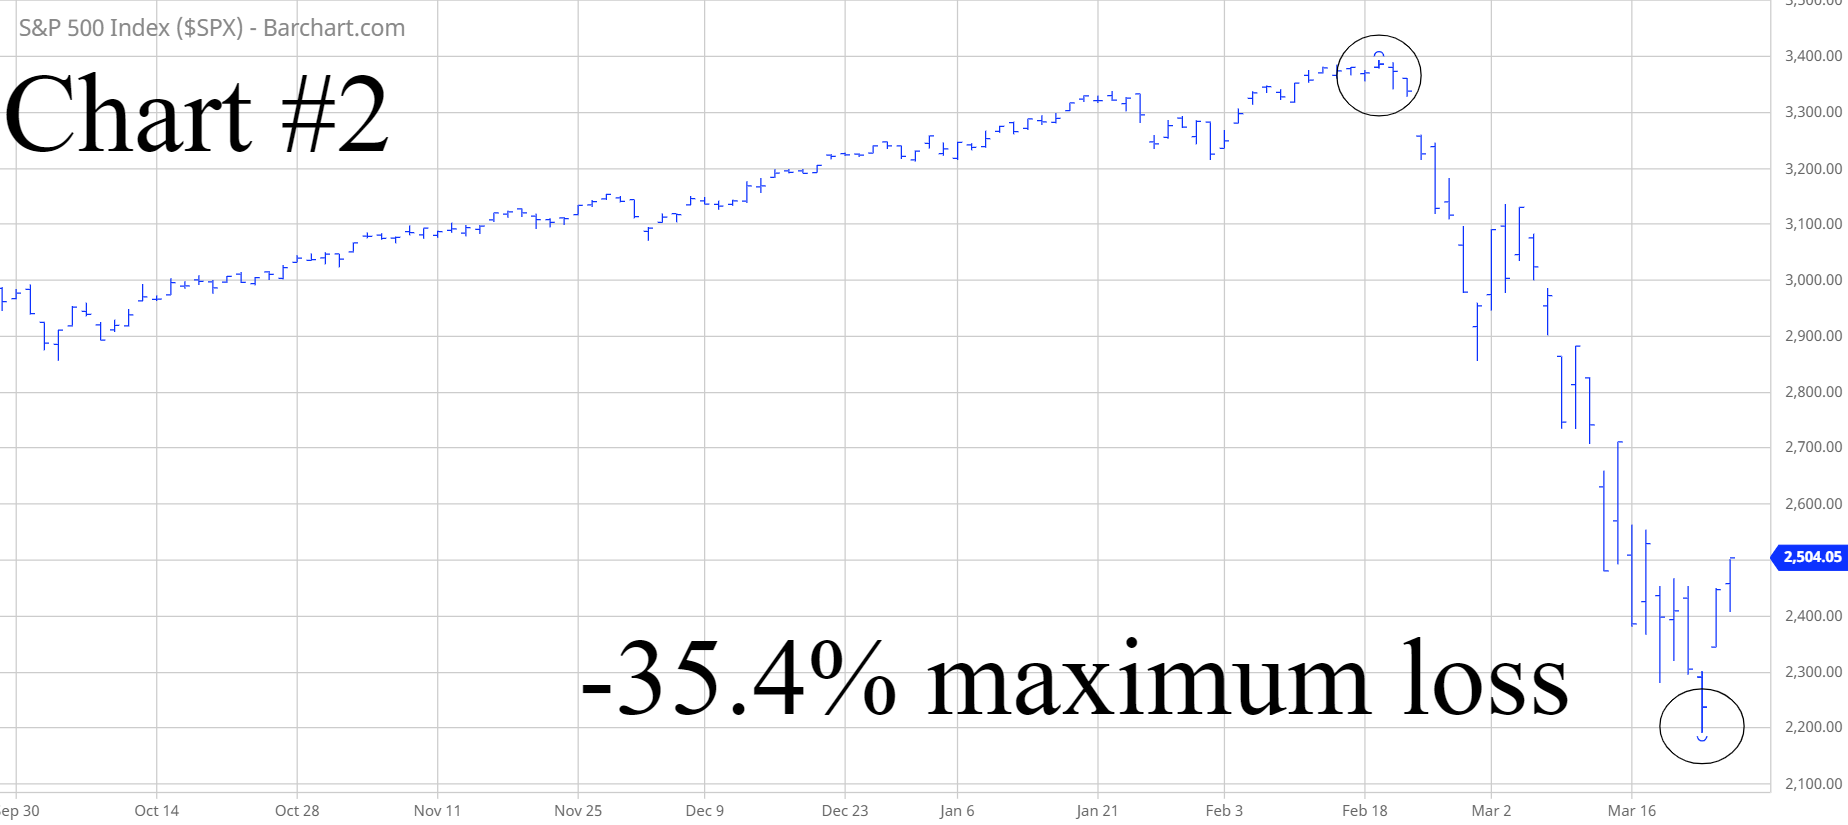
The table above includes the top ten worst bear markets of the past 100 years. The average duration of the ten worst bear markets was 467 days. The average loss was 48.1%. Will the coronavirus bear market make its way on the list as one of the top ten bear markets of the past 100 years? It’s certainly possible. In order to make the list, the current bear market must push the S&P 500 down to 1761. So far, the coronavirus bear market has recorded a maximum loss of 35.4%, which occurred on 23 March (Chart #2).
Coronavirus Bear Market Versus 1987 Bear Market
Of all the bear markets during the past 100 years, which bear market most closely resembles the coronavirus bear market? A strong argument could be made that the bear market of 1987 is most similar to our current bear market. Why? Because, contrary to popular belief, the crash of 1987 had very little to do with any type of fundamental problem. For example, leading up to the crash in October 1987, domestic economic activity in the United States was quite strong. Additionally, corporate earnings were healthy in 1987 and there were no major international crises to speak of. Overall, the global investment landscape was in fairly decent shape throughout 1987. There certainly was no indication that the largest single-day decline in the history of Wall Street was on the verge of manifesting itself in October of that year.
If the economy was stable and corporate earnings were robust, why did the S&P 500 plummet over 20% in a single day on 19 October 1987? Because many of the largest traders on Wall Street were using a new concept known as program trading. Essentially, program trading is the use of computer-generated algorithms to trade a basket of stocks in large volume and typically with great frequency. On the surface, program trading is relatively harmless. However, there are occasions when program trading can unleash a substantial amount of volatility in a very short period of time. This is precisely what occurred in October 1987.
For the past 30+ years, financial historians have studied and evaluated the crash of 1987. Most historians and investment professionals agree that the 1987 bear market was caused by a single one-time event emanating from excessive computerized trading. In fact, many stock market experts have characterized the 1987 crash as a “fluke” that had absolutely nothing to do with the structural health of the global economy. These experts point to the fact that the stock market recovered quite rapidly following the crash on 19 October 1987. The speedy recovery of the stock market proves their argument that the crash of ’87 was one of the least harmful bear markets of all-time.
Although the coronavirus bear market is only a few weeks old, several of the most well respected analysts on Wall Street are already comparing it to the bear market from 1987. Their argument is based on the fact that the current stock market decline is based on a single one-time event (e.g. coronavirus), which is similar to the one-time event (e.g. program trading) in 1987. Another similarity to 1987 is the health of the domestic economy in the United States as well as economic activity around the globe. Prior to the outbreak of the coronavirus, the US economy was in fairly decent shape, which was also true of the economy in 1987.
Several financial journalists and media consultants are under the impression that we are in the middle of a global financial crisis similar to the financial crisis of 2008 or the Great Depression of the 1930s. This is not completely factual. A more accurate way to describe our current state of affairs is by labeling this as a health crisis. Financial crises are similar to what we experienced in 2008-2009 and during the late 1970s with runaway inflation. Today’s crisis is health related, which is yet another reason why the current bear market could be very similar to the 1987 stock marker crash. Don’t be surprised if the coronavirus bear market creates a “V shaped” recovery analogous to 1987.
Will The Global Economy Enter A Recession In 2020?
The economic effects of the coronavirus will make it virtually impossible to avoid a recession in 2020. The virus has completely shut down global trade between countries. Economic activity has essentially ceased to exist. Consequently, a recession is unavoidable. What will be the severity of the recession? Additionally, will the recession spill over into 2021? Please review the following table.
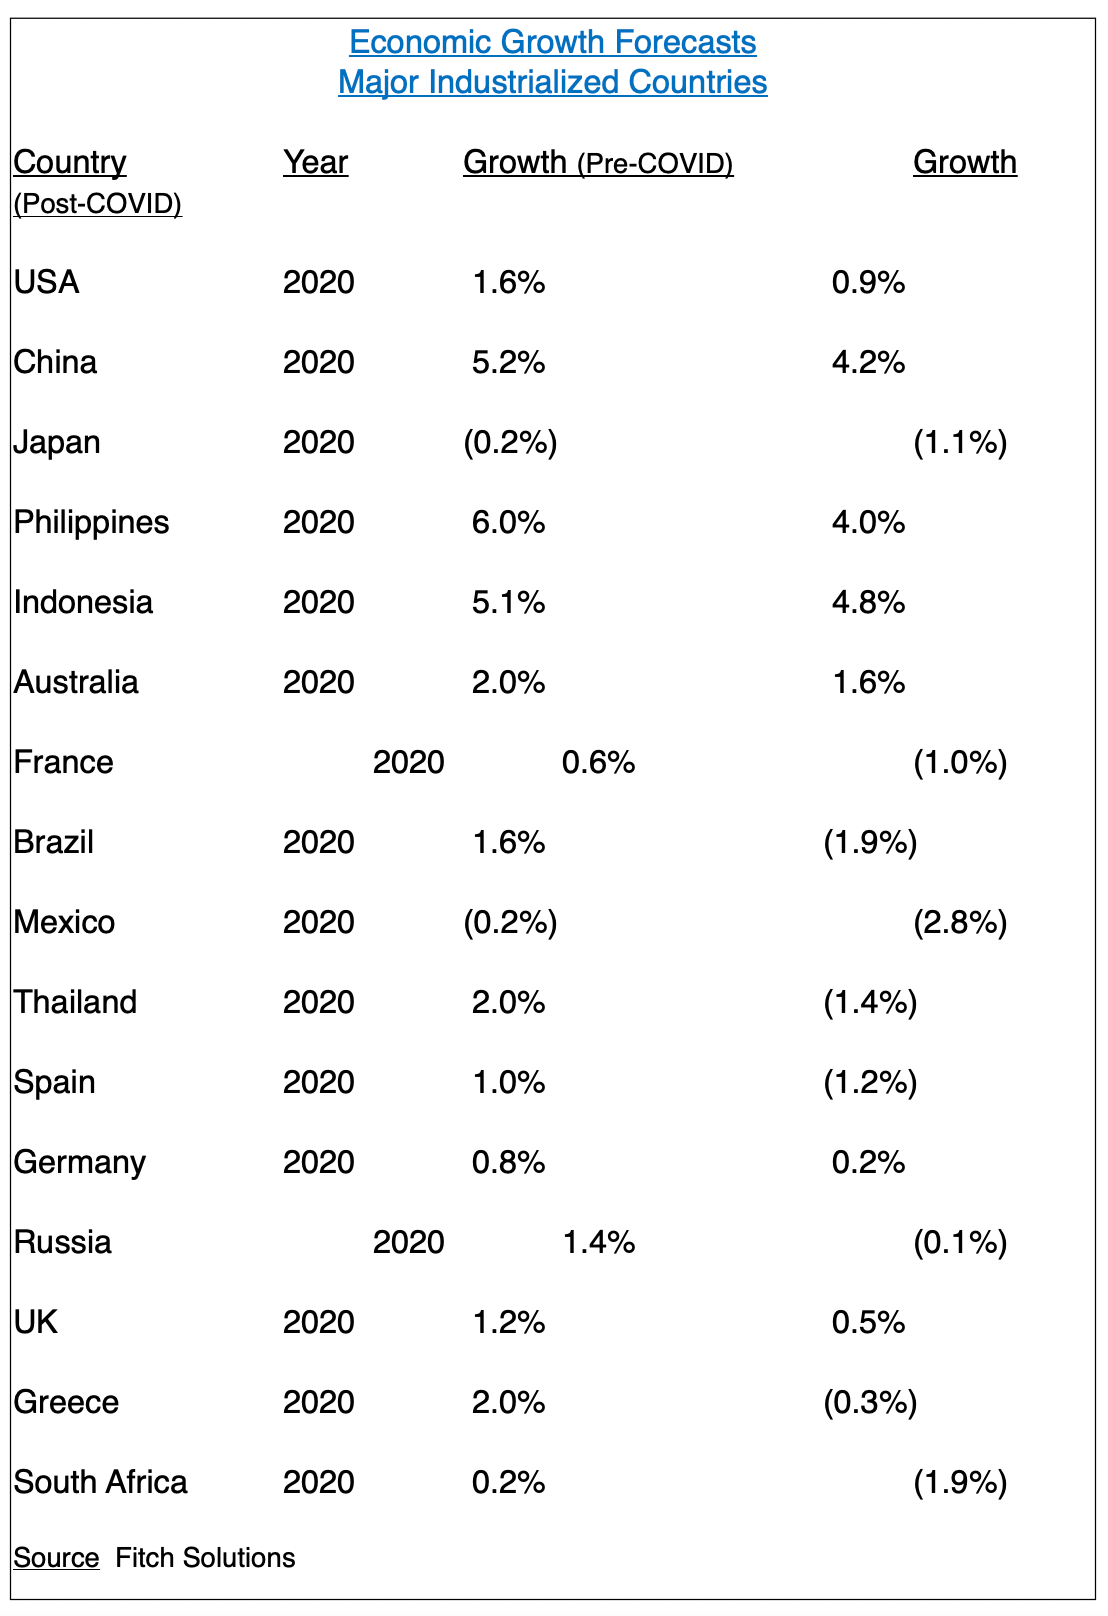
Fitch Solutions tracked the GDP performance of 16 industrialized countries. All 16 countries were revised to the downside. The average revision was an annual GDP reduction of (1.4%). The largest reduction occurred in Brazil, with a substantial revision of (3.5%). Indonesia enjoyed the smallest reduction of (0.3%).
The latest revision by Fitch occurred on 20 March. Fitch stated in its report that the company will be releasing several more GDP revisions over the course of the next few months. Fitch believes that all future revisions will most likely be to the downside, as the negative impact of the coronavirus reverberates through the world economy.
At this point, Fitch is unwilling to make any forecasts beyond 2020 until they have a better handle on how the virus will impact the global economy throughout the next six months. Currently, there are a few professional economists who have released economic forecasts for 2021. For example, Dr Joel Prakken is the chief economist with HIS Markit, an economic forecasting firm headquartered in London. Dr Prakken is forecasting a strong recovery in the United States for 2021. His GDP forecast is 3.8% for the US. Dr Prakken believes that the global economy will create surprisingly strong economic activity in 2021. He is forecasting a very strong rebound in 2021.
Coordinated Fiscal And Monetary Action Taken By Global Leaders
The main source of Dr Prakken’s bullish enthusiasm is based on the unprecedented amount of coordinated fiscal and monetary stimuli provided by government leaders and central banks around the world. There has never been such a massive amount of stimuli injected into the global economy at one time. Of course, the objective of the stimuli is to provide financial support to consumers, small businesses and large corporations until the coronavirus is reduced to a more manageable level. Please review a small sample of the various programs and initiatives enacted by global leaders over the course of the past few weeks.
- $1,200 delivered to every American taxpayer (based on income threshold)
- $500 delivered to every American child (based on income threshold)
- Delay tax filing deadline to 15 July for all American citizens
- Temporarily suspend interest payments on student loans from US Dept of Education
- Federal Reserve cuts short-term interest rates to 0%
- Federal Reserve unveils unlimited government bond purchase program (known as QE)
- Federal Reserve enacts a corporate bond and municipal bond purchase program
- European Central Bank increases its bond purchase program
- Bank of England lowers its key lending rate to 0.25%
- Bank of England introduces a new term-funding scheme to help small businesses
- Bank of Japan doubles its stock purchase program to ¥12 trillion
- Bank of Canada announces a fiscal-stimulus and tax-deferral program (C$55 billion)
- Bank of Australia launches an unlimited bond purchase program
- Bank of China reduces bank reserve requirements
This list represents just a small sample of the trillions of Dollars, Yen, Pounds, Yuan, Euros and IMF special drawing rights which have been placed into the global economy. Without question, this is the largest coordinated effort to stimulate economic activity in the history of the modern world. Please review the following table.
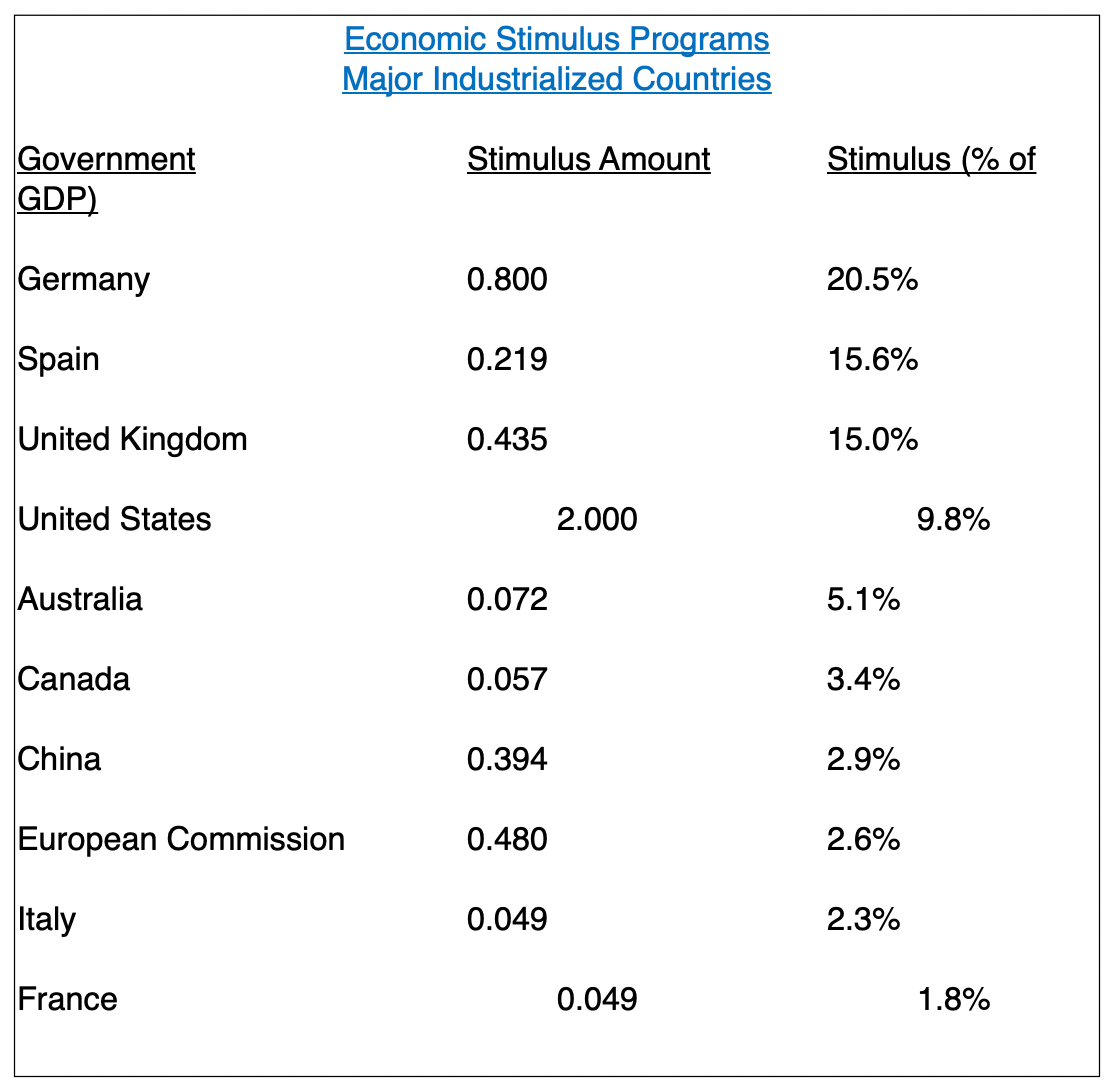
This table lists the amount list of each country’s stimulus efforts in relation to its GDP. As the table indicates, Germany has pledged the largest amount of stimulus as a percentage of its GDP. In terms of dollar amounts, the United States leads all countries with $2 trillion of domestic stimulus.
The biggest concern within the investment community is the staggering amount of debt that will soon be added to these countries’ balance sheets. The vast majority of these countries currently have extremely high debt-to-GDP ratios. These ratios will increase dramatically over the course of the next few years as new debt is added to the balance sheets. So far, countries have been able to successfully manage their balance sheets. However, eventually there will come a tipping point where the debt-to-GDP ratio becomes unmanageable. We could be approaching that level very soon.
Country Debt-To-GDP Ratio
- Germany – 61%
- Spain – 98%
- UK – 84%
- USA – 105%
- Australia – 30%
- Canada – 85%
- China – 61%
- EU – 80%
- Italy – 137%
- France – 100%
- Japan – 237%
The Coronavirus Has Impacted All Asset Classes
The stock market is not the only asset class that has been affected by the coronavirus. All asset classes have been impacted. Please review the following table.
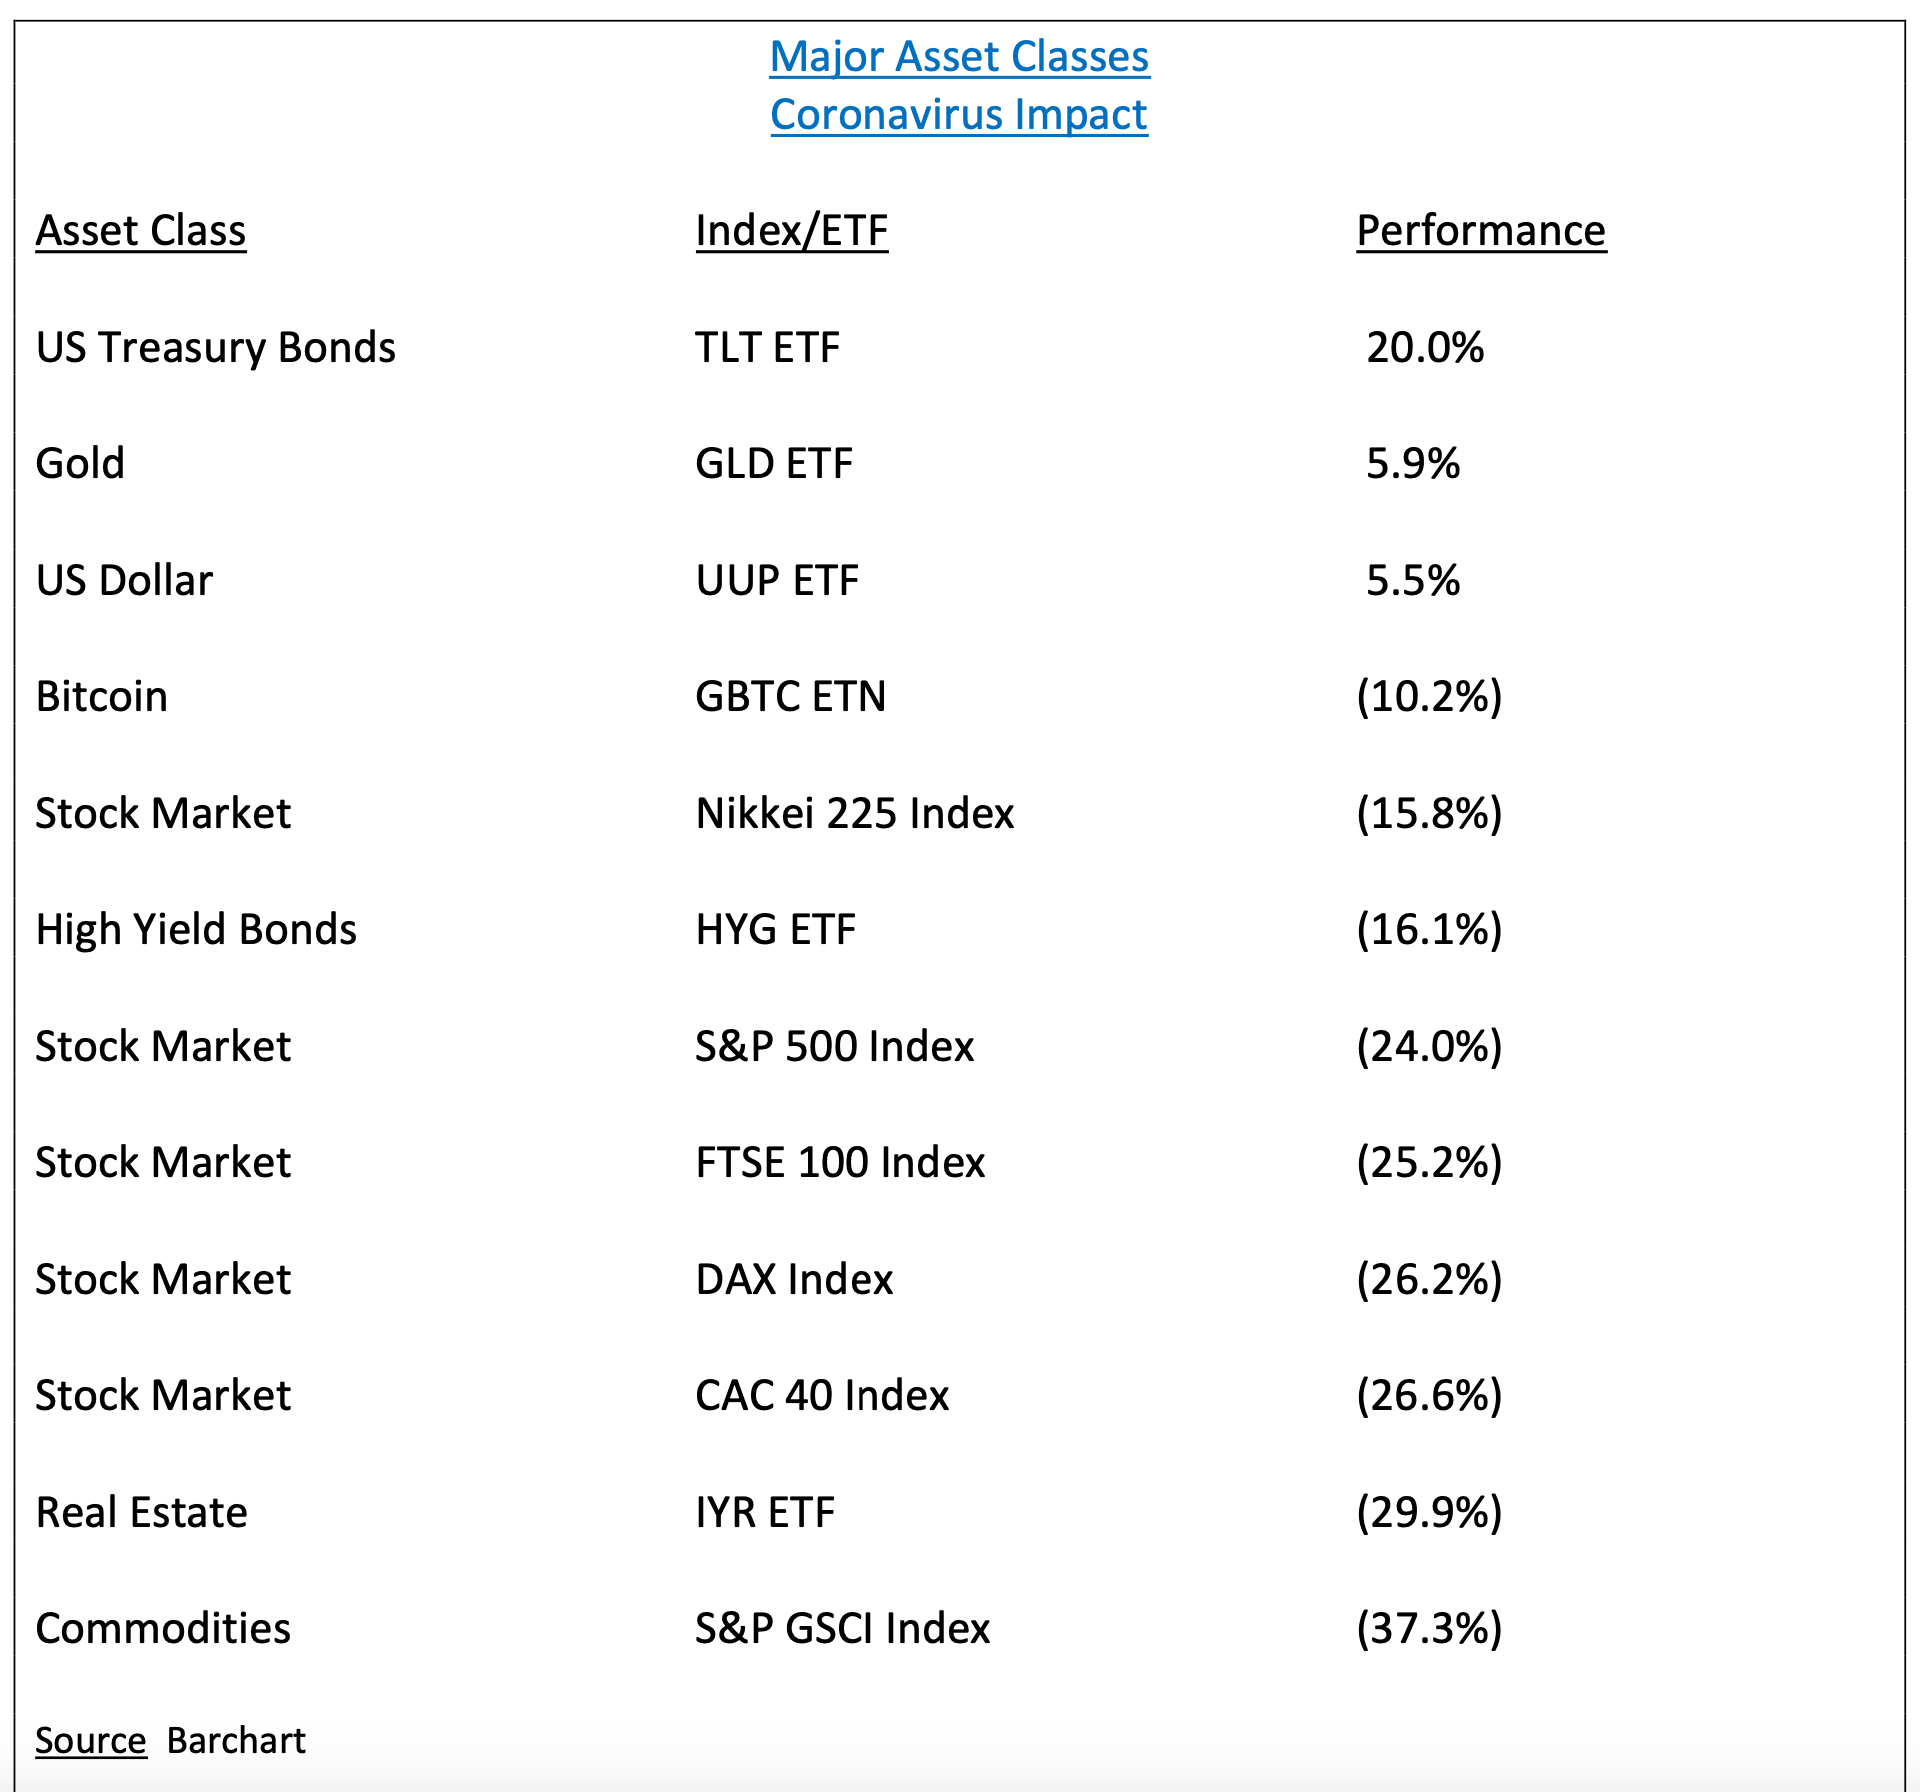
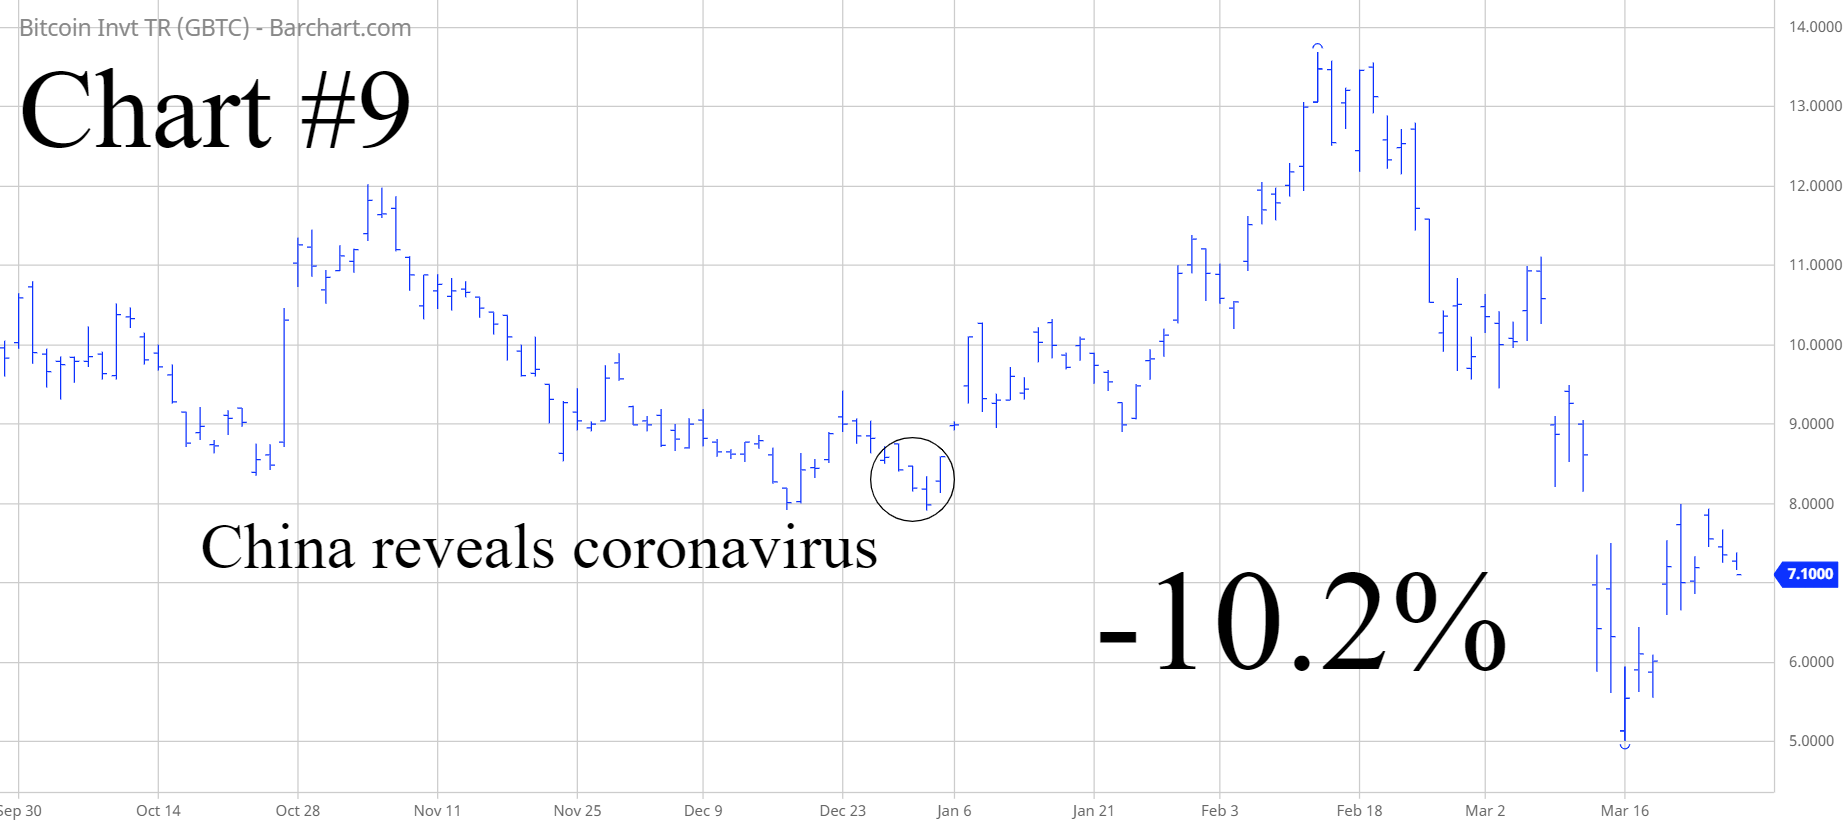
As you can see from the table, only three asset classes have managed to generate a positive rate of return since China revealed the coronavirus to WHO on 31 December 2019. The three assets are US Treasury Bonds, Gold and the US Dollar. Quite frankly, it’s not the least bit surprising that these three assets have performed remarkably well during the coronavirus hysteria. From an historical perspective, US T-Bonds, Gold and US Dollar have always been considered an excellent “safe haven” investment. In a typical financial crisis, the majority of assets decline in value as investors rush into the safety of cash. This explains why most assets on the list have lost value.
The following charts are linked to the above table
Chart #3 – GLD
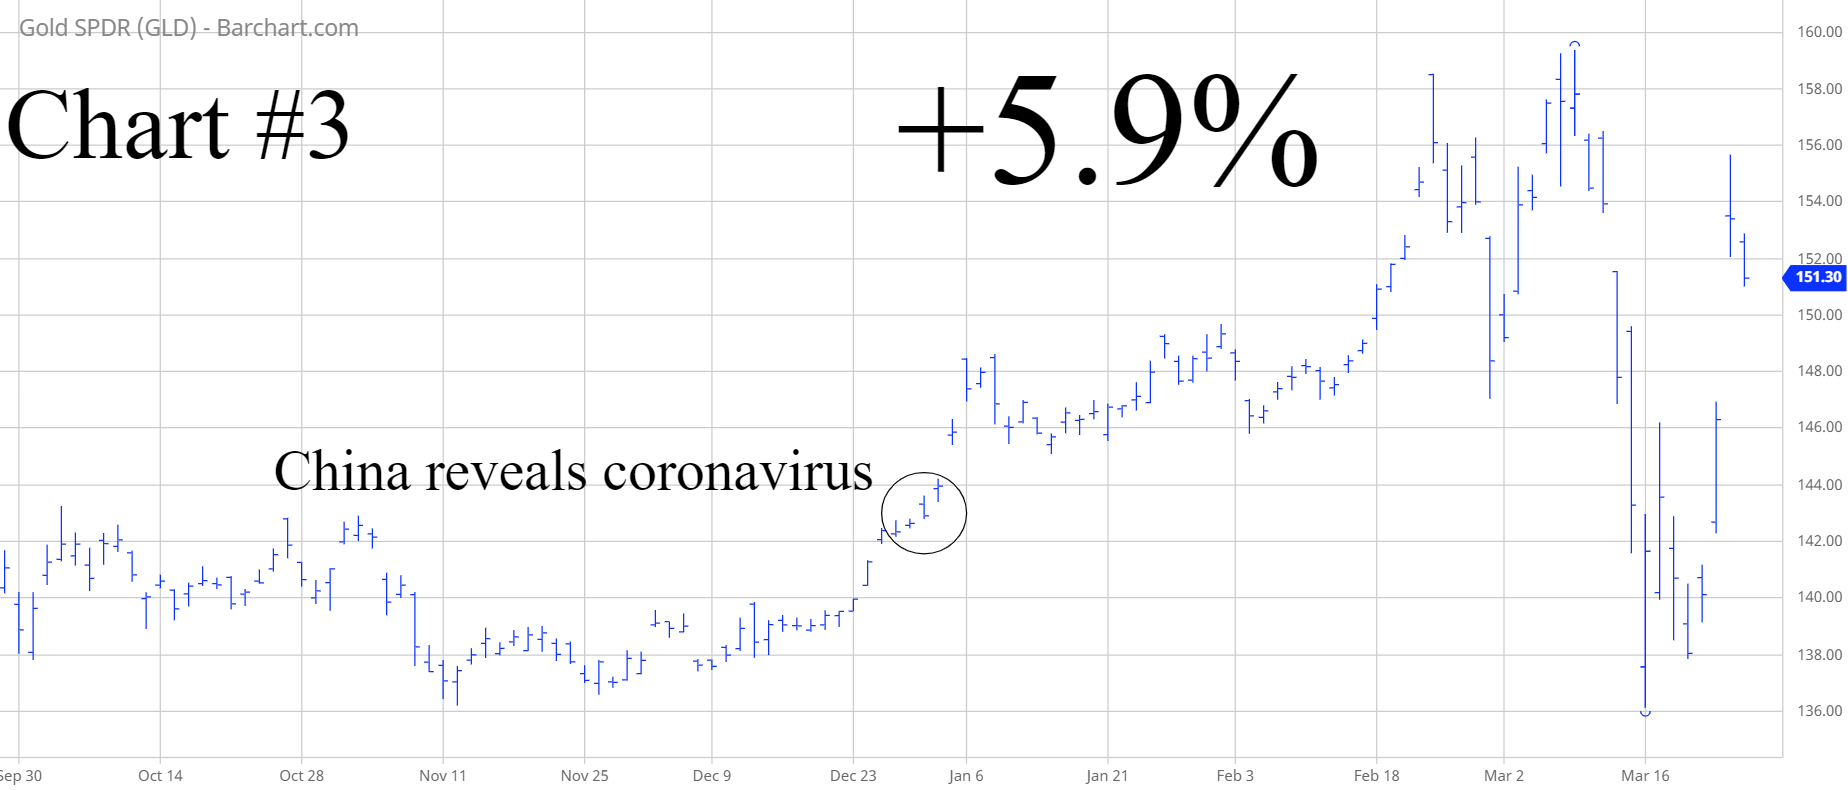
Chart #4 – UUP
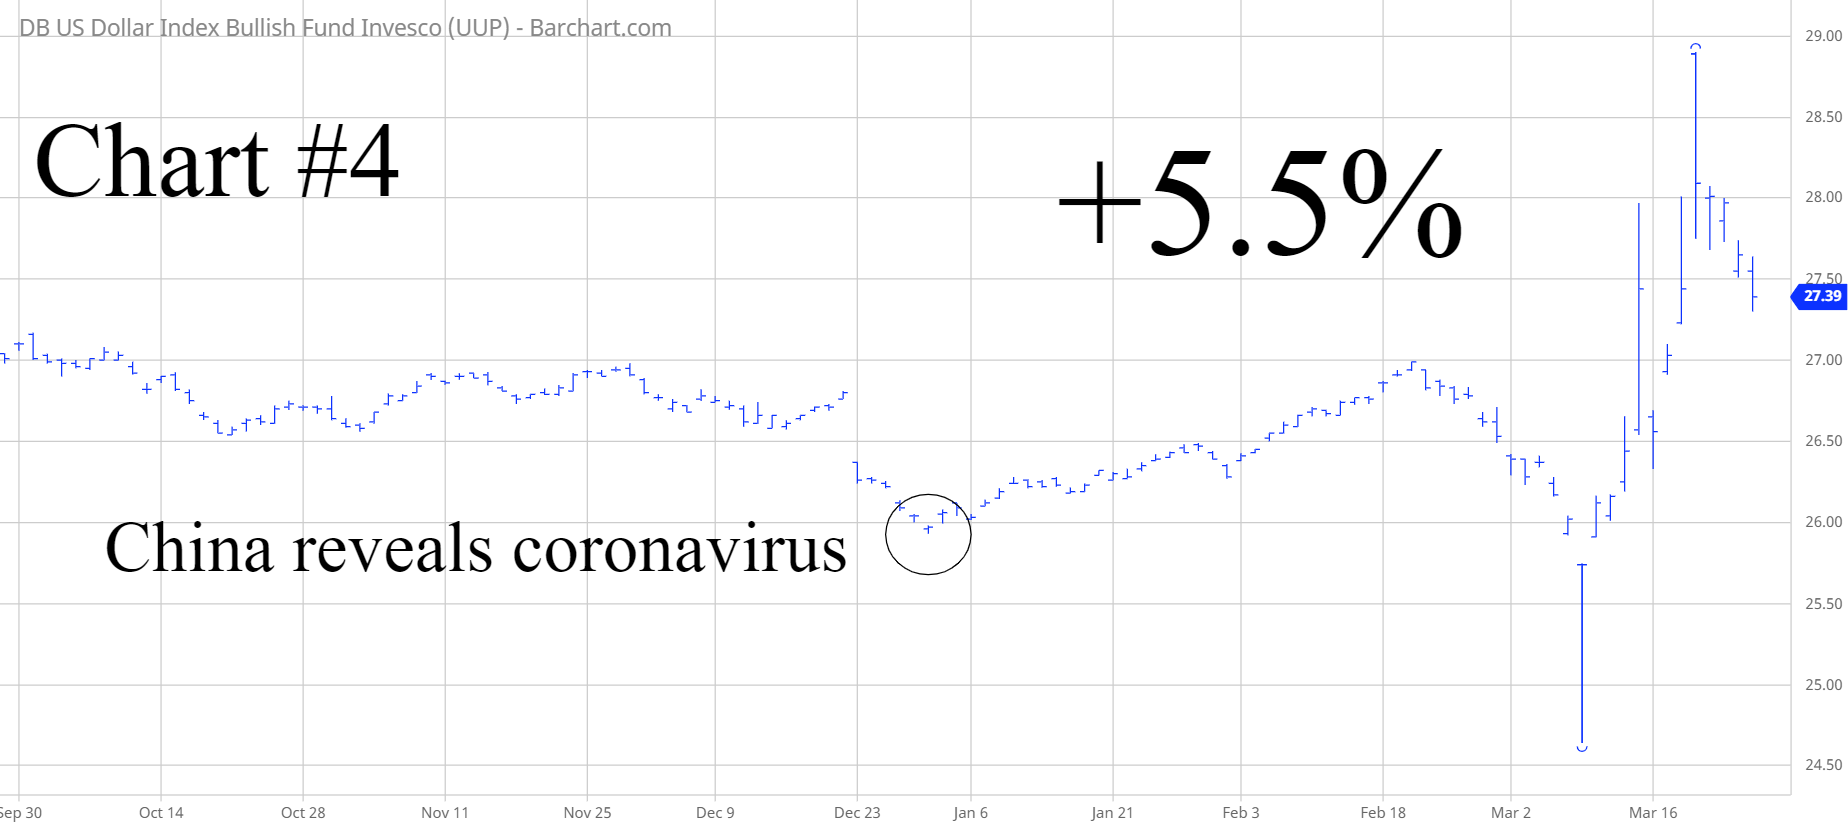
Chart #5 – TLT
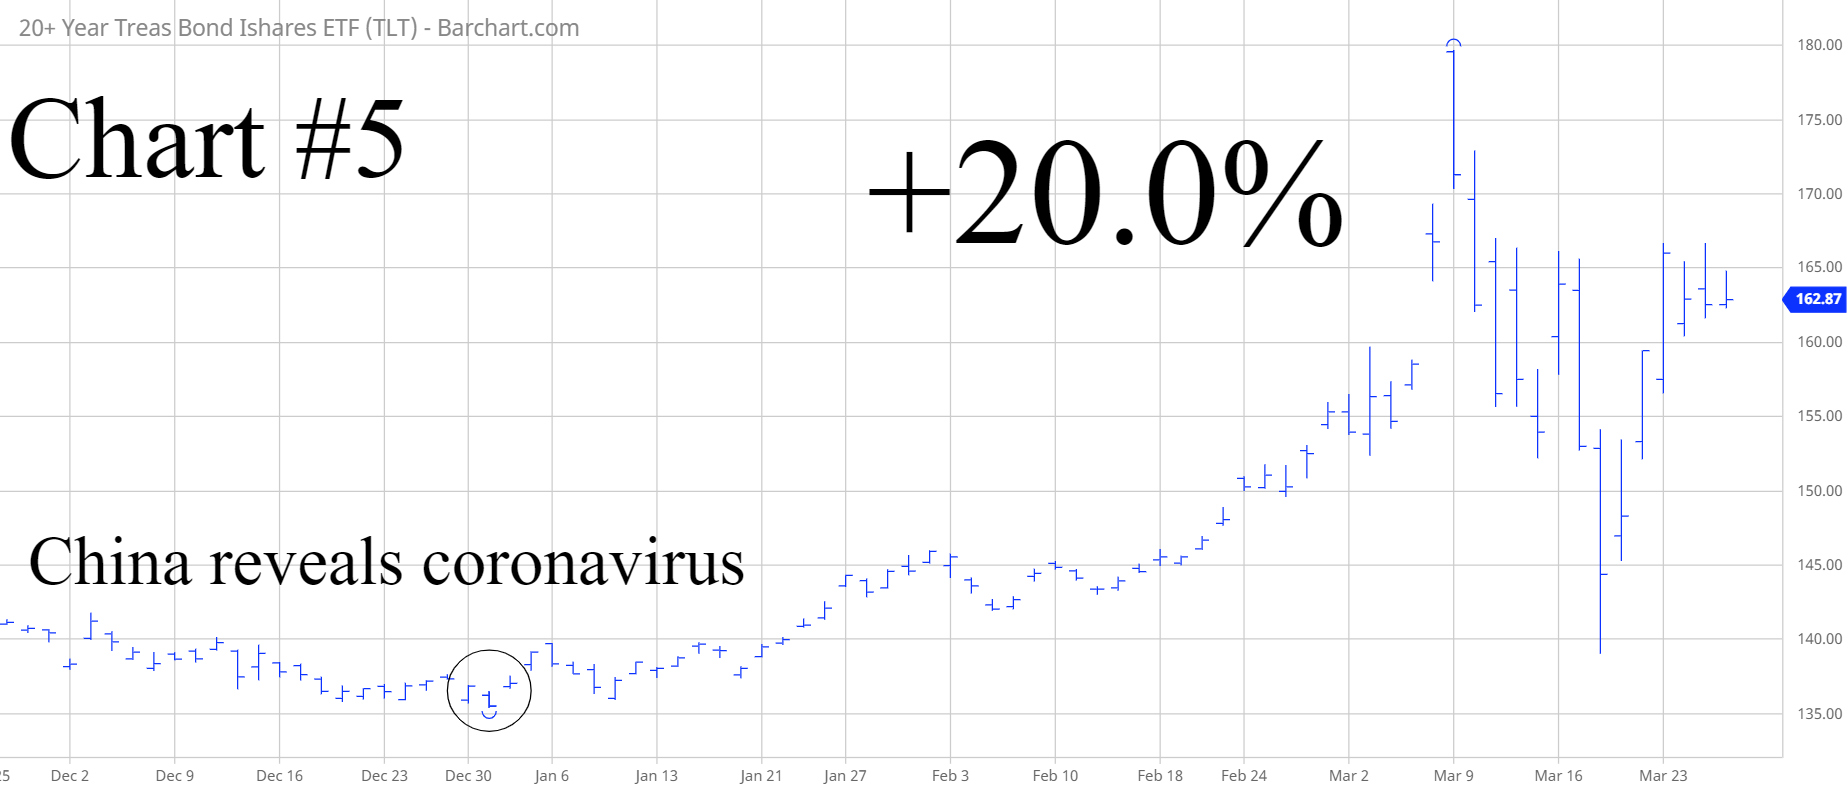
Chart #6 – HYG
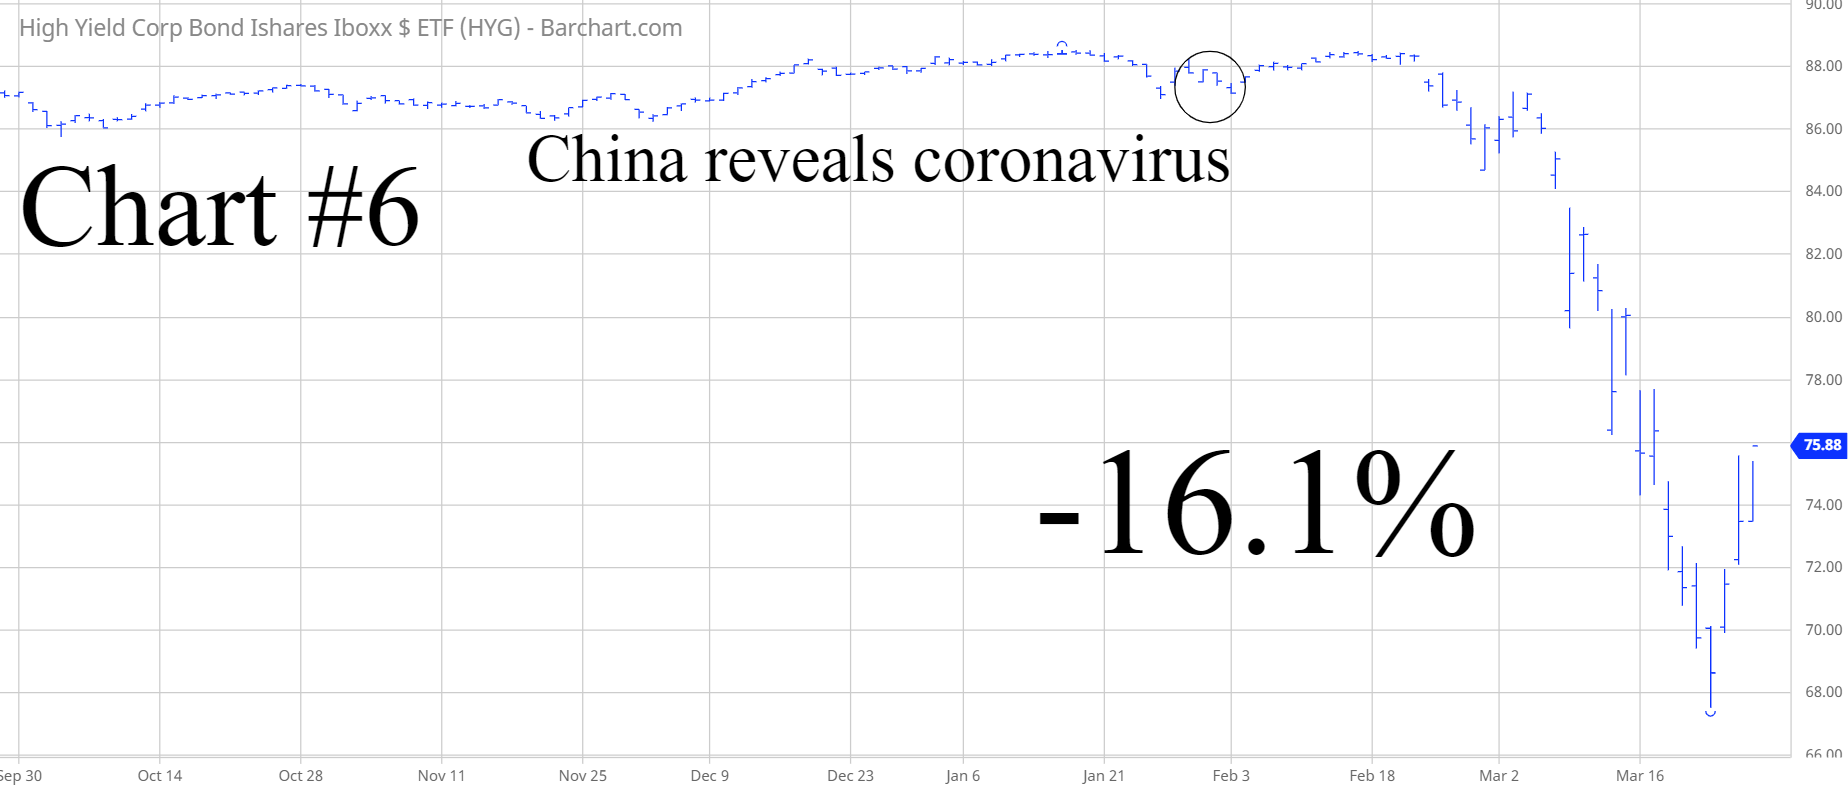
Chart #7 – GSCI
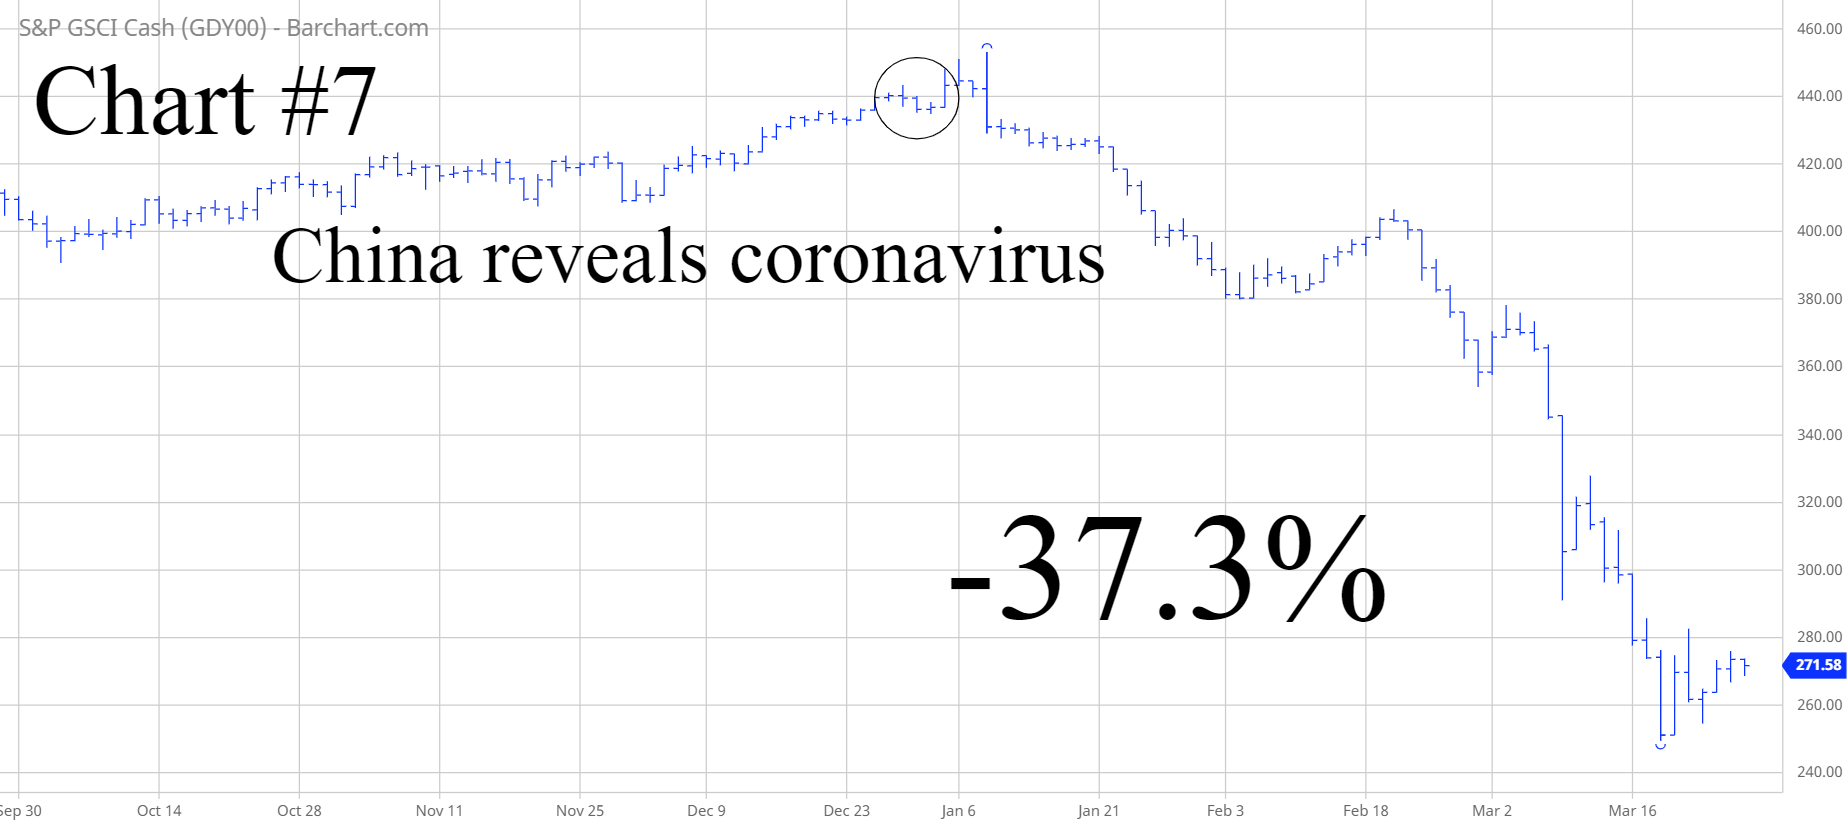
Chart #8 – IYR
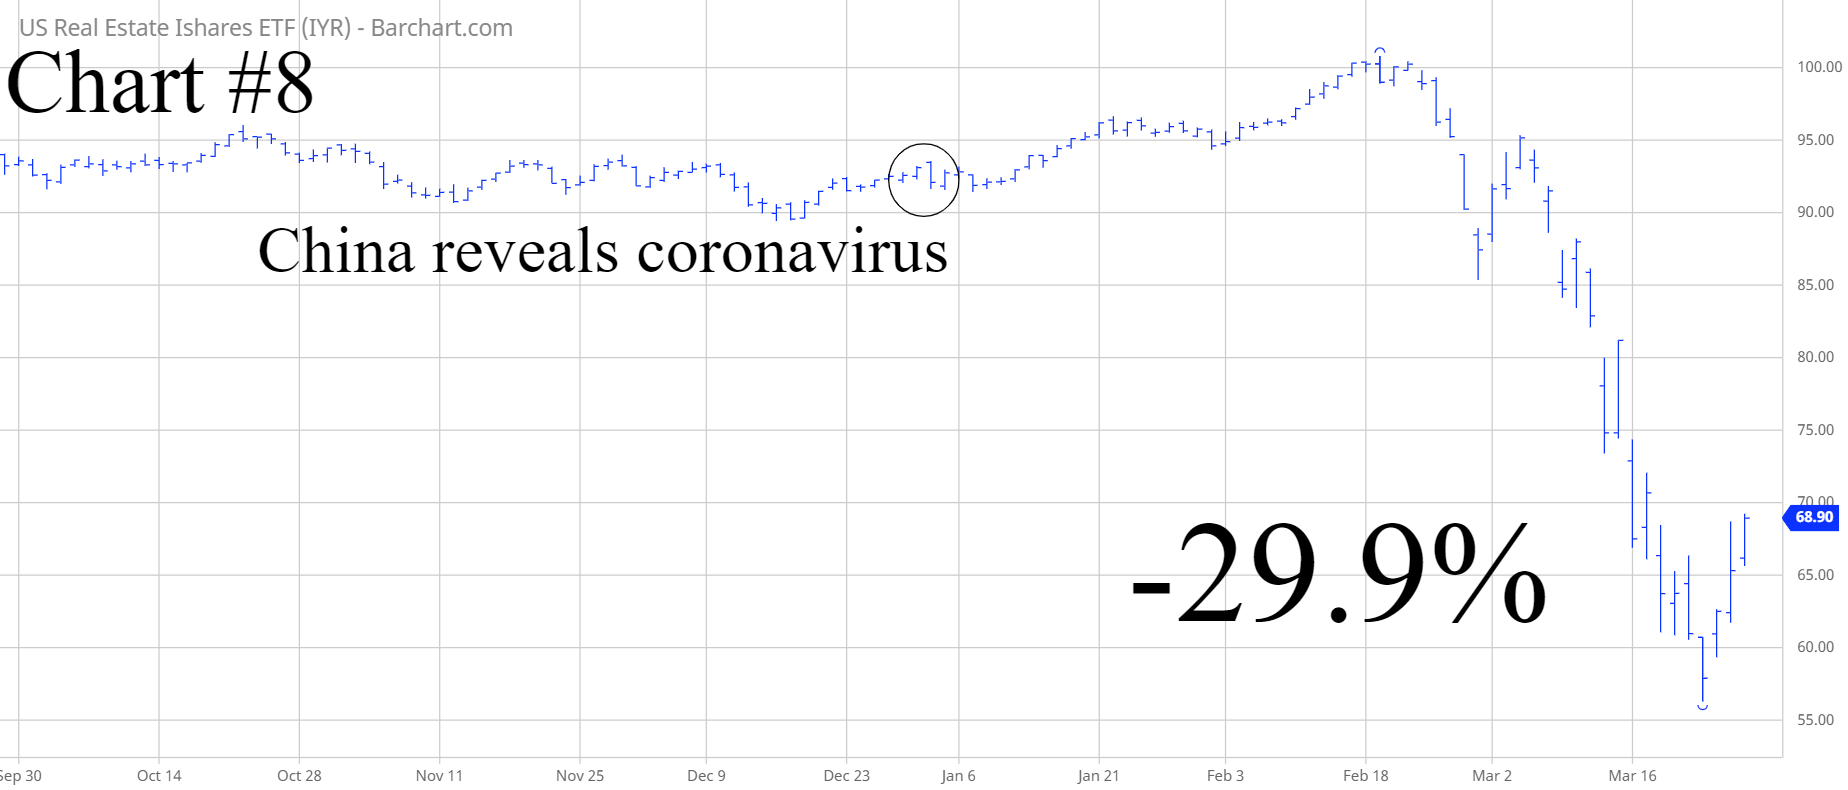
Chart #9 – GBTC
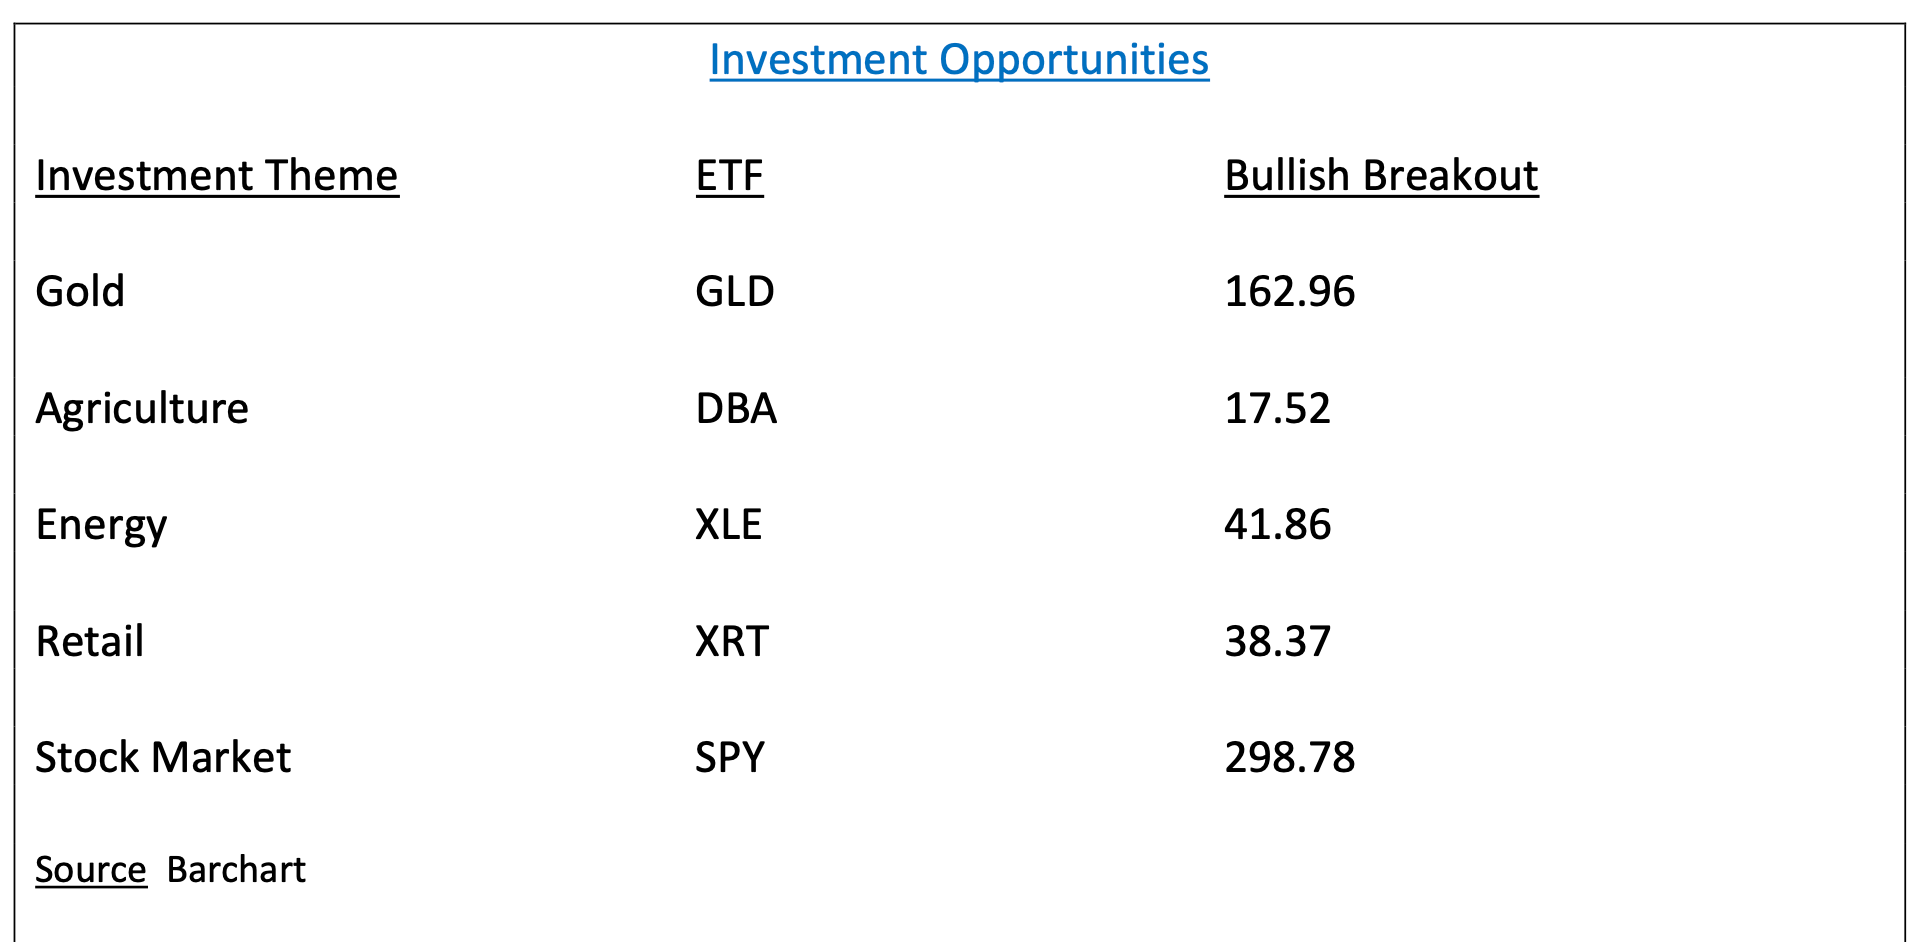
Coronavirus Investment Opportunities
The “silver lining” in a financial crisis is the fact that it creates tremendous investment opportunities. Why? Because most investors make poor decisions in the middle of a global dilemma. They usually liquidate their assets at the worst possible time. Of course, this creates investment opportunities for well-prepared investors.
The coronavirus bear market will definitely unleash a slew of opportunities. Let’s explore a few of these ideas.
GLD
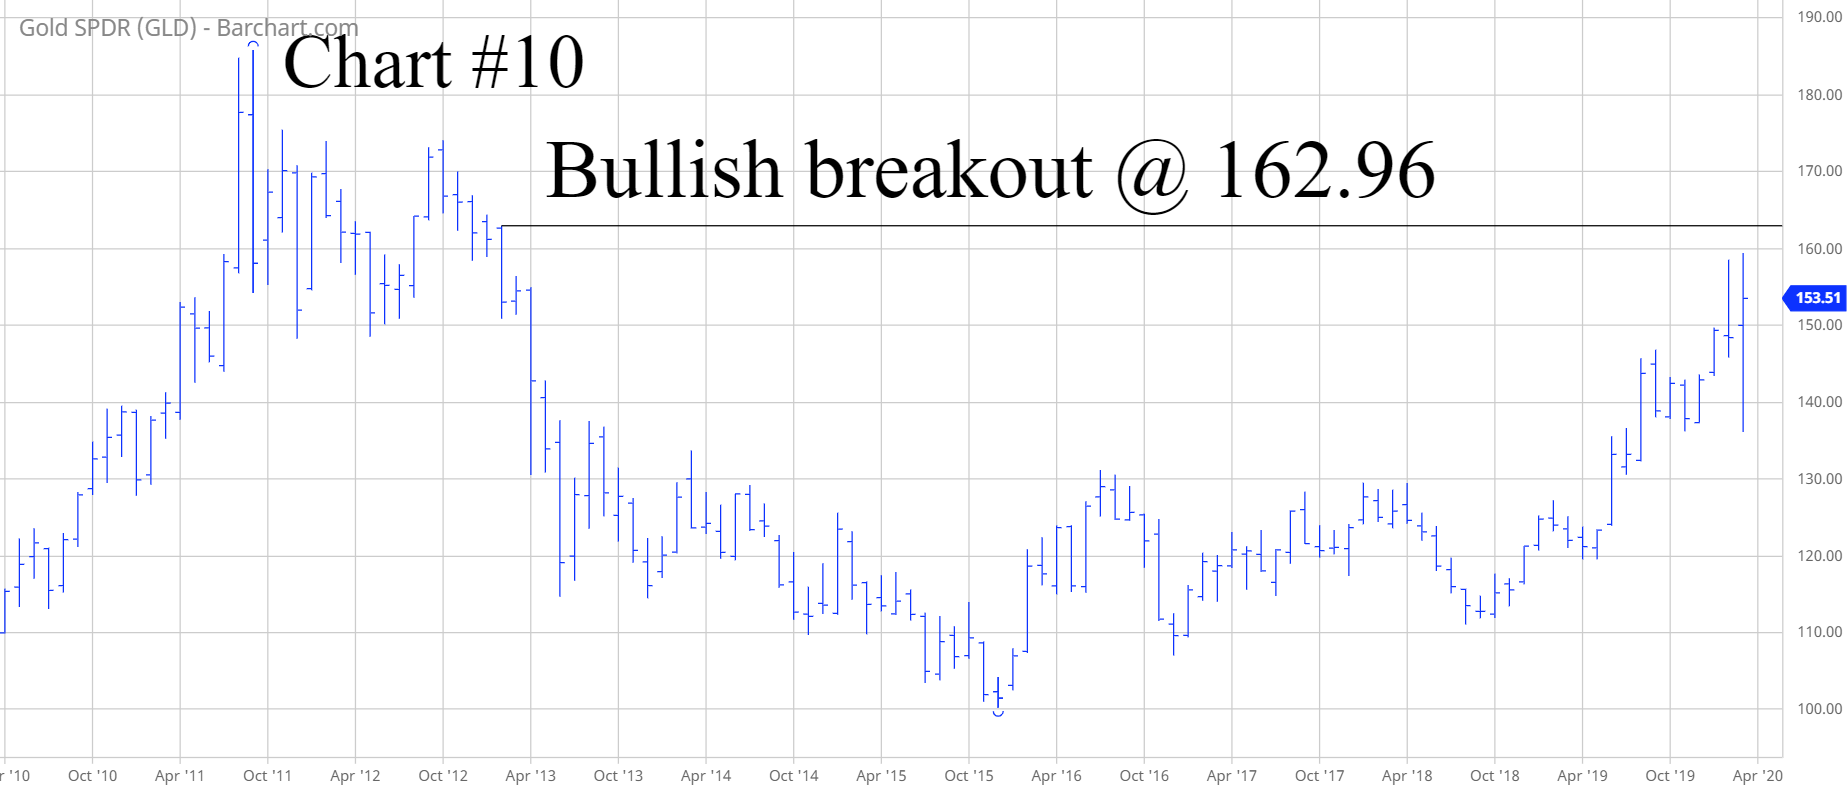
Arguably, the most staggering event that has transpired since the coronavirus invaded our planet has been the insane amount of fiscal and monetary stimuli that has been injected into the global economy. Literally trillions of dollars have been added to central bank balance sheets and government budgets. At some point down the road, these currency units will create a wave of inflationary pressures and currency devaluations. The obvious winner will be the gold market. The easiest way to invest in the yellow metal is to own a gold ETF. GLD is the most liquid gold ETF. The next bullish breakout occurs @ 162.96 (Chart #10).
DBA
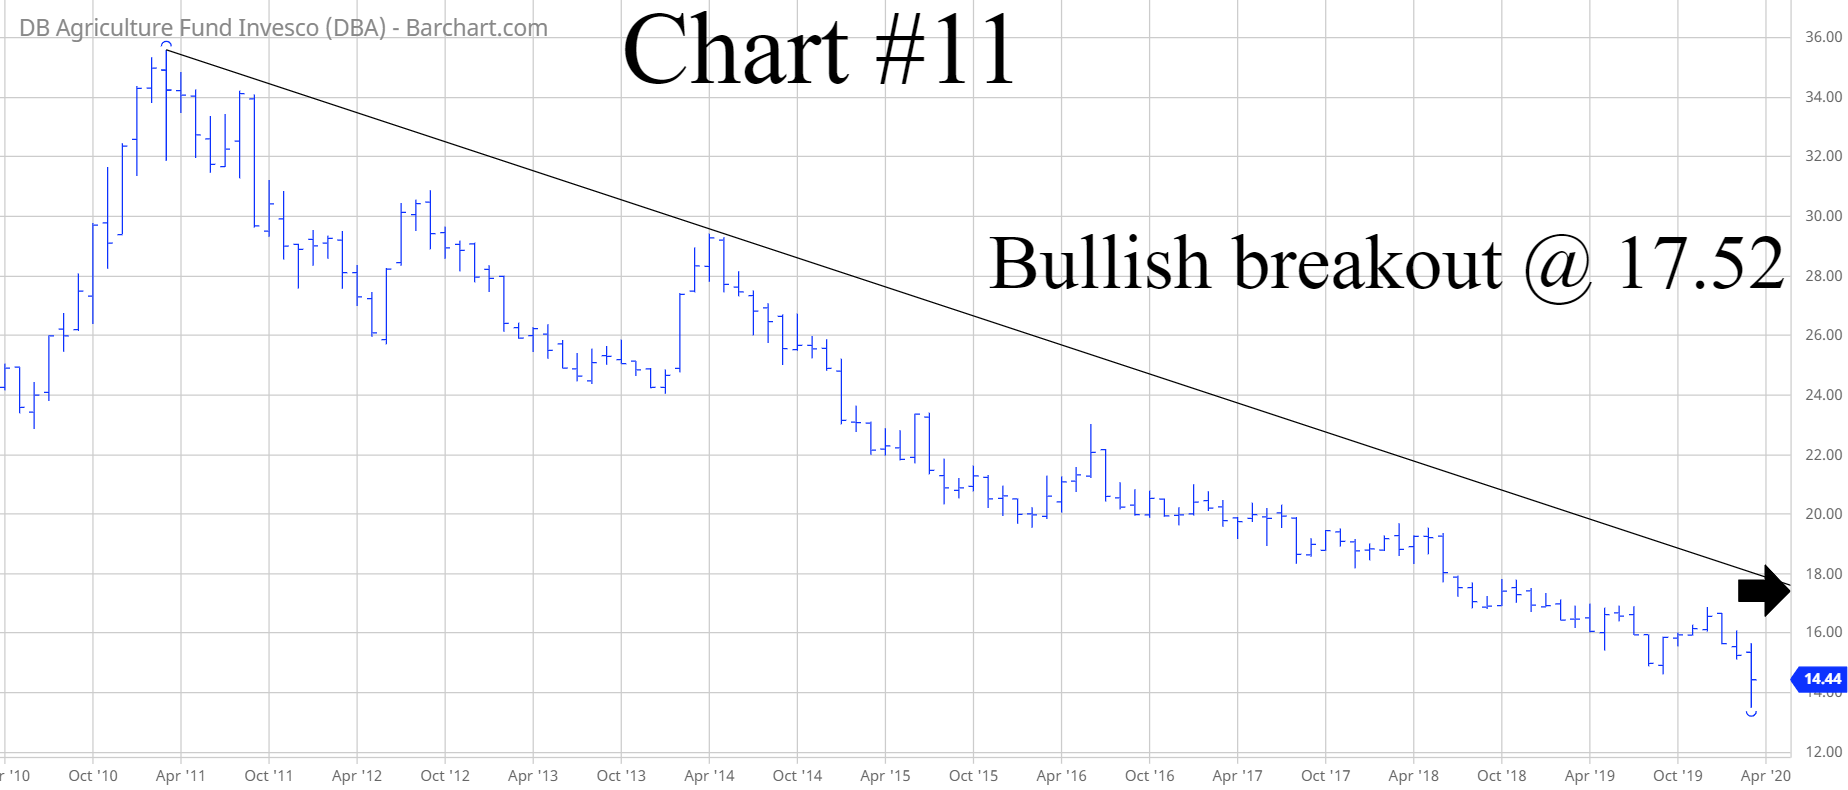
Food and agriculture prices have been in a bear market for almost ten years. Thanks to the creation of massive amounts of stimuli by our government leaders, we can expect a new bull
market in basic food prices. DBA is a pure agriculture ETF which tracks a basket of food and grain commodities. DBA has been in a relentless bear market for the past decade. A bullish breakout will occur @ 17.52. The multi-year downtrend line will be broken @ 17.52 (Chart #11).
XLE
Currently, the energy sector is the most despised component of the S&P 500. It ranks at the bottom of the list among the 11 sectors that comprise the S&P index.
Sectors of the S&P 500 – Annual Return
Information Technology 10.26%
Consumer Staples (5.33%)
Health Care (5.69%)
Communication Services (5.75%)
Utilities (6.77%)
Consumer Discretionary (9.75%)
Real Estate (14.72%)
Financials (15.86%)
Materials (16.63%)
Industrials (17.44%)
Energy (53.56%)
As you can see from the list, the energy sector has lost 53.56% of its value during the past 12 months. It’s easily the worst performing sector.
Wall Street despises all energy stocks. These stocks are completely out of favor within the global investment community. Nobody wants to own energy. Of course, the best time to invest in an asset class is when everyone else is selling. How much lower can the energy sector decline? Probably not much lower.
XLE is an ETF comprised of the largest energy companies in the world. XLE is a great way to gain exposure to the energy industry. XLE has suffered a brutal decline during the past four weeks, as the price of crude oil has collapsed. A bullish breakout occurs @ 41.86
XRT
Prior to the outbreak of the coronavirus, the “brick & mortar” retail industry was in a bear market. A growing number of consumers were choosing to shop at home. Following the outbreak of the virus, retail shopping has completely collapsed. Mall traffic has been virtually non-existent during the past two months.
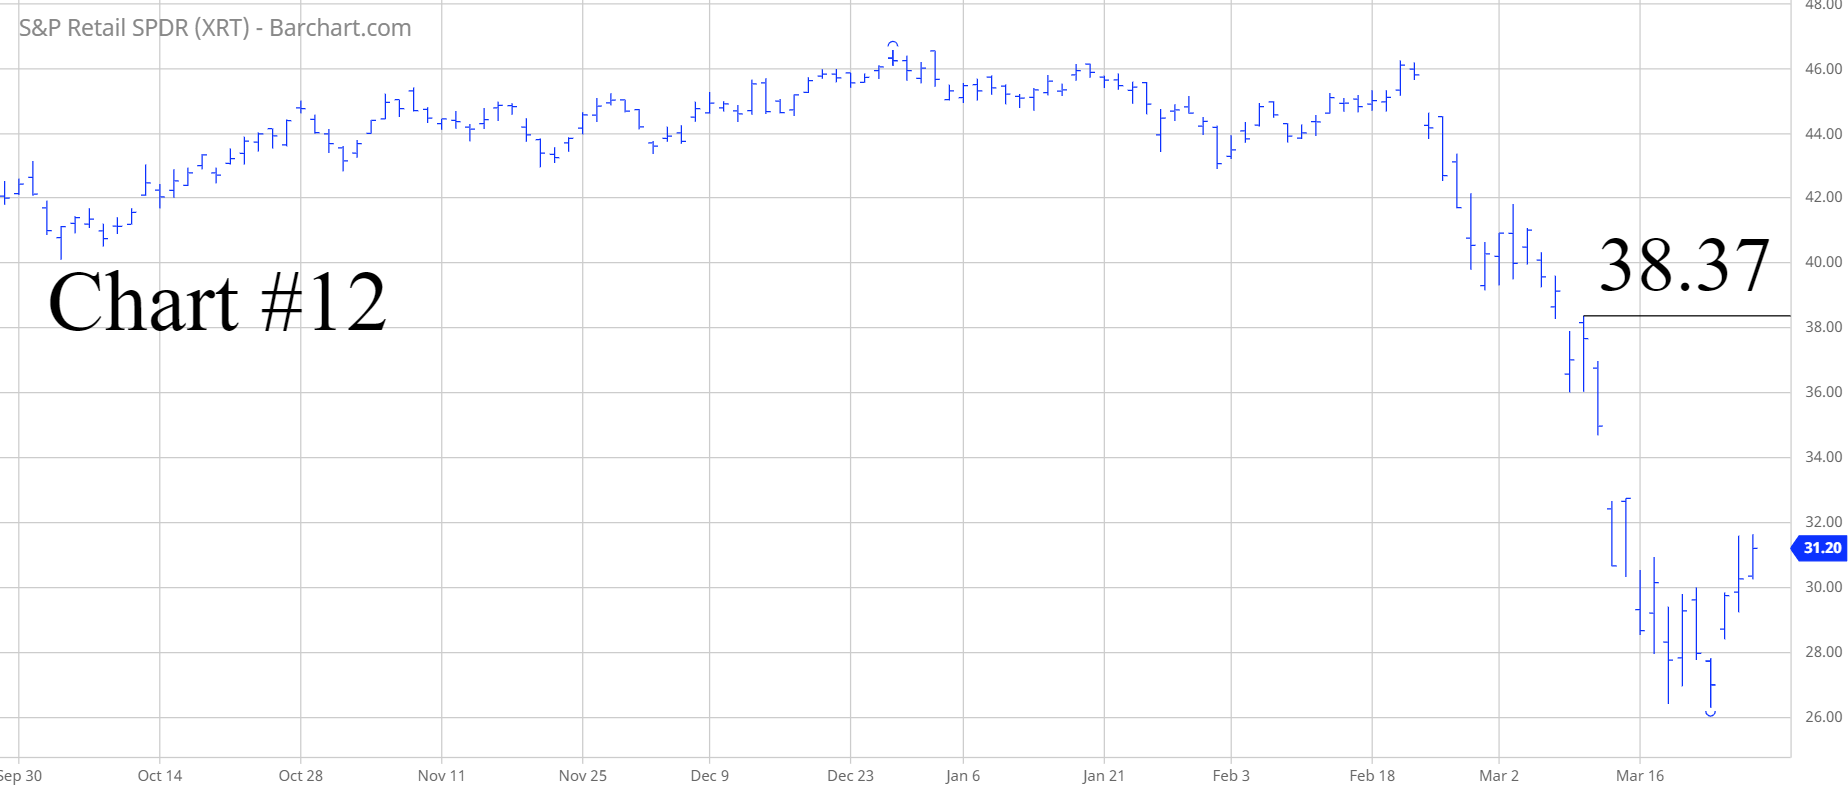
The XRT ETF consists of a diverse group of retail establishments and outdoor shopping centers. Prior to the outbreak of the coronavirus, XRT was performing quite well. In fact, the ETF was trading within 12% of its all-time high. However, during the past eight weeks, XRT has experienced a major reversal to the downside. XRT has lost 27% of its value since 1 February.
The XRT portfolio consists of the highest quality retail establishments in the world. It certainly appears as though investors have overreacted by pushing the value of this ETF well below its intrinsic value. When the virus subsides, consumers will undoubtedly return to their shopping activities. XRT will reap the rewards of government stimuli as consumers spend their newfound wealth on shopping excursions.
Partial List Of XRT Portfolio
- Amazon.com
- Kroger Company
- Tiffany & Company
- Wal-Mart Inc
- eBay Inc
- Dollar Tree Inc
- Etsy Inc
- L Brands Inc
- Best Buy Co Inc
- AutoZone Inc
The XRT chart pattern is currently bearish. A bullish breakout occurs @38.37 (Chart #12).
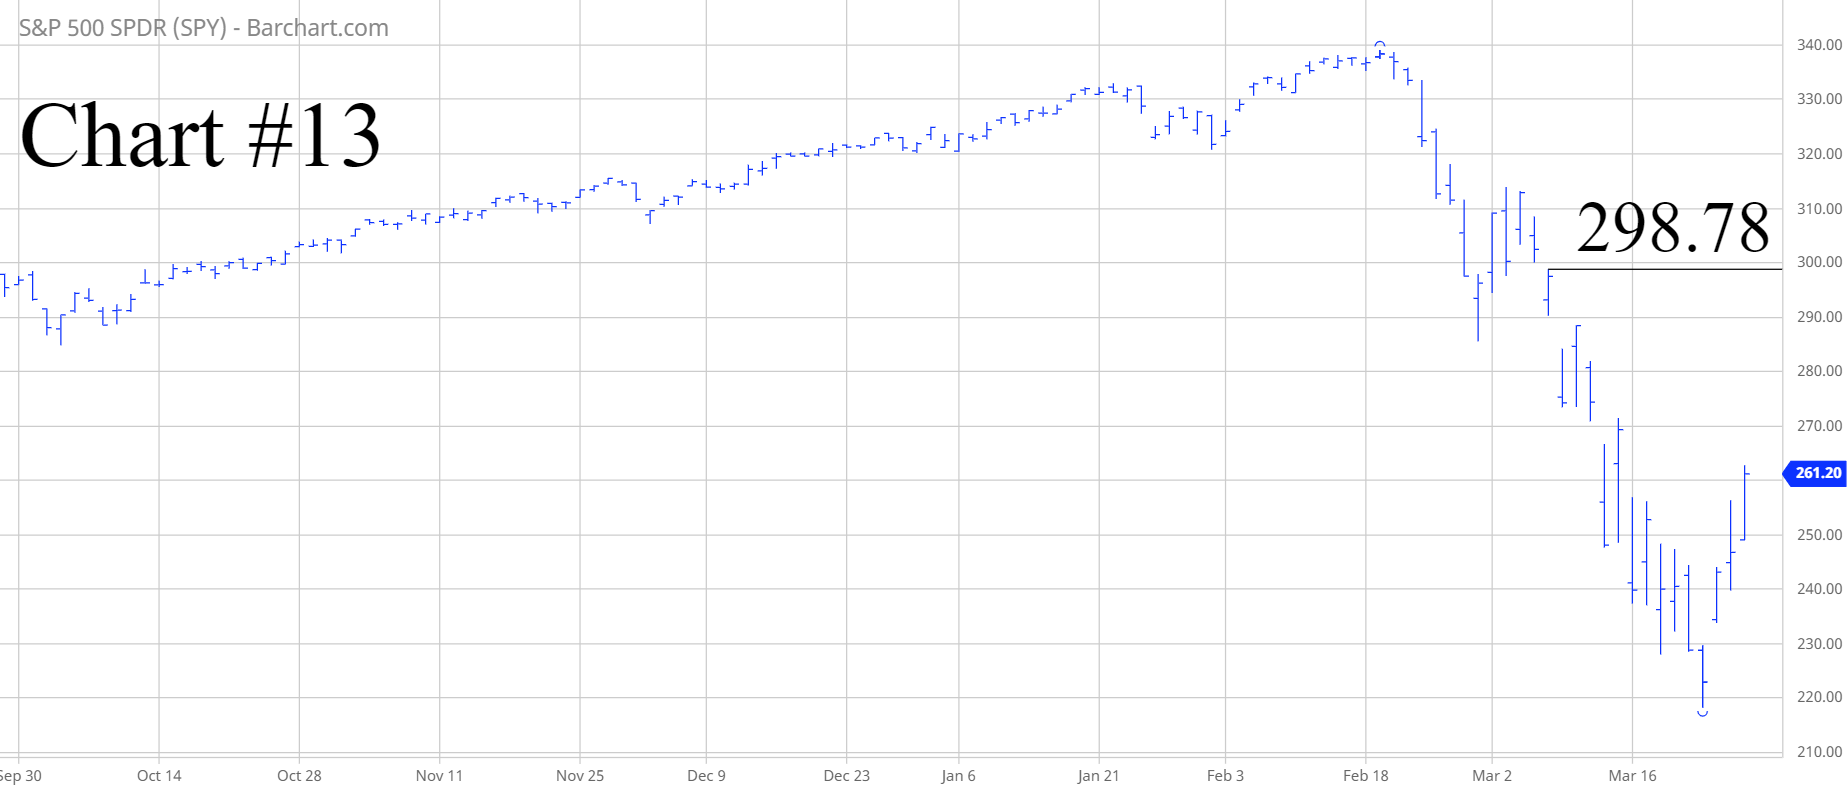
SPY
Within the past six weeks, the global investment community has turned uber bearish. Several analysts are forecasting a depression along with a stock market decline of 60% to 80%. Of course, it’s certainly possible that the coronavirus could unleash another great depression. However, the most likely scenario is a “V shaped” recovery in the world economy and the stock market.
Many investors are underestimating the massive amount of money that has been conjured up by global central banks and government leaders. Trillions of US Dollars, Euros, Yen, British Pounds, Canadian Dollars, Australian Dollars, and Yuan have been pushed into the world banking system. Eventually, the coronavirus will be defeated and the economy will begin functioning again. The one thing that will not disappear is the trillions of currency units added to the financial system. This is explains why a “V shaped” recovery is the most likely outcome.
SPY is an ETF that tracks the performance of the S&P 500 stock index. It is the most heavily traded ETF in the world. SPY is an excellent vehicle for investors who are bullish on the US stock market. The chart pattern is quite bearish. The best course of action is to wait for a bullish breakout @ 298.78 (Chart #13).