

SPDR Dow Jones Industrial Average ETF (DIA)
Key Statistics
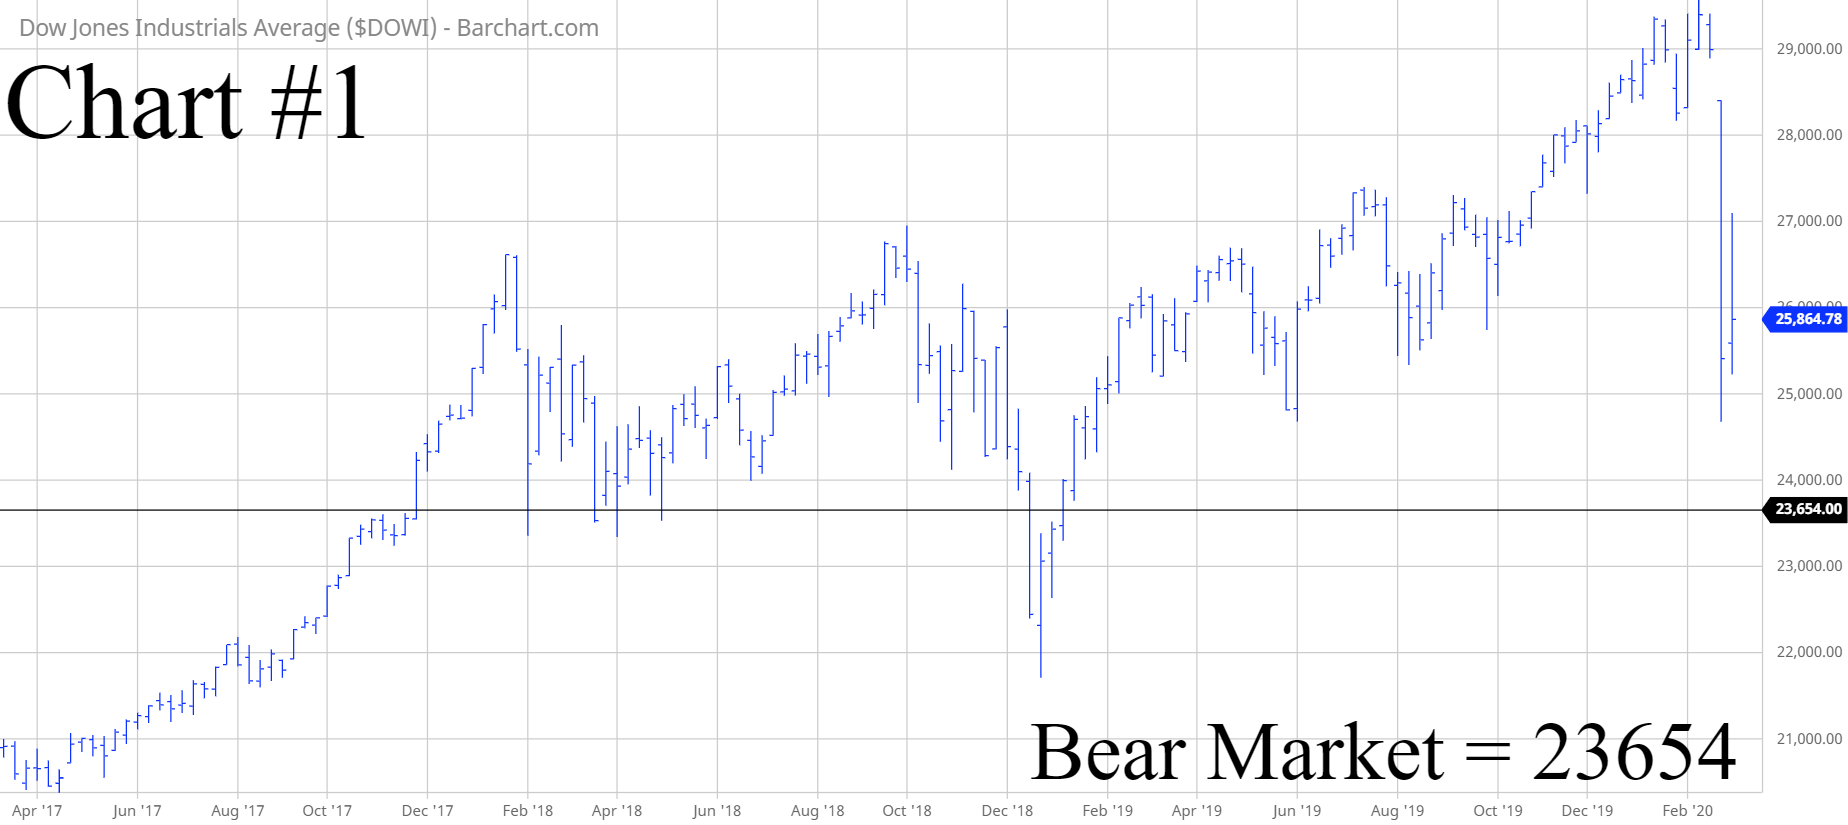
Thank you for reading this post, don't forget to subscribe!Minor Support Level 247.00 Minor Resistance Level 275.31
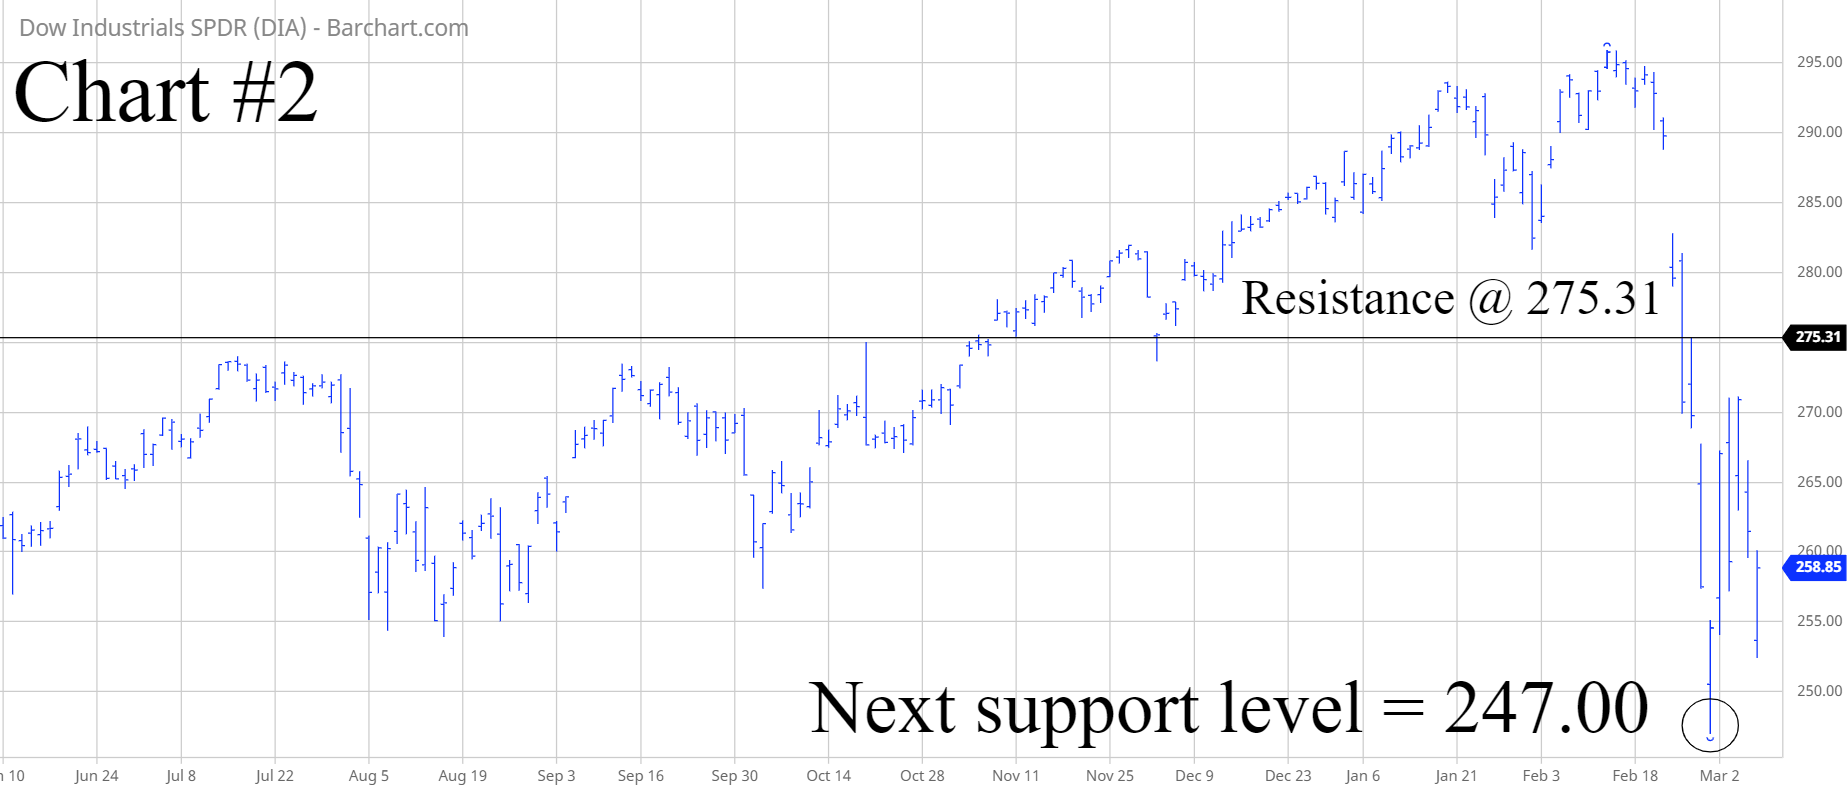
Major Support Level 112.14 Major Resistance Level 289.00
Minor Buy Signal 279.90 Minor Sell Signal 244.13
Major Buy Signal 295.87 Major Sell Signal 101.33
BRIEF OVERVIEW – Dow Jones ETF DIA
9 March will mark 132 months of consecutive bull market activity. We are in the midst of the longest bull market in the history of Wall Street, which dates back to 26 May 1896. However, it appears that this massive winning streak is finally about to end. Will the coronavirus become the “black swan” that pushes the stock market into bear market territory? Let’s examine the details.
The Dow Jones Industrial Average (DJIA) has been in existence since it was launched by Charles Dow and Edward Jones on 26 May 1896. Without question, it is the most popular global stock market index among all major indices. When people discuss the stock market, 99% of the time they are referring to DJIA. The Dow is the only index that has avoided a bear market during the past decade. Both the S&P 500 and the NASDAQ slipped into bear market territory in Q4 2018.
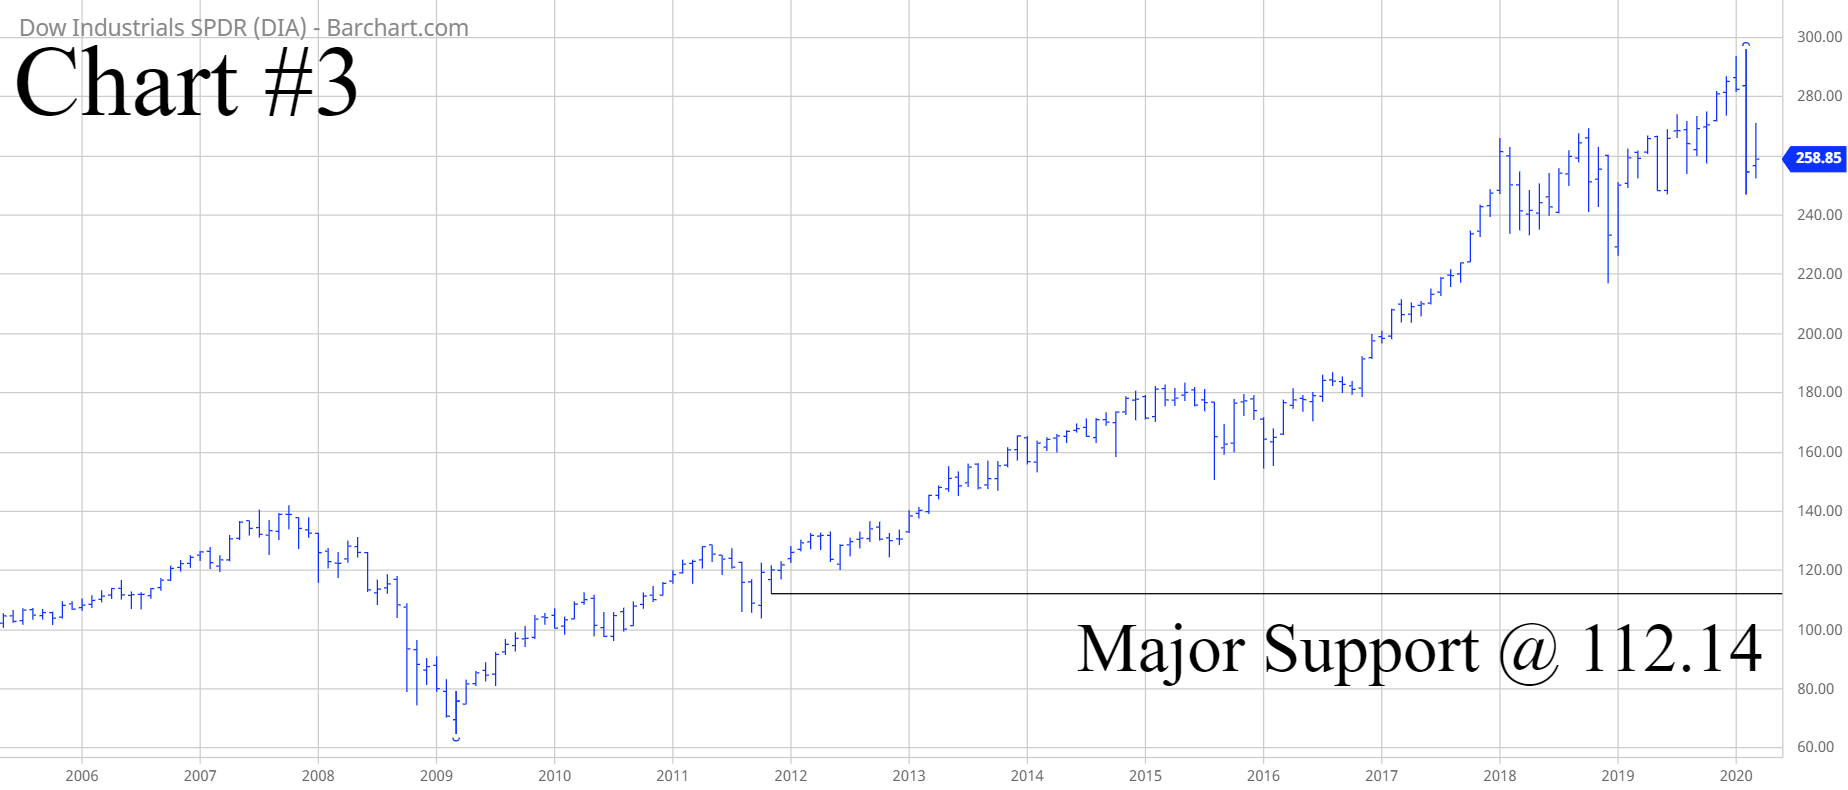
The all-time high for DJIA occurred on 12 February @ 29568. Officially, a bear market occurs when a stock index falls 20% below its all-time high. Therefore, DJIA will enter bear market territory if it drops below 23654. Please review Chart #1.
The SPDR family of exchange traded funds (underwritten by State Street Global Advisors) introduced the Dow Jones Industrial Average ETF on 14 January 1998. The ticker symbol is DIA. This ETF is a perfect vehicle for investors who wish to participate in the performance of DJIA. DIA is an extremely popular ETF, with an average daily volume of nearly six million shares. The ETF is commonly referred to as “Diamonds.”
SHORT-TERM VIEW – Dow Jones ETF DIA
For the first time in several months, the bears are in complete control of the short-term momentum. The next level of support is 247.00. The recent decline has been absolutely brutal. Therefore, the bulls will have a very difficult time recapturing the momentum. The important number for the bulls is a weekly close above 275.31 (highly unlikely).
Based on the Aroon Oscillator, DIA has a moderately oversold reading of -44. The Aroon Oscillator is programmed differently than most stochastic indicators. The oscillator fluctuates between -100 and +100. A reading of 0 would indicate a neutral position. Therefore, a reading of -44 with DIA is considered moderately oversold. However, speculative markets can remain oversold for extended periods of time. Even though the oscillator reading is -44, DIA could easily continue to drift lower.
LONG-TERM VIEW – Dow Jones ETF DIA
As we discussed previously, the stock market has enjoyed 132 months of consecutive bull market activity. However, it certainly appears that the winning streak is on the verge of being interrupted. The coronavirus has forced the entire global economy into a complete standstill. Most likely, the general public is overreacting to the virus. The number of fatalities is relatively small in comparison to the number of infected people. Of course, it’s never a good idea to downplay a global pandemic. Nevertheless, at least for now, it does appear as though there is a bit of an overreaction.
Let’s review the table that was introduced a few weeks ago.
S&P Performance Results
Global Viral Outbreaks
Viral Outbreak Date 6-Month Results 12-Month Results
HIV/AIDS 06/1981 (0.3%) (16.5%)
Pneumonic Plague 09/1994 8.2% 26.3%
SARS 04/2003 14.6% 20.8%
Avian Flu 06/2006 11.7% 18.4%
Dengue Fever 09/2006 6.4% 14.3%
Swine Flu 04/2009 18.7% 36.0%
Cholera 11/2010 13.9% 5.6%
MERS 05/2013 10.7% 18.0%
Ebola 03/2014 5.3% 10.4%
Measles/Rubeola 12/2014 0.2% (0.7%)
Zika 01/2016 12.0% 17.4%
Measles/Rubeola 06/2019 9.8% N/A
Coronavirus 01/2020 N/A N/A
Source Dow Jones Market Data
As we discussed a few weeks ago, global viral outbreaks are rarely responsible for initiating a bear market. In fact, only once during the past 30+ years did a virus-pandemic kickstart a bear market. However, it feels like the coronavirus is different. The reason it feels different is because the previous viral outbreaks had very little effect on North America. In other words, North America was largely shielded from these health-related incidents. Generally, the outbreaks only impacted emerging market countries. The coronavirus is much more global in scale. No country will escape its wrath. This explains why the US stock market will probably suffer a more brutal decline versus previous viral outbreaks.
The stock market pundits from the “doom and gloom” camp are finally enjoying their day in the sun. For the past decade, these permabears have been erroneously forecasting a massive bear market. Of course, they have been completely wrong. However, that doesn’t stop them from continuing to push their bear market agenda. During the past few weeks, they have emerged from the woodwork louder than ever. Based on their predictions, the coronavirus will unleash a multi-year bear market which will cause stock prices to decline by 50% to 70%. Obviously, anything is possible and there certainly is a chance that the “doom and gloom” crowd is correct. Maybe this global pandemic will be the “black swan” event that they have been forecasting since 2009. However, it’s certainly not the most likely scenario. Instead, the most likely scenario is a sharp correction of 20% to 30% followed by a new bull market. Either way, we should know the answer by the end of 2020.
In regard to the long-term momentum, the bulls are still in control of DIA despite the recent sharp decline. It would take a weekly close below 112.14 to push the long-term momentum in favor of the bears. This type of decline is rather unlikely.
SHORT-TERM CHART – Dow Jones ETF DIA
Please review the 6-month chart of DIA (Chart #2). The coronavirus has caused the short-term chart pattern to surrender its bullish position. The bears have the upper hand. The next level of support is 247.00. Based on the extreme nature of the decline, the bulls will have a very difficult time recapturing the momentum. The important number for the bulls is a weekly close above 275.31.
LONG-TERM CHART – Dow Jones ETF DIA
Please review the 15-year chart of DIA (Chart #3). Despite the recent decline, the long-term chart pattern is still bullish. It would take a weekly close below 112.14 to push the momentum in favor of the bears. This type of decline is certainly possible, but not likely.

PLEASE NOTE
For the past few years, the long-term support level for DIA has been listed as 80.96. However, based on the massive bull market rally since 2009, the long-term support level is now listed as 112.14. A decline of 73% would be required in order to penetrate 80.96. It’s unlikely that DIA will ever fall below 80.96. Therefore, it’s useless to include a support level that will probably never be elected. As such, the major support level has been adjusted to 112.14.
