SPDR S&P 500 ETF (SPY)
Key Statistics
Minor Support Level 372.64 Minor Resistance Level 422.81
Thank you for reading this post, don't forget to subscribe!Major Support Level 155.73 Major Resistance Level 438.69
Minor Buy Signal 426.56 Minor Sell Signal 368.27
Major Buy Signal 448.50 Major Sell Signal 139.54
BRIEF OVERVIEW – SPY
“Sell in May and go away” is a popular investment adage, warning stock market investors to liquidate their portfolios in May and reinvest in November. Where did this saying originate from, and more importantly, does it actually work? The “sell in May” proverb emanated in England during the mid-1800s, when merchants, bankers, aristocrats and wealthy families would escape London’s financial district during the summer months and retreat to their country manors. Consequently, trading volume declined and stocks would trade sideways until these investors returned in October.
When Wall Street began to emerge as a popular investment hub in the early 1900s, many investors abandoned London’s financial district and relocated to New York. The “sell in May” strategy eventually became a common theme on Wall Street. However, Wall Street investors added their own twist to this investment theme: “Sell in May and go away. Come back after Labor Day.” Upon becoming a federal holiday in 1894, many people used Labor Day to mark the unofficial end of summer. Families would wrap up their vacations and children would begin a new school year. This is also when stock market volume would begin to increase and traders would return to work.
Does this strategy still work? Is it still a good idea to liquidate your stock portfolio in May and repurchase the portfolio after Labor Day? Most financial historians will argue that these old stock market adages and repetitive price patterns always quit working after it becomes common knowledge within the investment community. In other words, these strategies lose their effectiveness when everyone is buying and selling at the same time. This is particularly true with mechanical trading systems. Thanks to the proliferation of high performance computing dating back to the 1980s, it’s much easier for traders and investors to test various trading methods. During the past few decades, several profitable trading strategies have been discovered for both stocks and commodities. Initially upon their release, these systems and strategies were quite profitable. However, they gradually became less effective as more traders began implementing the methodology. Eventually, the system becomes practically useless due to the excessive number of daily users. Let’s review a recent example of a such an occurrence.
Thomas R DeMark is regarded as one of the greatest technical analysts of the past century. The vast majority of his professional career has revolved around the study of financial markets. In 1982, DeMark founded DeMark Investment Advisory, a research firm designed to provide clients with proprietary trading indicators for stocks, bonds, commodities, forex and precious metals. DeMark quickly became one of the most sought-after technicians within the hedge fund industry. His technical indicators were “light years” ahead of other analysts within his peer group. Over the course of the next few years, DeMark found himself working for some of the largest hedge funds in the world. The list included such names as George Soros, Paul Tudor Jones, Leon Cooperman and Michael Steinhardt.
In 1994, DeMark released a book outlining all of the technical indicators that he had developed over the previous ten years. The name of the book was The New Science of Technical Analysis. DeMark’s book became an overnight success among stock and commodity traders. It was highly praised within the technical analysis community because DeMark provided a detailed description of each indicator, the same indicators that his hedge fund clients were using. Immediately upon releasing the book, Demark embarked on a multi-city book signing tour. It easily became the best-selling investment book for the next two years (1994-95).
By 1995, practically every stock and commodity trader around the globe was using DeMark’s indicators as part of their daily trading strategy. DeMark became so popular that he was offered a weekly time slot on CNBC to discuss his indicators on a real-time basis. In addition to CNBC, DeMark was featured on several other financial shows.
Unfortunately for DeMark, as well as for the investors who were using his strategies, DeMark’s indicators began to lose their ability to accurately forecast the future price direction of stocks and commodities. What happened? Why did Thomas DeMark’s “cutting edge” indicators stop working? Because too many traders and investors were following his methodology. DeMark was known as a “system trader,” which means that his indicators were based on a strict set of trading rules. Therefore, all traders who followed DeMark were receiving the same buy/sell signals in terms of entry price and exit price. If all traders are attempting to enter and exit the market at the same time, everyone will experience poor results. This is precisely what happened to DeMark and the investors who implemented his trading strategy. Ironically, DeMark’s overnight success became his downfall.
DeMark learned a valuable lesson with The New Science of Technical Analysis. He learned that trading strategies quit working when too many people are following the methodology. DeMark no longer shares his proprietary indicators with the general public.
The second half of DeMark’s professional career has been very successful. In 2008, he teamed up with Steven A Cohen and John H Burbank to launch DeMark Analytics LLC. DeMark provides Cohen and Burbank with proprietary trading indicators. Cohen and Burbank use these strategies to manage their multi-billion dollar hedge funds.
What about “sell in May and go away?” Does this strategy still work despite the fact that practically every stock market investor on the planet is familiar with it? Believe it or not, “sell in May” continues to generate profitable results. In fact, the results are actually quite impressive. From 1950 through 2019, the S&P 500 generated an annual return of 7.5% from the November through April time period. The average return from May through October was only 0.3%. This is a huge difference in stock market performance and it verifies the legitimacy of this strategy.
If everybody is familiar with this strategy, why does it still work? Because very few investors actually implement the methodology. How many investors do you know that liquidate their portfolio in May and repurchase the same portfolio in October? Professional money managers would never use this type of approach because it is considered a statistical anomaly. In other words, there is no mathematical formula that can validate its success. Despite the fact that “sell in May” has generated incredibly consistent results during the past eight decades, it’s highly unlikely that investors will ever adopt this strategy. Of course, this means that “sell in May” will probably continue to produce above-average results for the next several decades.
In an effort to provide investors with exposure to the S&P 500, the SPDR family of exchange-traded funds introduced the S&P 500 ETF on 22 January 1993. The ticker symbol is SPY. The ETF allows investors to participate in the S&P 500 without the burden of owning shares of each company within the index. SPY is historically significant because it was the very first exchange-traded fund listed in the United States. SPY is easily the most heavily traded ETF, with daily volume quite often exceeding 100 million shares.
SHORT-TERM VIEW – SPY
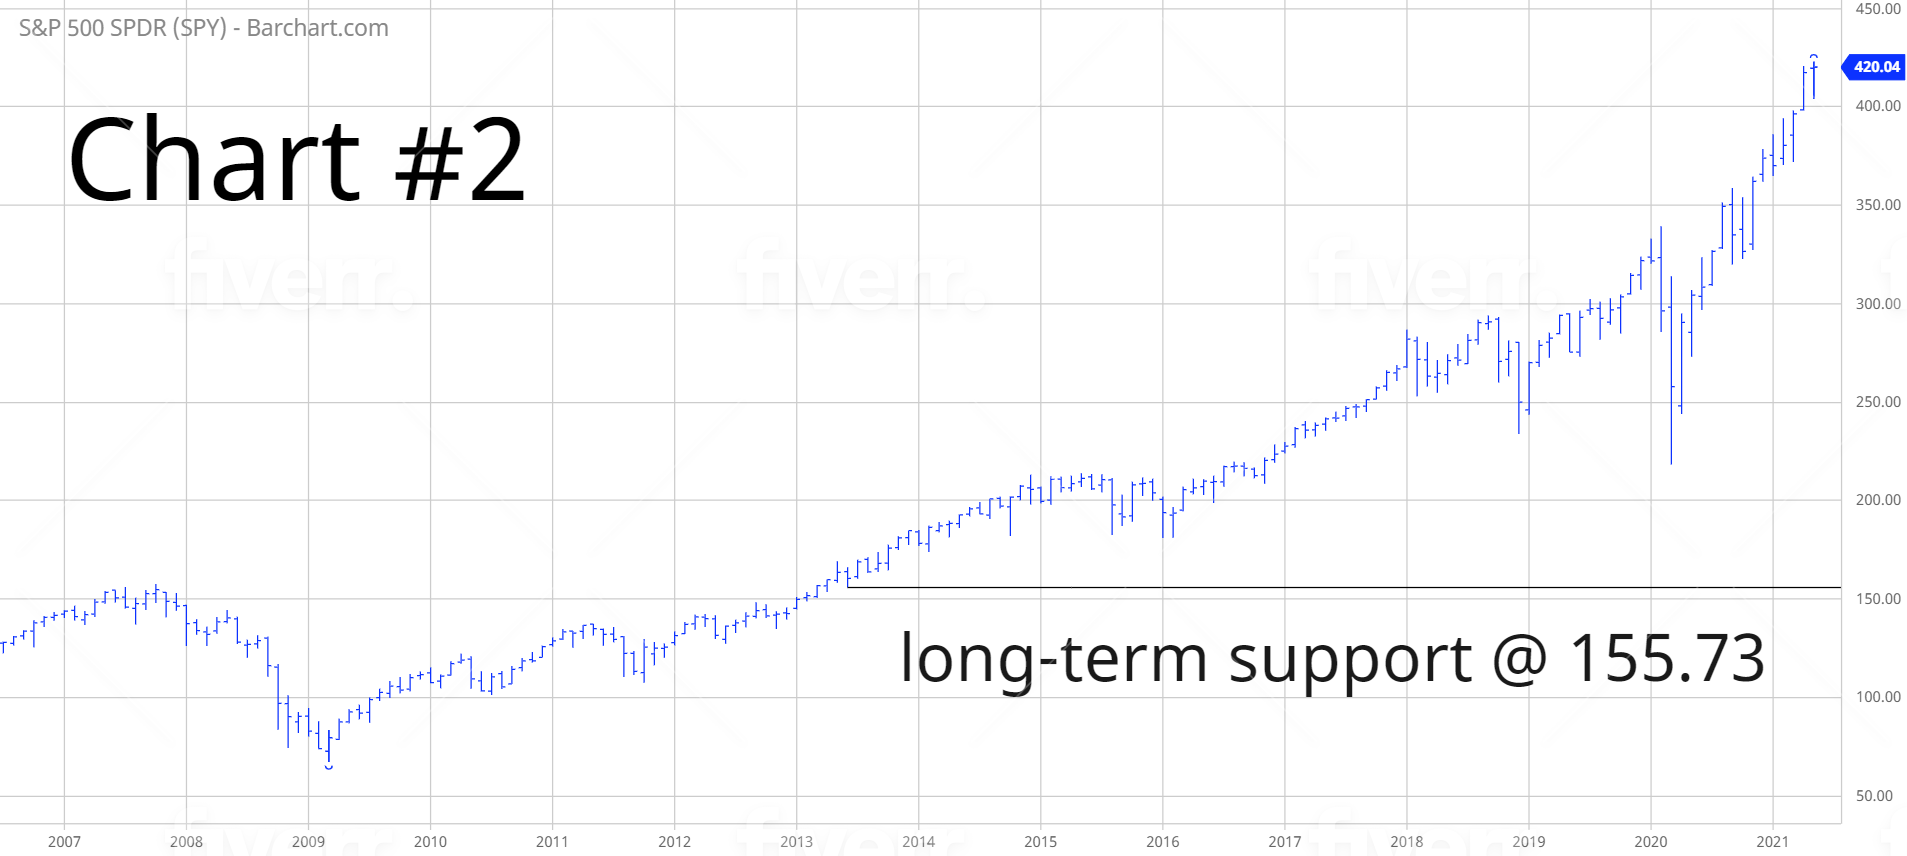
Essentially, SPY has been in a continuous uptrend since the pandemic low in March 2020. There have been a few short-term declines along the way. However, the vast majority of the momentum has been in favor of the bulls. The next level of resistance is 422.81. The bears need a weekly close below 372.64 in order to recapture the momentum.
LONG-TERM VIEW – SPY
Stocks have been trading on Wall Street since the signing of the Buttonwood Agreement on 17 May 1792. During the past few centuries, several adages, proverbs, words of wisdom and stock market folklore have been embraced by traders and investors. As we just discovered with “sell in May,” some of these strategies actually work, even though technology has completely changed the way we invest in the stock market.
In addition to “sell in May,” another popular stock market strategy is the “January effect.” What is the January effect and does it have a successful track record? Let’s examine the details.
The January effect is based on a seasonal anomaly in the stock market whereby the month of January determines the performance of the stock market for the entire year. For example, if the stock market produces a positive rate of return in January, it sets the stage for higher stock prices throughout the remainder of the year. Conversely, if stocks decline during the month of January, it is a precursor for a bear market, at least for the next 11 months.
The January effect was first observed in 1942 by Sidney B Wachtel, an investment banker from Washington state. Throughout his investment career, Wachtel devoted a great deal of his time analyzing the stock market based on statistical research and seasonal trends. Wachtel’s research was quite impressive based on the fact that personal computers would not be available for another 40 years. He conducted all of his research at the local library by accessing old copies of the Wall Street Journal on microfilm.
During his research, Wachtel discovered that the month of January typically sets the tone in the stock market for the remainder of the year. Why does January play such a critical role? Wachtel cited four reasons why this anomaly occurs. Let’s briefly explore each reason.
Tax-loss selling – In an effort to reduce capital gains, many investors will liquidate their losing positions in December and repurchase the shares in January. This type of trading activity will create a collective “bounce” in the stock market during the first few days of the new year.
Professional investors returning to their trading desks after the holidays – It’s not uncommon for Wall Street firms and other professional investors to convert their stock holdings into cash in early-December as they prepare for an extended holiday vacation. Many of these investors will close their books during the first week of December by liquidating all open positions. Consequently, a wave of new money will flow into the stock market in January as these investors begin a new trading year.
Year-end bonus – Many companies have a history of rewarding their employees with an annual bonus, typically paid in the month of December. Originally known as a Christmas bonus, these yearly payments equal approximately 5% of the worker’s annual salary. Wall Street investment firms are known to pay huge bonuses to their employees. These year-end payouts are commensurate with the amount of revenue that each person contributes to the firm’s balance sheet. It’s not uncommon for Wall Street executives to earn 50% of their annual salary in the form of a year-end bonus. A large proportion of these payouts are invested in the stock market during the first few weeks of the new year, thus contributing to the January effect.
Window dressing – Quite often, poorly performing mutual fund managers and investment advisors will make a last ditch effort to improve their annual performance results by eliminating all stocks that are underperforming the broad market. This is known as “window dressing” and it occurs during the final few weeks of the year. Professional money managers are legally required to make publicly available their year-end portfolio holdings. Clients will use these annual reports to decide if they should switch to a new advisor. Of course, money managers are fully aware that their clients will review these reports. By liquidating poorly performing stocks, it increases the likelihood that clients will remain with the advisor. Window dressing contributes to the January effect because it creates selling pressure during the month of December, followed by a bounce in January.
How profitable is the January effect? Does it actually work? Let’s review the numbers. According to data provided by Stock Trader’s Almanac, this indicator works incredibly well. Since 1934, the January effect has accurately forecasted the annual direction of the stock market 85.7% of the time. These results are absolutely amazing and it validates the fact that investors should definitely pay attention to this type of seasonal research.
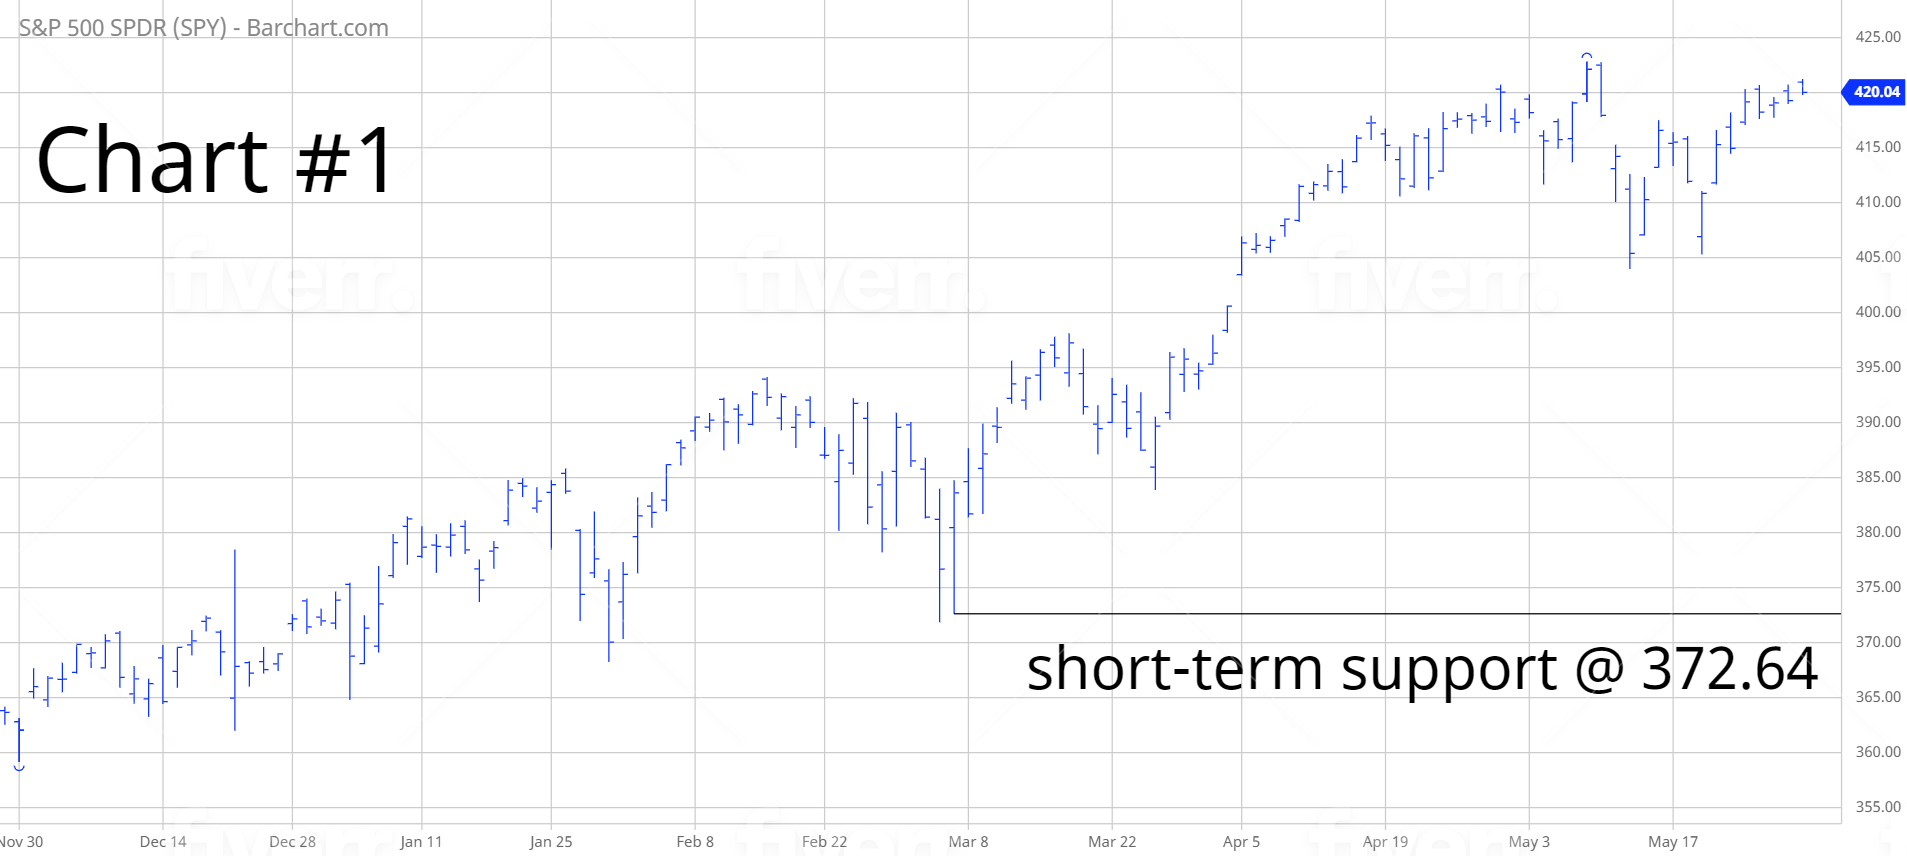
In regard to SPY, the long-term view remains extremely bullish. The next resistance level is 438.69. A weekly close below 155.73 is needed in order to reverse the momentum. It’s highly unlikely that the long-term momentum will turn bearish any time in the near future. Global central banks continue to print unlimited sums of money. As long as the money printing continues, equity prices will drift higher.
SHORT-TERM TREND
Please review the 6-month chart of SPY (Chart #1). SPY remains in bullish territory on a short-term basis. The next level of resistance is 422.81. The chart pattern will remain bullish as long as SPY stays above 372.64 on a weekly closing basis. The most likely scenario is a continuation of higher prices.
LONG-TERM TREND
Please review the 15-year chart of SPY (Chart #2). The long-term chart pattern is clearly in favor of the bulls. The next level of resistance is 438.69. A weekly close below 155.73 is needed to flip the chart into a bearish formation.