SPDR Dow Jones Industrial Average ETF (DIA)
Key Statistics – DIA
Thank you for reading this post, don't forget to subscribe!
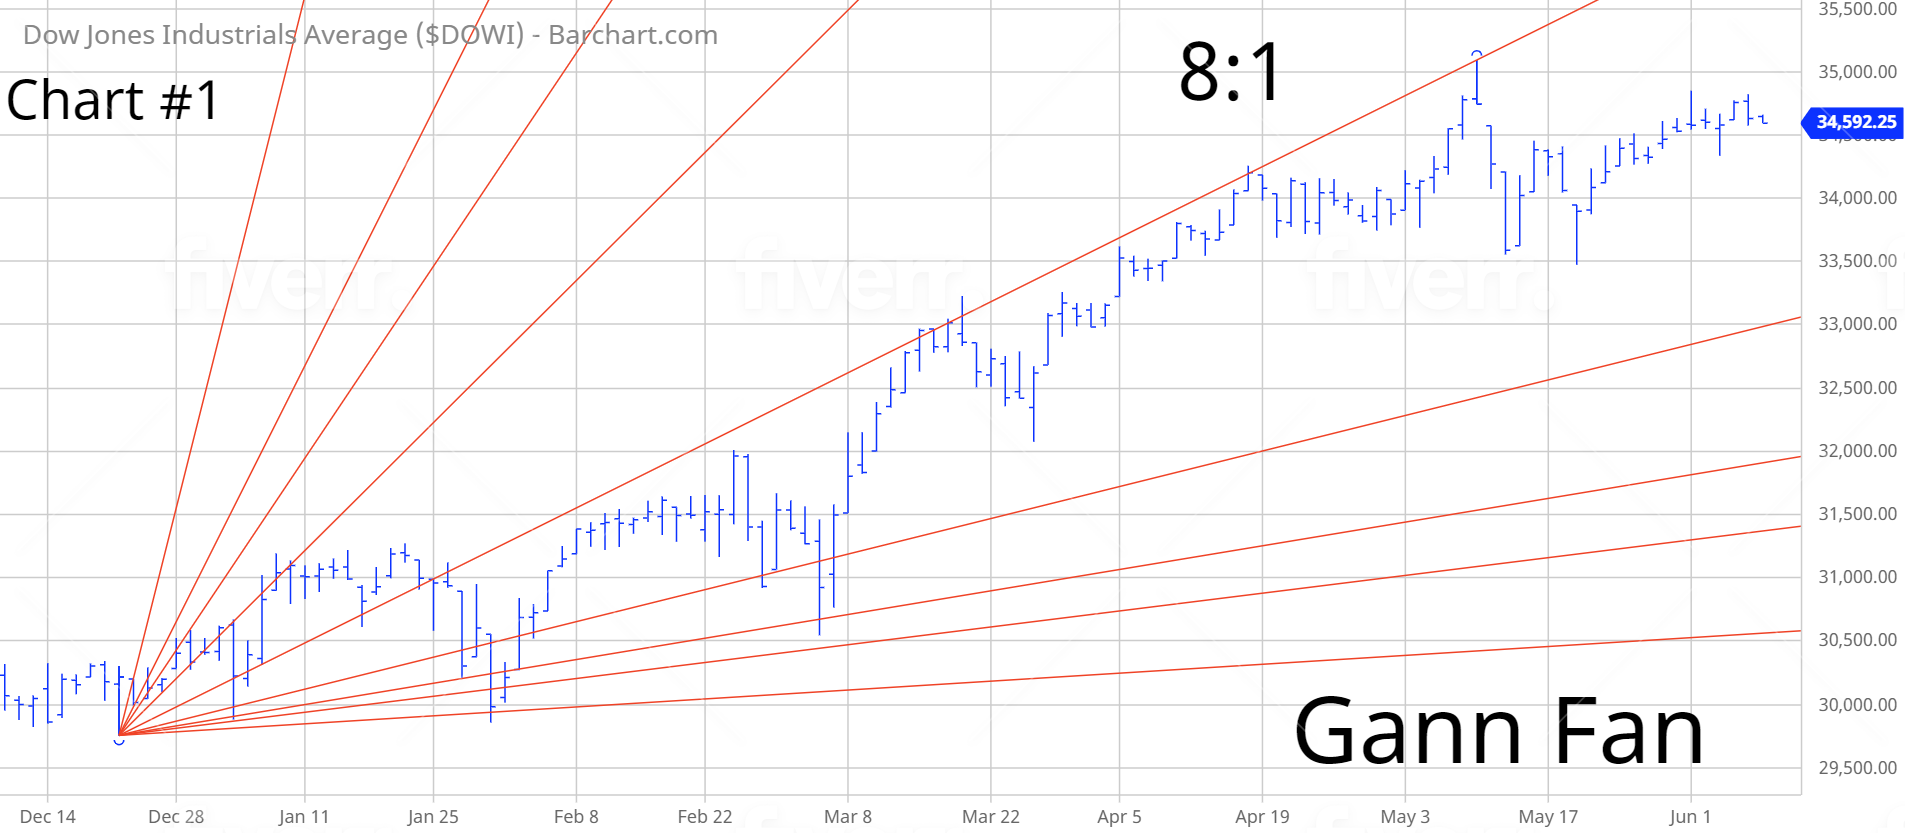
Minor Support Level 305.68 Minor Resistance Level 351.09
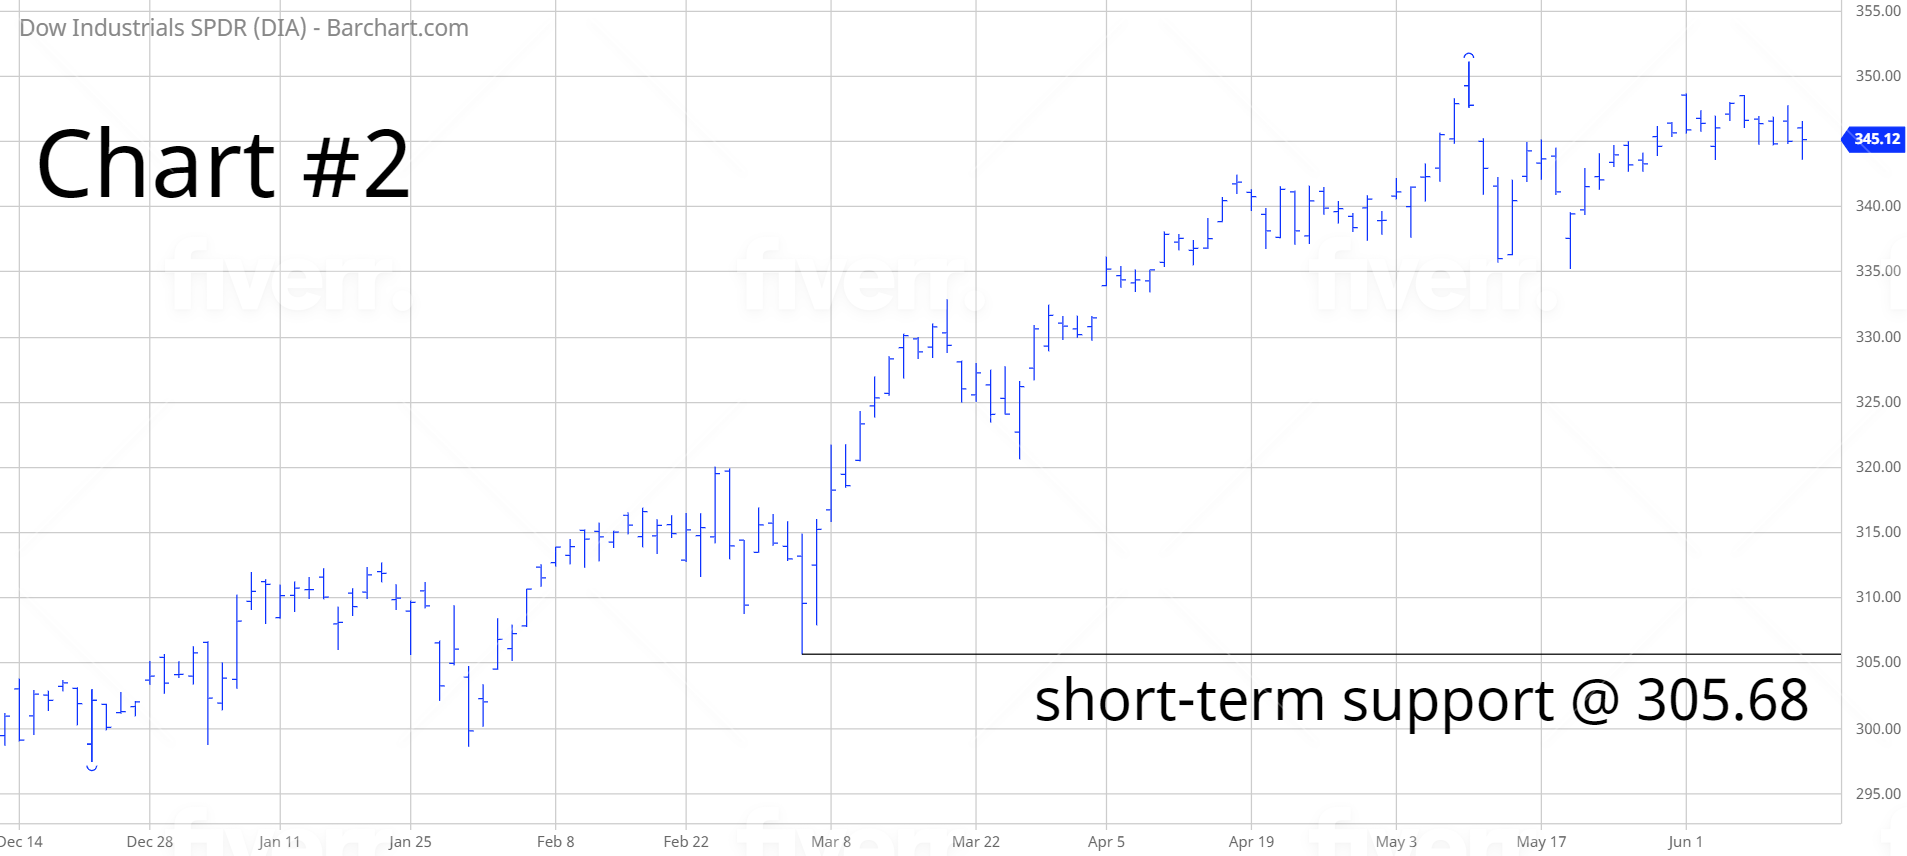
Major Support Level 112.14 Major Resistance Level 366.69
Minor Buy Signal 357.05 Minor Sell Signal 300.14
Major Buy Signal 376.33 Major Sell Signal 101.33
BRIEF OVERVIEW – DIA
Stocks have been trading on Wall Street since the signing of the Buttonwood Agreement on 17 May 1792. Over the course of the past 229 years, investors have encountered a vast array of swindlers, hucksters, charlatans, con artists and fraudsters. Wall Street is filled with stories of naïve investors who were duped out of their life savings by “fast talking” con artists. Without question, one of the most controversial figures in the history of Wall Street was WD Gann. Depending on who you believe, WD Gann was either the greatest stock trader of the 20th century or a “fast talking” con artist who sold his worthless trading system to unsuspecting investors. In reality, the truth probably lies somewhere in the middle. Whatever the case may be, Gann developed several different trading systems and indicators throughout his professional career. Let’s examine a few of Gann’s most popular methodologies.
WD Gann was well versed in several disciplines, including geometry, astronomy, astrology, ancient mathematics along with the study of the Bible. The majority of Gann’s trading systems were based on planetary configurations, geometric formulas and time cycles.
In 1935, Gann published a stock market trading course titled, The Basis of My Forecasting Method. Within the 33-page course, Gann laid out his most profitable trading technique. He was convinced that the future price movement of any asset class could be accurately forecasted based on geometric angles of time versus price. Based on Gann’s research, the ideal balance of time and price is 45 degrees. Gann validated his research by drawing 45 degree angles on weekly price charts. Several Wall Street traders began using Gann’s methodology with great success. His trading method became known as Gann Angles.
Gann developed a total of nine different Gann angles based on his original concept that the ideal balance of time and price is 45 degrees. Each angle measured a unit of time and price. Gann used the following combinations of time and price:
- 1:1 – one unit of price for one unit of time
- 2:1 – two units of price for one unit of time
- 3:1 – three units of price for one unit of time
- 4:1 – four units of price for one unit of time
- 8:1 – eight units of price for one unit of time
- 1:2 – one unit of price for two units of time
- 1:3 – one unit of price for three units of time
- 1:4 – one unit of price for four units of time
- 1:8 – one unit of price for eight units of time
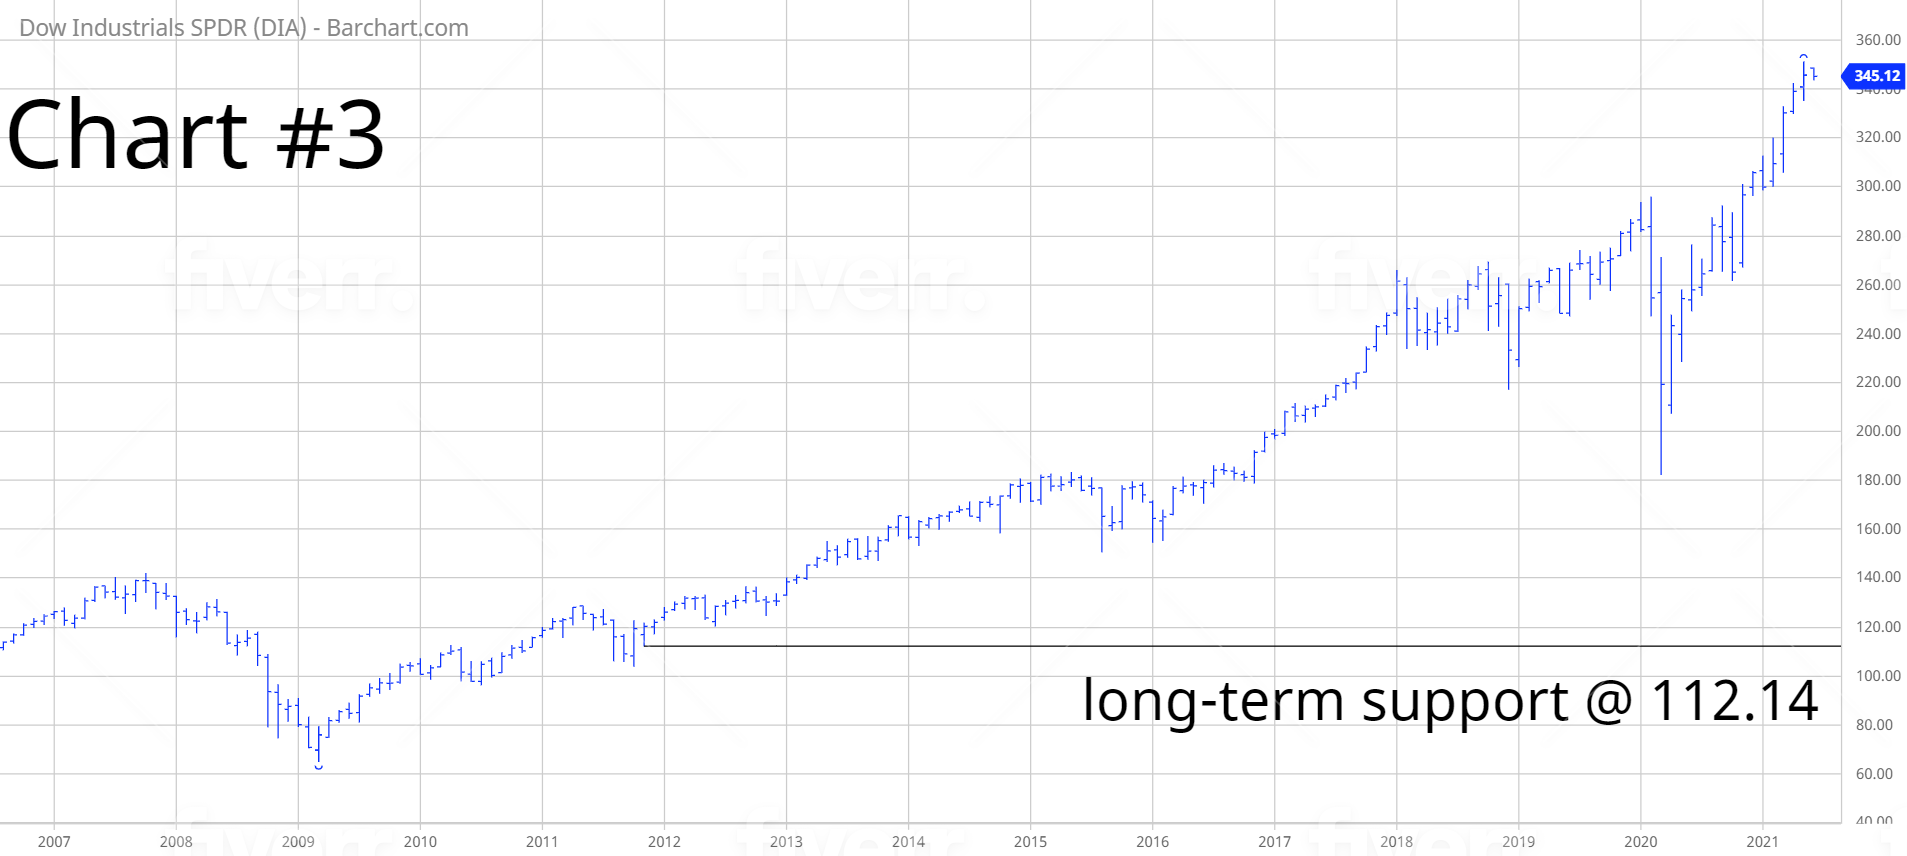
These nine angles became known as a Gann Fan. This methodology became incredibly popular with stock market traders throughout the 1940s and 1950s. Even today, Gann fans are included in most chart subscription services. As an example, please review Chart #1. This chart represents six months of trading activity for the Dow Jones Industrial Average (DJIA). The Gann Fan is applied to the chart. The base of the fan is located at 29,755.53, which represents the 6-month low on 21 December 2020. As you can see from the chart, the 8:1 Gann Angle has served as a formidable level of resistance. In fact, DJIA has managed to close above the resistance level only one time during the past six months. It’s amazing that Gann’s methods continue to work, almost 100 years after the original publication.
The SPDR family of exchange traded funds (managed by State Street Global Advisors) introduced the Dow Jones Industrial Average ETF on 14 January 1998. The ticker symbol is DIA. This ETF is a perfect vehicle for investors who wish to participate in the performance of DJIA. DIA is an extremely popular ETF, with an average daily volume of nearly six million shares. The ETF is commonly referred to as “Diamonds.”
SHORT-TERM VIEW – DIA
DIA remains in bullish territory on a short-term basis. The next level of resistance is 351.09. In order to recapture the momentum, the bears need a weekly close below 305.68. The most likely scenario is a continuation of higher prices.
Based on the Aroon Oscillator, DIA has a neutral reading of -28. The Aroon Oscillator is programmed differently than most stochastic indicators. The oscillator fluctuates between -100 and +100. A reading of 0 would indicate a neutral position. Therefore, a reading of -28 is considered fairly neutral. Based on the current level of the oscillator, the next big move could be in either direction. The most likely direction is a breakout to the upside.
LONG-TERM VIEW – DIA
Throughout the 1930s and 1940s, WD Gann gained a reputation as a very successful stock and commodity trader. As we discussed, the majority of Gann’s success was attributed to his research in the areas of geometry, astronomy, astrology and ancient mathematics. However, many people are not aware that Gann devoted a substantial amount of his time studying repetitive cycles. Near the end of his professional career, and even after his death in 1955, several of Gann’s former students discovered that Gann had completed a great deal of research concerning long-term stock market cycles. Gann was a meticulous record keeper. Therefore, the students were able to recreate Gann’s research by examining his notes and records. Gann discovered several stock market cycles that are still used today by many traders and investors. Let’s examine the cycles.
90-year cycle – The most recent 90-year cycle low occurred in July 1932. Ideally, the next cycle low will occur in 2022. The range is 2021 through 2037. Therefore, the 90-year cycle low could potentially occur any time between 2021 and 2037.
72-year cycle – This long-term cycle is bullish for the next few decades. The most recent 72-year cycle low was completed in March 2009, following the Global Financial Crisis. The cycle low is not due until 2081.
36-year cycle – Important lows occurred in 1932, 1974 and 2009. The next low is due in 2045. Therefore, the cycle peak should unfold in 2027.
18-year cycle – Stock market cycles are not perfect. Occasionally, a cycle will expand or contract, thus arriving outside of the expected time band. It appears that the 18-year cycle expanded in 2018. The cycle low arrived perfectly in March 2009. Therefore, the cycle peak should have unfolded in 2018. However, the peak actually occurred in February 2020, just prior to the global pandemic. Based on the fact that the cycle peak took place in 2020, we can expect the cycle low to appear in 2029.
4-year cycle – This cycle is also known as the Presidential cycle, made famous by Yale Hirsch, the original creator of Stock Trader’s Almanac. The most recent 4-year cycle low arrived right on time during the final year of Trump’s presidency in March 2020. The next cycle low should transpire near the end of Biden’s term in mid-2024. Therefore, the peak should materialize in mid-2022.
50-week cycle – The most recent 50-week cycle low unfolded perfectly during the third week of March 2020. Ideally, the next low should have occurred during the week of 8 March 2021. However, most Gann experts agree that the low arrived early on 25 January. Therefore, the peak should occur during the week of 26 July.
With the exception of the 90-year cycle, the majority of the long-term cycles are bullish for the next decade. Despite the massive stock market rally over the course of the past several years, Gann experts are convinced that stocks will grind higher for the remainder of the 2020s.
In regard to DIA, the long-term view remains extremely bullish. The next resistance level is 366.69. A weekly close below 112.14 is needed in order to reverse the momentum. It’s highly unlikely that the long-term momentum will turn bearish any time in the near future. However, if global central banks begin to lose control of their money printing apparatus, the bull market could begin to unravel very quickly.
SHORT-TERM TREND
Please review the 6-month chart of DIA (Chart #2). DIA remains in bullish territory on a short-term basis. The next level of resistance is 351.09. The chart pattern will remain bullish as long as DIA stays above 305.68 on a weekly closing basis. The most likely scenario is a continuation of higher prices.
LONG-TERM TREND
Please review the 15-year chart of DIA (Chart #3). The long-term chart pattern continues to remain extremely bullish. The next level of resistance is 366.69. A weekly close below 112.14 is needed to flip the chart into a bearish formation.