iShares Silver Trust (SLV)
Key Statistics
Thank you for reading this post, don't forget to subscribe!
Minor Support Level 21.93 Minor Resistance Level 26.28
Major Support Level 10.20 Major Resistance Level 31.05
Minor Buy Signal 26.75 Minor Sell Signal 21.17
Major Buy Signal 34.64 Major Sell Signal 8.45
BRIEF OVERVIEW – SLV
When investors discuss the topic of precious metals, they invariably focus their attention on gold. After all, gold has played a significant role in our nation’s monetary history. For example, the United States adopted a gold standard in July 1944, with the signing of the Bretton Woods Agreement, a post-World War II program designed to stimulate economic activity between participating nations. Essentially, the agreement established rules for trade relations between the United States, Canada Western Europe, Australia and Japan. Gold was used as a mechanism to support fair and equitable exchange rates in an effort to manage the trading of goods and services among member nations. The US Dollar was selected as the primary settlement currency within the Bretton Woods Agreement. Consequently, the Dollar was linked to gold for the purpose maintaining a pre-determined forex trading band between countries.
Despite the fact that the agreement was dissolved in August 1971, it was considered to be quite successful in expanding international trade between the United States and participating countries. In terms of the gold market, the Bretton Woods Agreement will forever portray the yellow metal as an important monetary metal in our nation’s financial history. Investors have always maintained a special affinity to gold. The Bretton Woods Agreement definitely solidified gold as an important asset class. Although gold has played an important role in providing economic stability to several G20 nations, most investors are unaware that gold was not the preferred choice in terms of store of value and medium of exchange. Historical records clearly point to the fact that silver was the original store of value for most nations and imperial dynasties, particularly in the United States. Let’s review the details.
The history of silver as a form of money can be traced back to 600 BC, in modern-day Turkey. It has been used as money in every major empire, including the Greeks, Romans and Spanish. In regard to the United States, silver officially became a form of money on 4 March 1789, when our nation’s first Congress convened to sign the Declaration of Independence. Silver was mandated as “legal tender” under article 1, section 10. Congress was given the power to coin money. The money was issued in the form of silver coins, which could be used to, “satisfy all debts, both public and private.”
The Coinage Act of 1792 established the first mint in the United States, located in Philadelphia, PA. In addition to establishing the first mint, the Coinage Act authorized the silver dollar as the country’s official unit of money. The half dollar, quarter dollar, dime and half dime joined the silver dollar in serving as a payment method for consumers and businesses.
Throughout the next 150 years, the US Mint introduced several new coins of various denominations. The list includes: mercury dime, Jefferson nickel, Washington quarter, Kennedy half dollar, Morgan silver dollar and Roosevelt dime, just to name a few. By examining the monetary history of the United States, we can clearly see that the citizens of the United States, along with their elected officials, had an affinity to silver in terms of its role as a monetary metal. Even though silver’s role as a unit of money has been substantially reduced during the past several decades, investors are still enamored with Ag, particularly as a store of value.
The iShares family of exchange traded funds (managed by BlackRock) introduced the iShares Silver Trust on 21 April 2006, using the ticker symbol is SLV. This investment vehicle is not a standard ETF as defined by the Investment Company Act of 1940. Therefore, the trust is not registered with the Securities and Exchange Commission (SEC), nor is the trust registered as a commodity pool operator with the Commodity Futures Trading Commission (CFTC). Instead, SLV is a statutory trust registered in the state of Delaware for the purpose of issuing and redeeming shares on behalf of investors. The trustee of SLV is Bank of New York Mellon. The custodian is JPMorgan Chase Bank, N.A. SLV is a perfect vehicle for investors who are searching for “pure play” exposure to physical silver.
SHORT-TERM VIEW
The short-term view of SLV is basically neutral. The next level of resistance is 26.28. In order to recapture the momentum, the bears need a weekly close below 21.93. The most likely scenario is a continuation of higher prices.
LONG-TERM VIEW
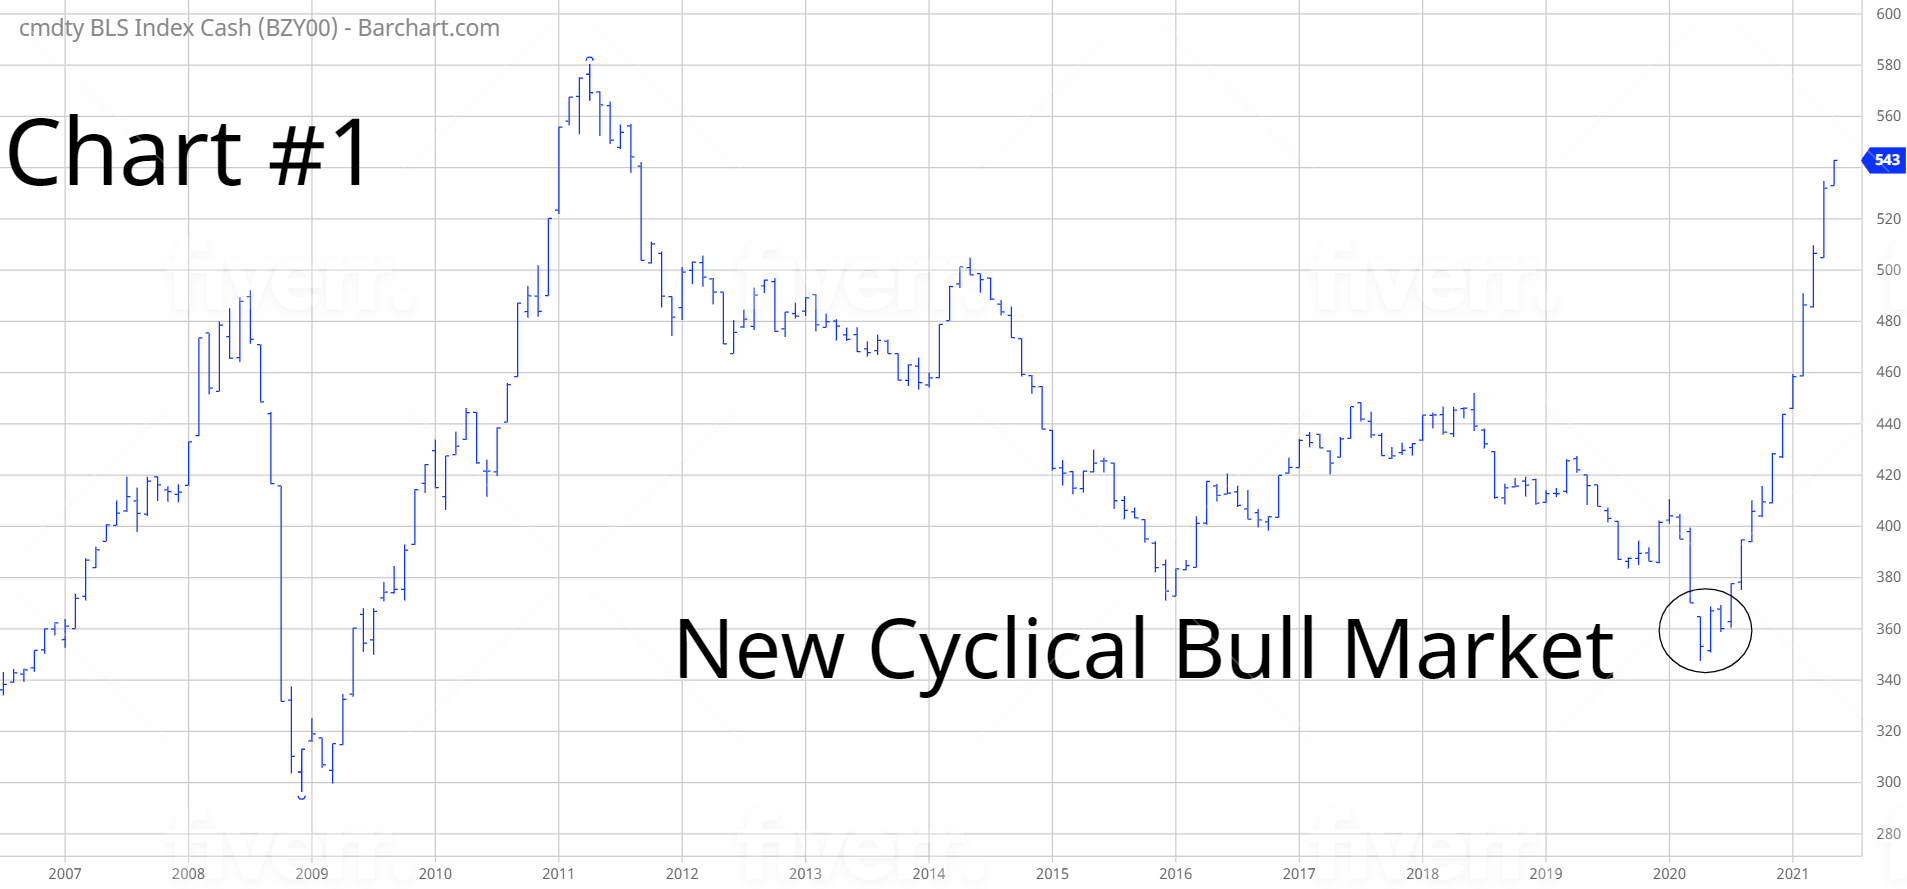
The commodity universe officially entered a new cyclical bull market in April 2020 (Chart #1). During the past 13 months, several commodities have recorded multi-year highs or new all-time highs. Even though silver has enjoyed a substantial rally following the pandemic low, it has been unable to generate a long-term bullish breakout @ 32.14 (Chart #2). However, it’s not uncommon for silver to underperform other commodities during the initial phase of a new bull market. Based on previous commodity bull market cycles, silver has a tendency to lag behind other markets within its peer group. Despite its slow start, silver has a propensity to substantially outperform other commodities during the latter stages of a bull market. The critical number to watch is 32.14. A weekly close above this important resistance level is the catalyst for much higher prices.

Throughout the past few decades, silver has been burdened with poor fundamentals. Miners have been known to flood the market with large quantities of silver. Each time the market would generate a bullish breakout, miners would immediately push the price lower by forward selling large quantities of physical product. Consequently, rallies in the silver market were always short-lived. This explains why silver rarely participated in the early phases of a new commodity bull market cycle.
Since 2011, the fundamental picture for silver has been steadily improving. Miners have found it increasingly difficult to locate new cost-effective silver deposits. The majority of silver mines that have been discovered during the past decade are positioned well below the earth’s surface. Many of these mines are simply not profitable based on the long-term average price. This has resulted in a persistent decline of silver dating back to the 2010s. Please review the following table.
Silver Supply And Demand
2011 – 2020
Year Total Supply Total Demand Balance Price
2011 1,009.7 1,045.4 (35.7) 35.12
2012 1,012.4 983.5 28.9 31.15
2013 1,034.7 1,068.9 (34.2) 23.79
2014 1,064.2 1,021.6 42.6 19.08
2015 1,062.6 1,067.0 (4.4) 15.68
2016 1,057.8 995.5 62.3 17.14
2017 1,032.2 953.7 67.5 17.05
2018 1,016.8 988.3 28.5 15.71
2019 1,023.8 991.8 31.3 16.21
2020 978.1 963.4 14.7 15.70
Source Metals Focus | Million ounces
As you can see from the table, the annual global supply of silver has been steadily declining for the past decade. In 2020, the supply of silver fell to its lowest level since 2009. The total demand for silver in 2020 was 963.4 million ounces. However, this number does not include investments in exchange-traded products (ETP). In 2020, individual and institutional investors purchased 331.1 million ounces of silver ETPs. This represented the largest annual purchase since ETP data was first released in 2006. If we add total demand and ETP investments (963.4 + 331.1) for 2020, there is a huge silver deficit. In other words, silver demand (1,294.5) substantially outpaced silver supply (978.1) in 2020.
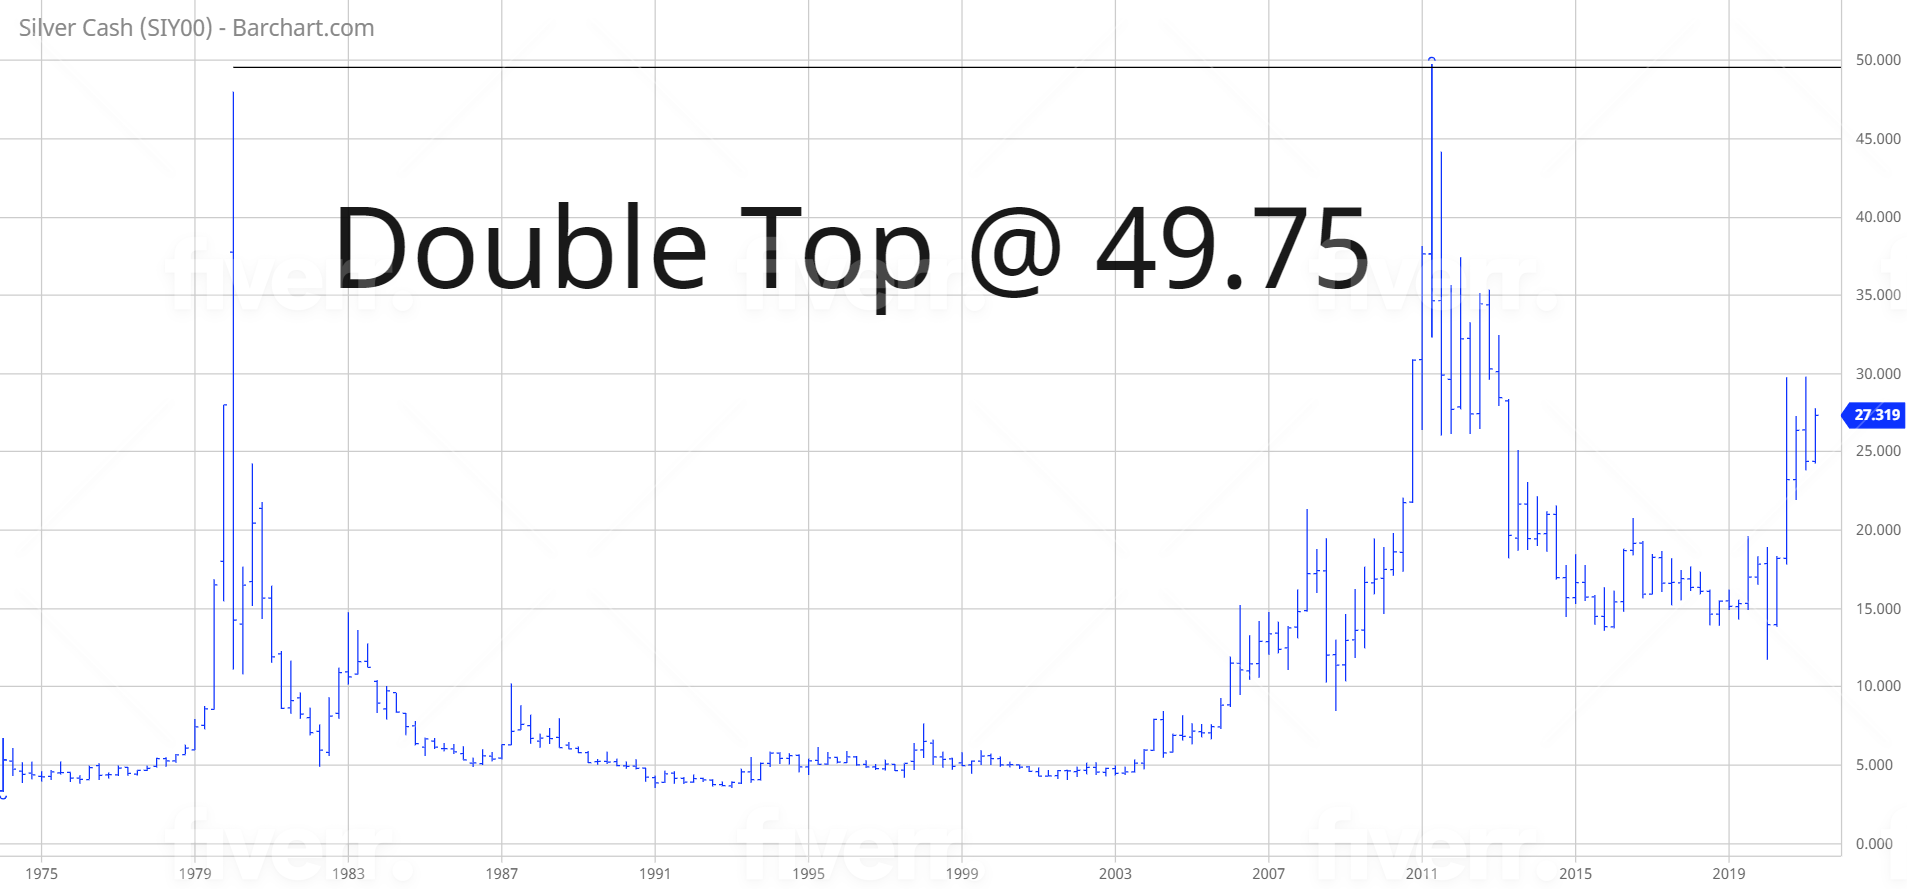
Arguably, the commodity with the most bullish chart pattern is silver. The vast majority of commodity analysts agree that the “poor man’s gold” has an incredible amount of upside potential if it can manage to penetrate the massive double top @ 49.75 (Chart #3). The first leg of the double top was formed during the Hunt Brothers fiasco in early-1980. The second leg of the double top was created in April 2011, following the global financial crisis. Will silver have enough momentum to penetrate 49.75 during this current bull market advance? We should know the answer within the next 12 to 24 months.
In regard to SLV, the long-term trend is neutral. The ETF is hovering in the middle of its 15-year trading range. The important numbers to watch are 10.20 and 31.05.
SHORT-TERM CHART SLV
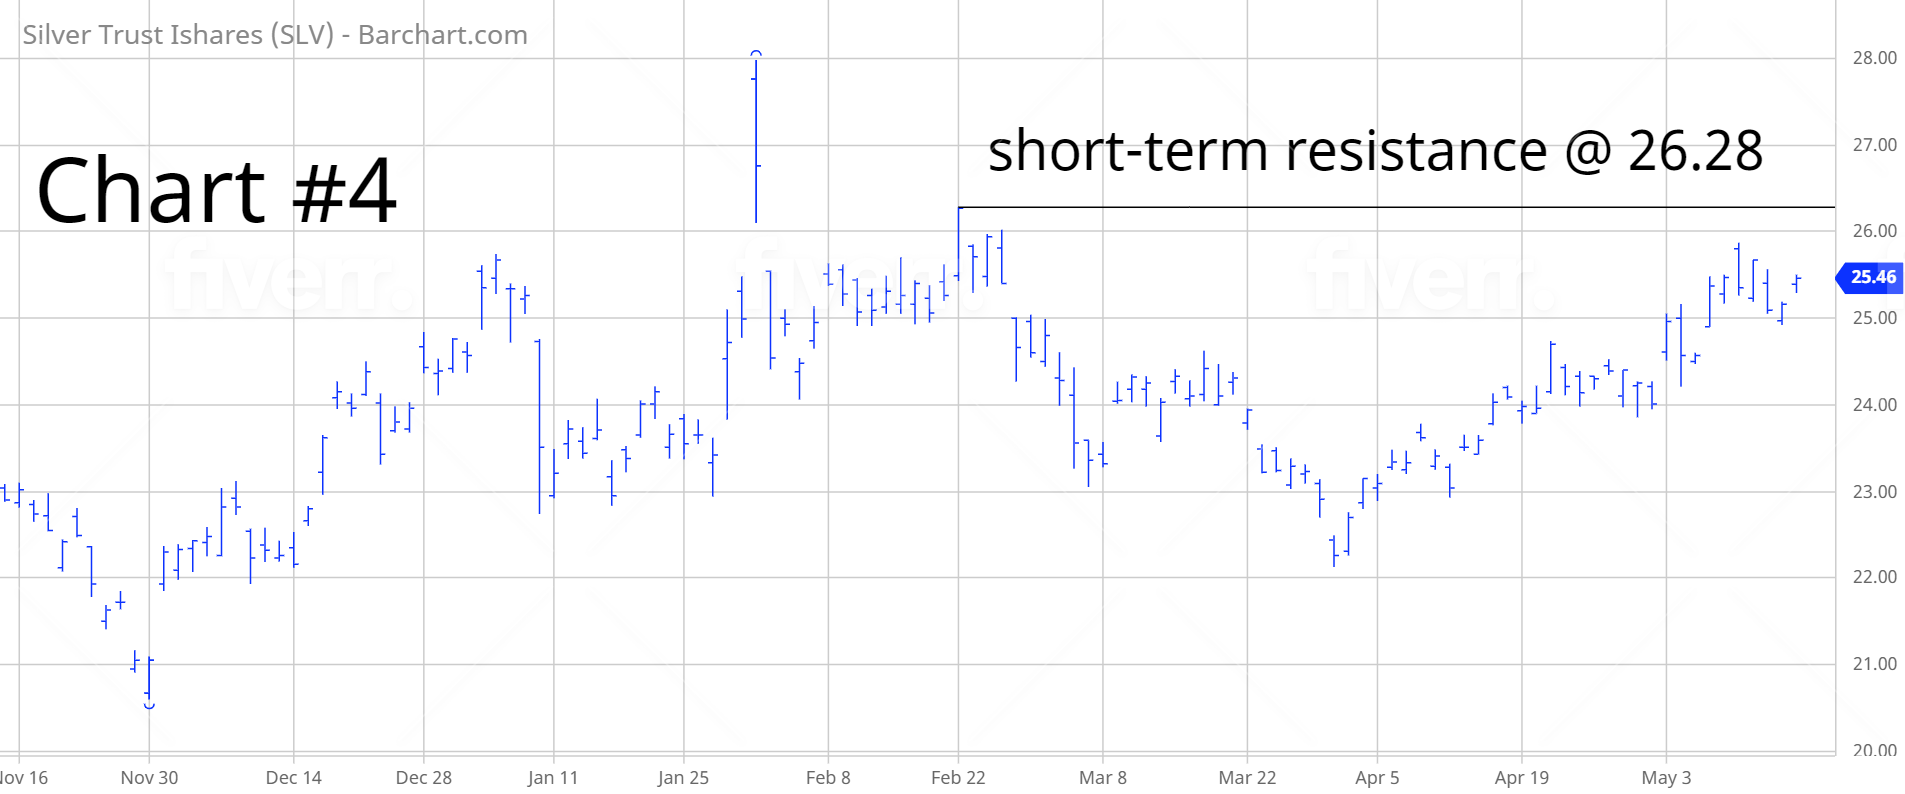
Please review the 6-month chart of SLV (Chart #4). The ETF has essentially traded sideways during the past six months. The next level of support is 21.93. The next level of resistance is 26.28. The most likely scenario is a bullish breakout.
LONG-TERM CHART SLV
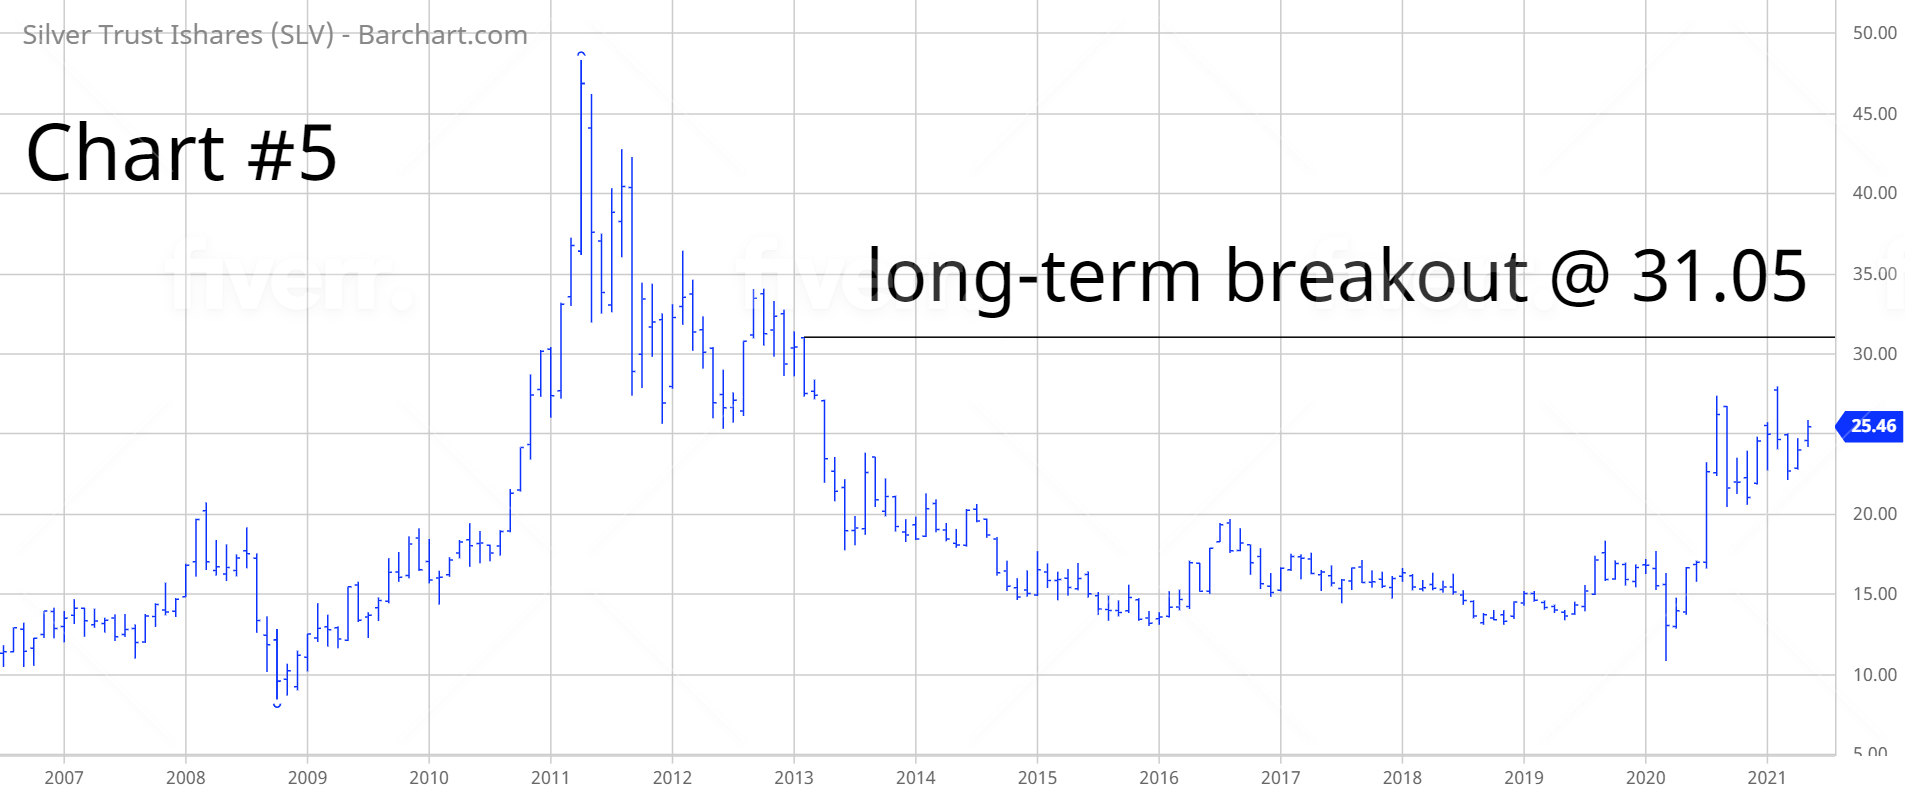
Please review the 15-year chart of SLV (Chart #5). This chart covers the entire trading history of the ETF. The long-term chart pattern is neutral. SLV spiked to a new all-time high in April 2011, in response to excessive money printing by the Federal Reserve following the 2008 Global Financial Crisis. SLV drifted lower for the next nine years, culminating in a major low at the beginning of the global pandemic in March 2020. The EFT has enjoyed a substantial rally during the past 14 months. The most likely scenario is a bullish breakout above 31.05.