SPDR S&P 500 ETF (SPY) Key Statistics
Thank you for reading this post, don't forget to subscribe!
Minor Support Level 350.51 Minor Resistance Level 384.95
Major Support Level 155.73 Major Resistance Level 397.39
Minor Buy Signal 389.70 Minor Sell Signal 347.65
Major Buy Signal 409.84 Major Sell Signal 139.54
BRIEF OVERVIEW – SPY ETF
Stocks have been trading on Wall Street since the signing of the Buttonwood Agreement on 17 May 1792. Over the course of the past 229 years, investors have witnessed several different types of bull markets, bear markets and stock market cycles. The majority of professional investors and financial historians believe that equity prices are repetitive in nature. Based on their research, cycles can be used to determine the future direction of the stock market. However, many investors have discovered that these once-reliable stock market cycles are no longer useful. Within the past 10 to 15 years, the vast majority of global stock markets have completely ignored cyclical patterns. In fact, cycles are just one example of many indicators that no longer work in the current environment. Why have so many stock market indicators become completely unreliable? Let’s discuss the details.
Before we delve into why stock market indicators no longer work, let’s review a few examples of these indicators.
- Overbought-Oversold Oscillators
- Fibonacci Ratios
- Elliott Wave
- Gann Numbers
- Commitment of Traders (COT)
- Money Flow Index
- DeMark Indicators
These indicators began to lose their effectiveness following the 2008 global financial crisis (GFC). As you examine the list, you will notice that all of these indicators have one thing in common. They are
designed to pick tops and bottoms, which explains why this particular group of indicators are no longer useful. For the past 12 years, equity prices have essentially been in a continuous bull market. With the exception of the brief decline from COVID, the stock market has enjoyed an unprecedented rally. In fact, stocks have never experienced this type of bullish behavior in their 229-year history. What is the driving force behind this record-setting stock market advance? Why has this rally lasted longer than any other rally in US history? The answer to these questions can be found in the following tables.
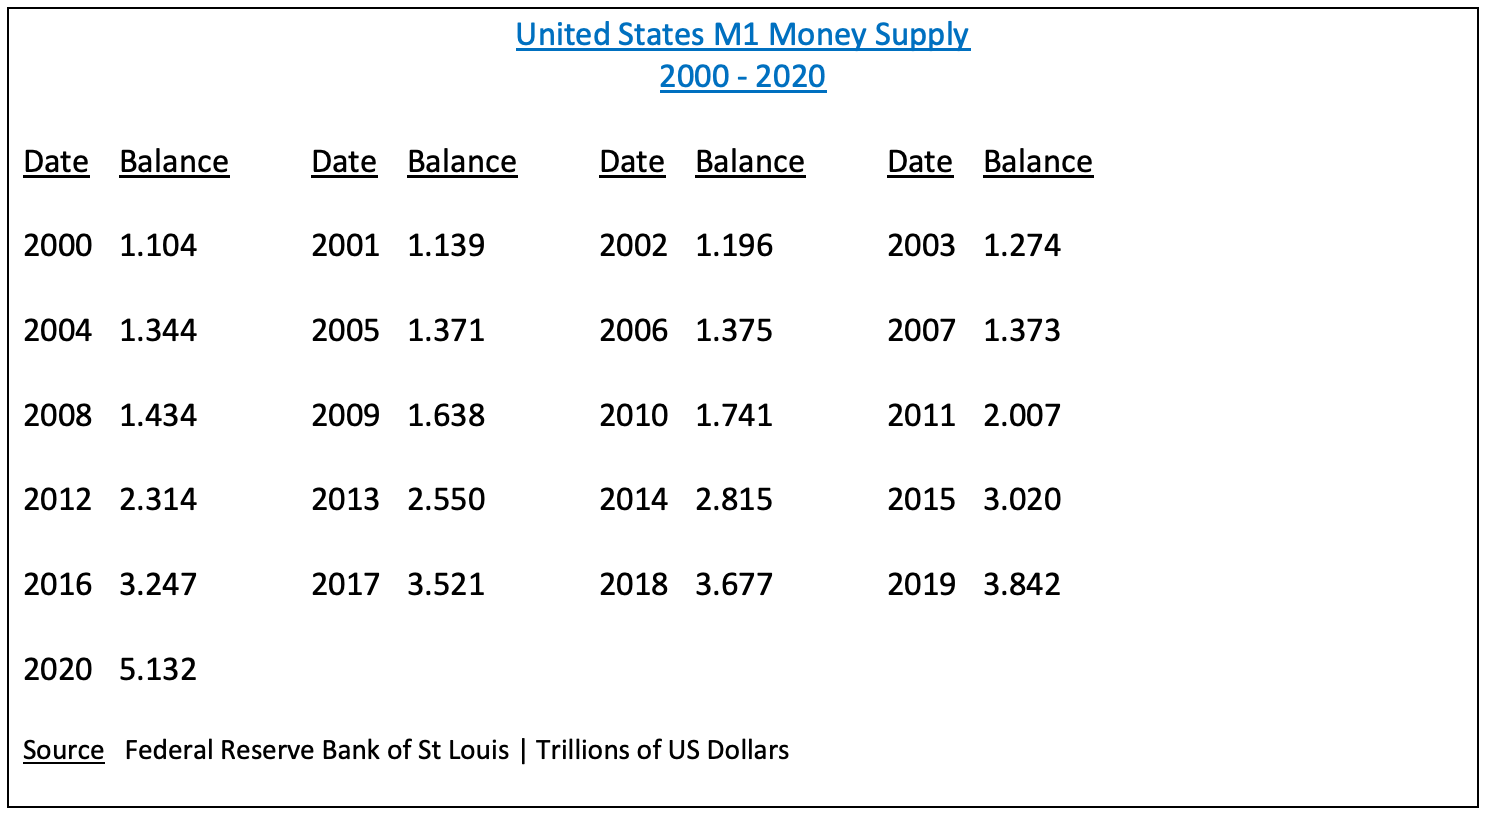
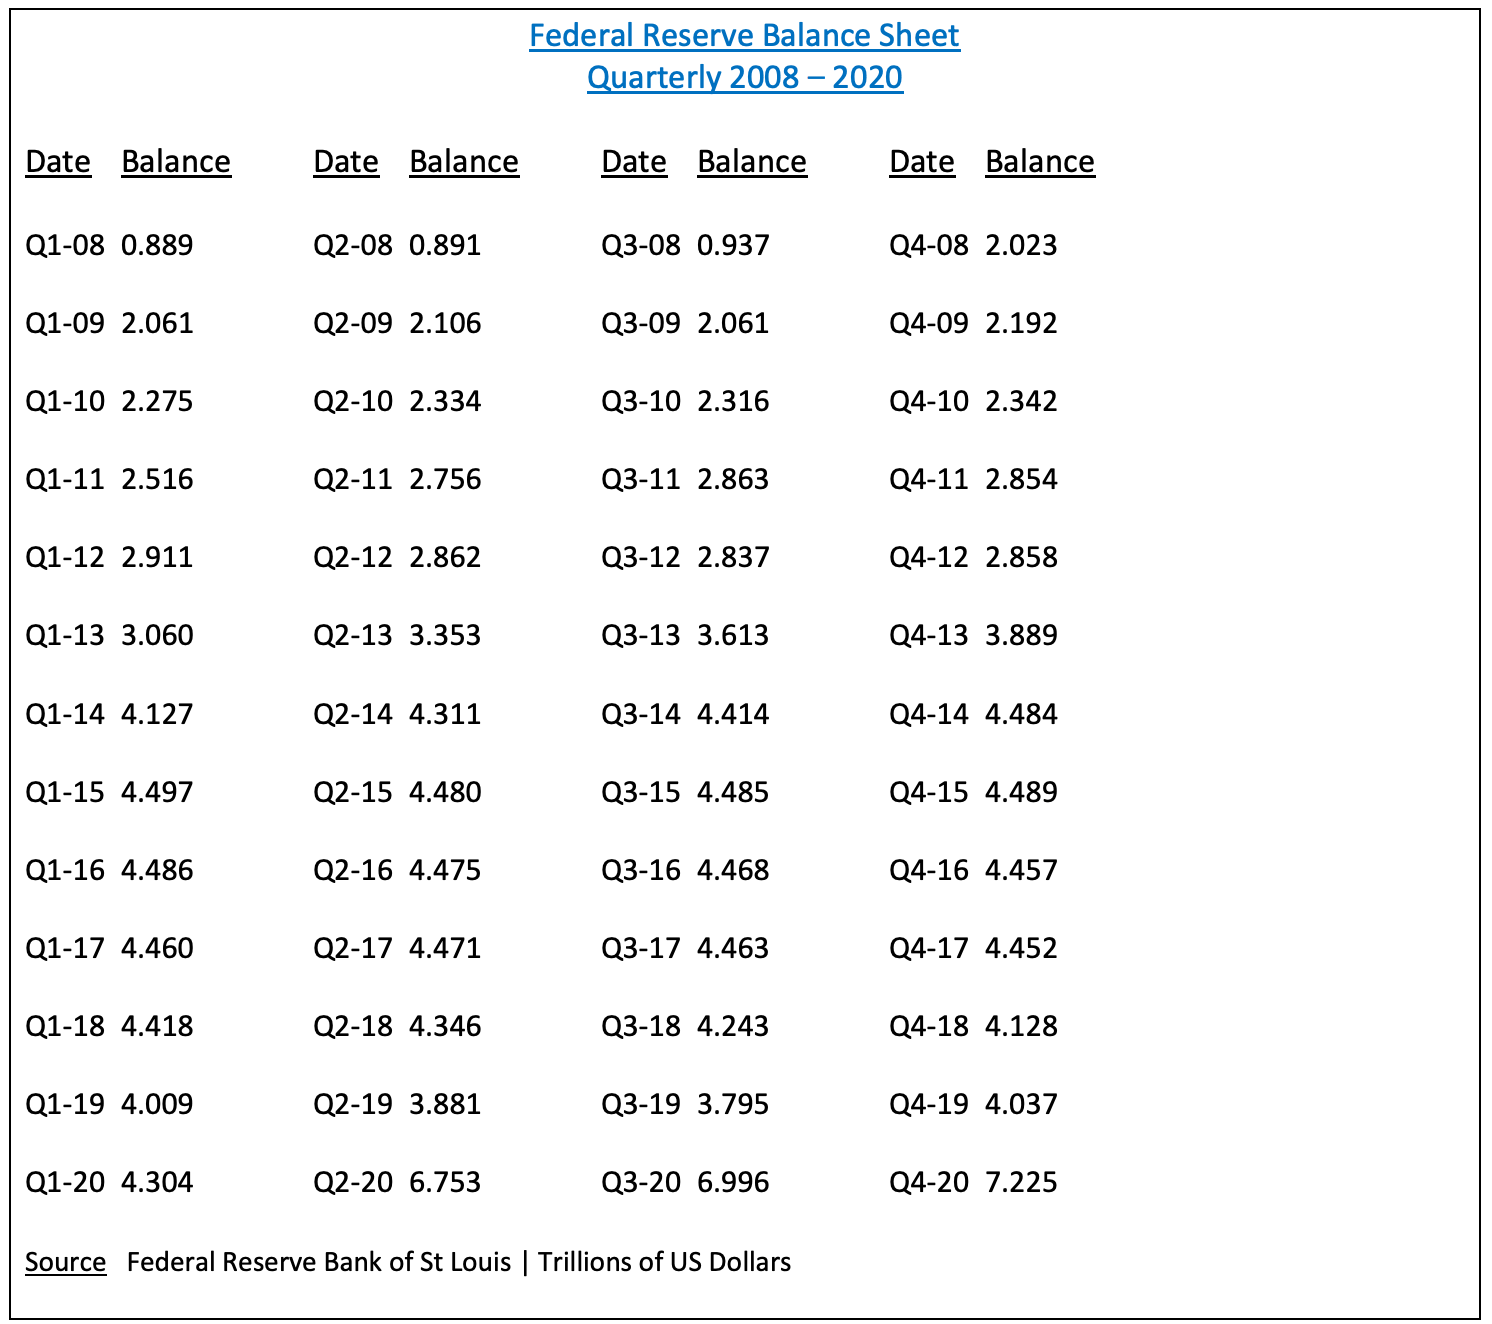
These two tables explain precisely why US stocks are generating new all-time highs, almost on a daily basis. In an effort to stimulate the domestic economy following the 2008 GFC, the Federal Reserve went on a massive spending spree by unleashing trillions of dollars into the banking system. This explains the incredible advance in the M1 money supply. In addition to expanding M1, the Fed has completely blown out its balance sheet by purchasing treasury bonds, corporate bonds, junk bonds and bond ETFs. It’s only a matter of time before stock ETFs are added to the mix.
The growth rate of the M1 money supply has been absolutely staggering during the past decade. As you can see from the table, M1 growth was very stable prior to 2008. For example, the average annual growth rate of the United States M1 money supply was 3.05% from 2000 through 2007. Immediately following the financial crisis in 2008, the growth rate of the money supply went parabolic. During the past 12 years, the average annual growth rate has been 19.8%. These numbers represent an enormous increase in the supply of money.
In terms of the Fed’s balance sheet, the expansion has been even more dramatic than M1. Since Q1 2008, the balance sheet has expanded by a mind boggling 712.7%. The average annual growth rate is 50.4%. These numbers are off the chart and fully explain the never-ending rally in the stock market.
The massive rally in the stock market is not limited exclusively to the United States. On the contrary, stock markets around the world are enjoying substantially higher prices. This is particularly true among G20 nations. Why are the G20 countries experiencing a parabolic advance in stock prices? Because each country’s central bank has followed the lead of the Federal Reserve by injecting trillions of currency units into its financial system. Without question, this has been a coordinated effort by global central banks to resurrect economic activity. The monetary expansion started in 2008 with the GFC and it has continued uninterrupted for the past 12 years. The 2020 global pandemic dramatically accelerated the money printing. Not surprisingly, G20 stock markets have exploded. How much longer can this rally continue? Of course, that’s the million dollar question.
In an effort to provide investors with exposure to the S&P 500, the SPDR family of exchange traded funds (managed by State Street Global Advisors) introduced the S&P 500 ETF on 22 January 1993. The ticker symbol is SPY. The ETF allows investors to participate in the S&P 500 without the burden of owning shares of each company within the index. SPY is historically significant because it was the very first exchange traded fund listed in the United States. SPY is easily the most heavily traded ETF, with daily volume usually exceeding 100 million shares.
SHORT-TERM VIEW – SPY
Stocks have exploded to the upside in anticipation of an additional multi-trillion dollar stimulus package from the Biden administration. The short-term momentum has been in favor of the bulls for the past several months. The next level of resistance is 384.95. The momentum will turn bearish on a weekly close below 350.51.
LONG-TERM VIEW – SPY
Milton Friedman is regarded as one of the most influential economic thinkers of the past 100 years. Friedman’s major contribution to the study of economics was a school of thought known as monetarism, which was first introduced in a 1956 research report by Friedman. Monetarism gained national attention in a 1963 book written by Friedman titled, A Monetary History of the United States. Friedman’s book quickly became a major reference point for the monetarism viewpoint within the macroeconomic community.
Monetarism is an economic theory which focuses on central banking and the supply of money. Essentially, Friedman argues that excessive expansion of the money supply is inherently inflationary. Although he viewed central banks as a necessary component of a country’s monetary system, Friedman was often critical of their attempt to influence the growth rate of the economy by constantly adjusting the money supply. Friedman believed that central banks should play a very limited role in regard to monetary policy. Based on his research, attempting to adjust the growth rate a country’s economy through central bank intervention was an exercise in futility. In fact, Friedman argued that central bank meddling usually produced the opposite effect in terms of economic growth.
Friedman claimed that monetary authorities should concentrate exclusively on maintaining price stability. In order to maintain price stability, he proposed that central banks create a fixed growth rate of the money supply. This became the core concept of monetarism. Those economists who agreed with Friedman’s idea of a fixed money supply became known as monetarists. The popularity of monetarism exploded within the professional economic community throughout the 1960s and 1970s.
Unfortunately for Friedman, monetarism began to fade in popularity beginning in the late-1980s because Friedman’s theory was invalidated following the stock market crash of 1987. In an effort to stabilize the economy, the Federal Reserve dramatically increased the money supply for several months beginning in October 1987. Based on Friedman’s monetarism theory, the United States should have experienced a corresponding rise in the rate of inflation. However, inflation never materialized following the Fed’s aggressive money printing. Consequently, economists began to distance themselves from monetarism.
Sadly, Milton Friedman passed away in November 2006. Monetarism never returned to favor with professional economists. However, during the past decade, monetarism has once again reestablished itself as a legitimate economic theory. A growing number of influential economists and professional investors are convinced that Friedman’s original theory will ultimately be proven correct. They argue that the Federal Reserve’s excessive money printing is an accident waiting to happen. They believe that the Fed has simply postponed the inflation during the past decade by depositing excess reserves with the large money center banks. In other words, the excessive money printing by the Federal Reserve never made its way into the hands of consumers. Instead, the funds were held in the form of US treasury securities spread across several banks. Consequently, the excessive money printing never caused inflation to surface.
Going forward, many Wall Street economists believe that the Federal Reserve (along with help from the Treasury Department) will place its excess reserves directly into the hands of consumers, thus removing banks from the equation. Placing funds directly into the hands of the consumer will substantially increase the velocity of money, which is a necessary ingredient to high levels of inflation. How will this affect the stock market? Based on historical records, the stock market performs poorly during inflationary periods. In fact, rising inflation along with rising interest rates are the two greatest threats to a bull market. Over the course of the past century, inflation has killed more bull markets than any other macro event.
All stock market cycles eventually end. They never continue in perpetuity. That’s why they are called cycles. They contain a beginning, a middle and an end. Despite the incredible strength of the current bull market, this cycle will ultimately reverse course and turn bearish. The inflation narrative is gaining momentum within the Wall Street community. This could be the catalyst that finally disrupts the greatest bull market in US history.
In regard to SPY, the long-term view remains extremely bullish. The next resistance level is 397.39. A weekly close below 155.73 is needed in order to reverse the momentum. It’s highly unlikely that the long-term momentum will turn bearish any time in the near future. However, if the rate of inflation begins to creep higher in 2021, the bull market could begin to unravel very quickly.
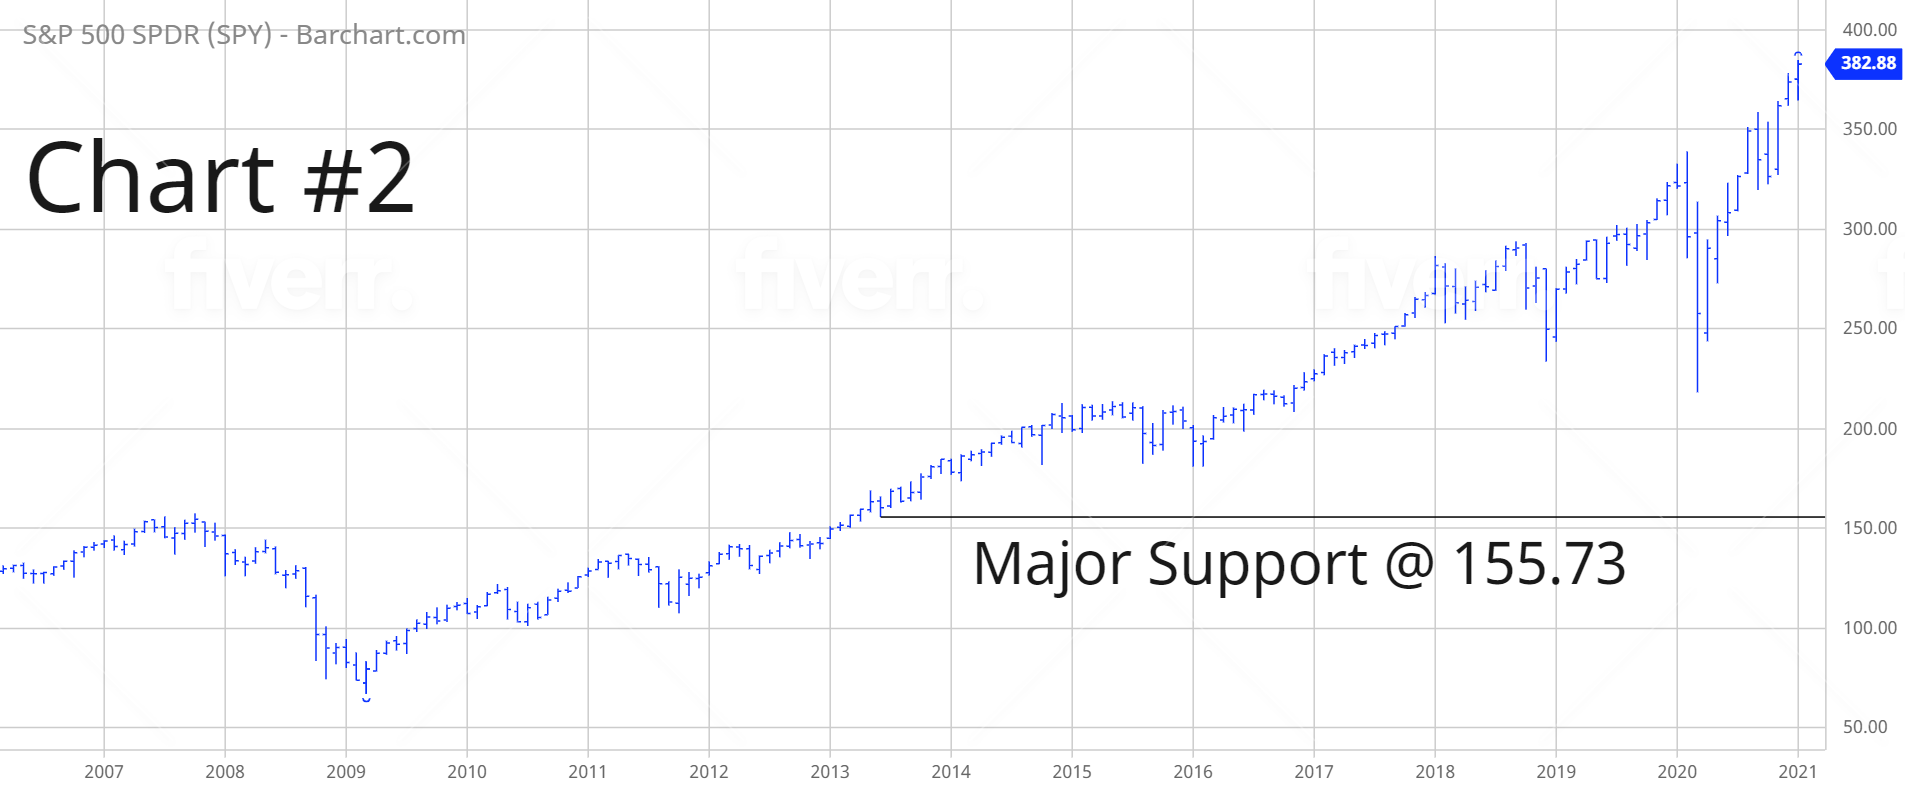
SHORT-TERM TREND – SPY
Please review the 6-month chart of SPY (Chart #1). The general consensus on Wall Street was that a Democratic administration would be bearish for stock prices. Of course, the general consensus is usually wrong. Therefore, it should be no surprise that the stock market has enjoyed a substantial rally following Biden’s victory on 3 November. SPY has exploded to the upside. The next level of resistance is 384.95. The chart pattern will turn bearish on a weekly close below 350.51. The most likely scenario is a continuation of higher prices.
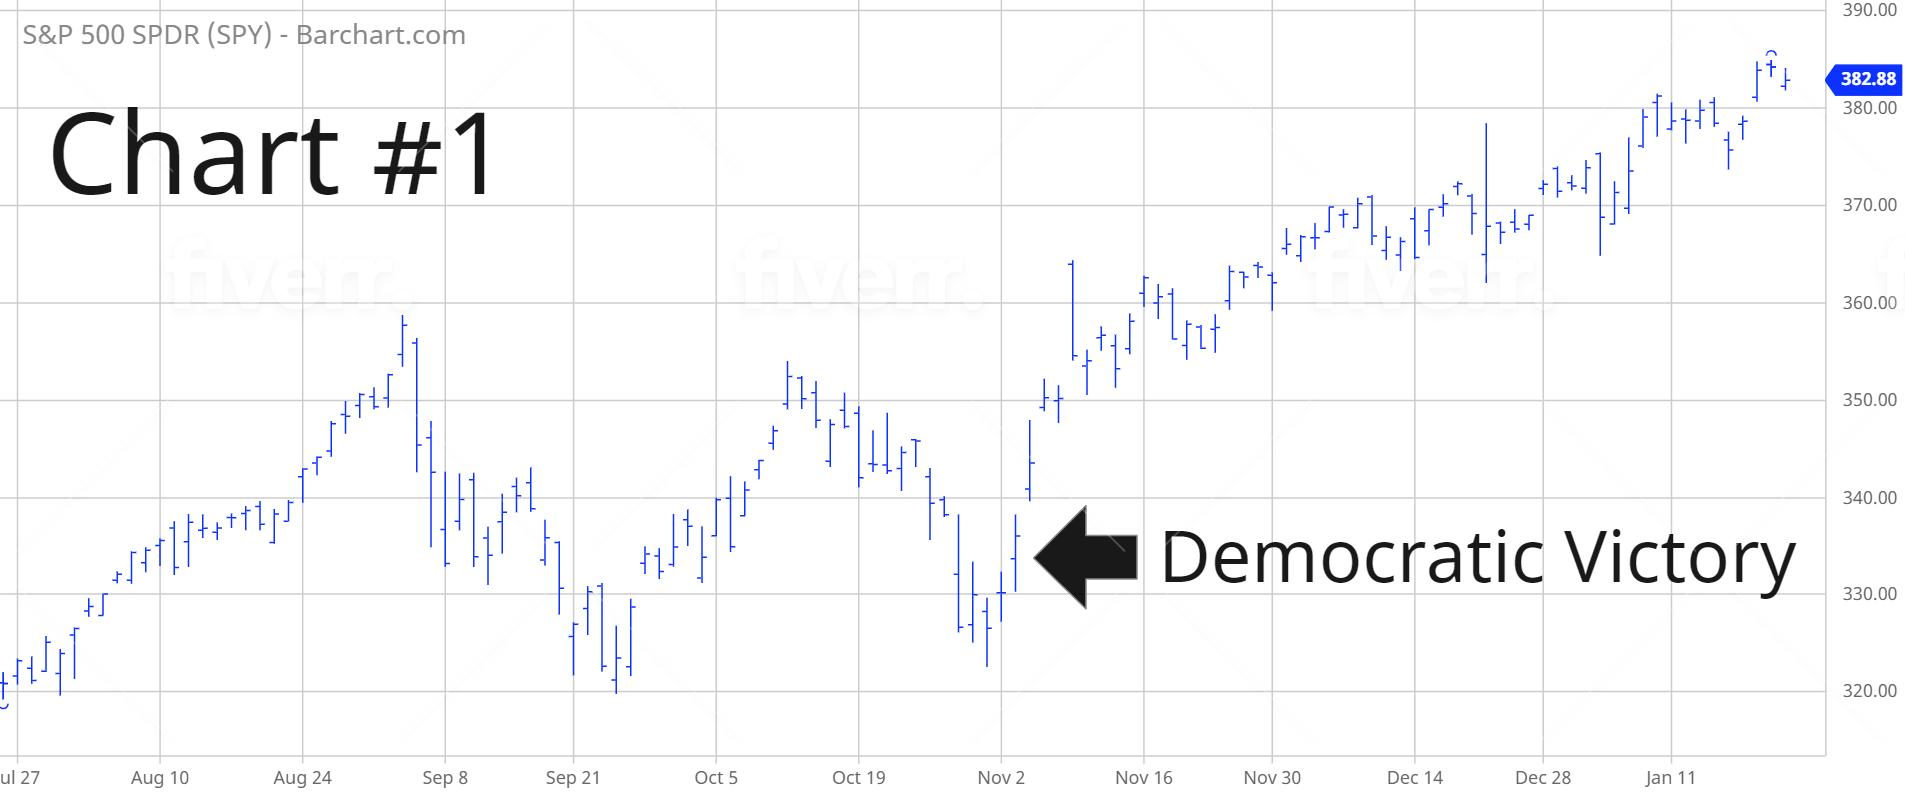
LONG-TERM TREND – SPY
Please review the 15-year chart of SPY (Chart #2). The long-term trend remains extremely bullish. In order to create a bearish chart pattern, SPY must fall below 155.73 on a weekly closing basis. Highly unlikely.