SPDR Dow Jones Industrial Average ETF (DIA)
Key Statistics
Thank you for reading this post, don't forget to subscribe!
Minor Support Level 272.20 Minor Resistance Level 312.71
Major Support Level 112.14 Major Resistance Level 326.68
Minor Buy Signal 319.69 Minor Sell Signal 266.93
Major Buy Signal 335.31 Major Sell Signal 101.33
BRIEF OVERVIEW DIA ETF
Over the course of the past several decades, investors have discovered a number of ways to speculate in the stock market. Many different investment styles and philosophies have been created in an effort to capture profits. All of these various methodologies can be divided between two distinct categories: fundamental analysis and technical analysis. Let’s briefly discuss each category.
Fundamental analysis is based on such things as earnings per share (EPS), dividend yield, book value, debt-to-equity ratio, cash flow, shareholder’s equity, debt-to-income ratio, long-term debt and supply-demand numbers. These are just a few examples of fundamental analysis. The main objective of fundamental analysis is to accurately determine the intrinsic value of a company or commodity. Investors use publicly available information in order to accomplish this task. The majority of this data can be found in a company’s annual report, SEC filings or USDA reports.
Technical analysis consists of chart patterns, moving averages, support & resistance levels, trendlines, momentum indicators, cycles, volume and oscillators. The main objective of technical analysis is to find stocks and commodities that are on the verge of generating a substantial move. In contrast to fundamental analysis, traders who rely on technical indicators are not the least bit interested in financial data or supply-demand numbers. Instead, technical analysts rely almost exclusively on chart patterns and momentum studies.
Which method is the most profitable? Unfortunately, it’s impossible to answer this question. There is no publicly available data that tracks this type of information. However, based on empirical evidence, fundamental analysis is probably best for stock investing and technical analysis works best for commodities and forex. Over long periods of time, these things tend to move in cycles, as the global trading community oscillates back and forth between fundamental analysis and technical analysis. In today’s current environment, fundamental analysis has completely fallen out of favor. Over the course of the past decade, traders and investors have completely abandoned fundamental indicators. They are not the least bit interested in researching the markets from a valuation perspective. Instead, these days it’s all about momentum, order flow and FOMO activity. Why are speculators completely ignoring fundamental data in this current market environment? By dismissing stock market fundamentals, are investors setting themselves up for a substantial decline? Let’s discuss the details.
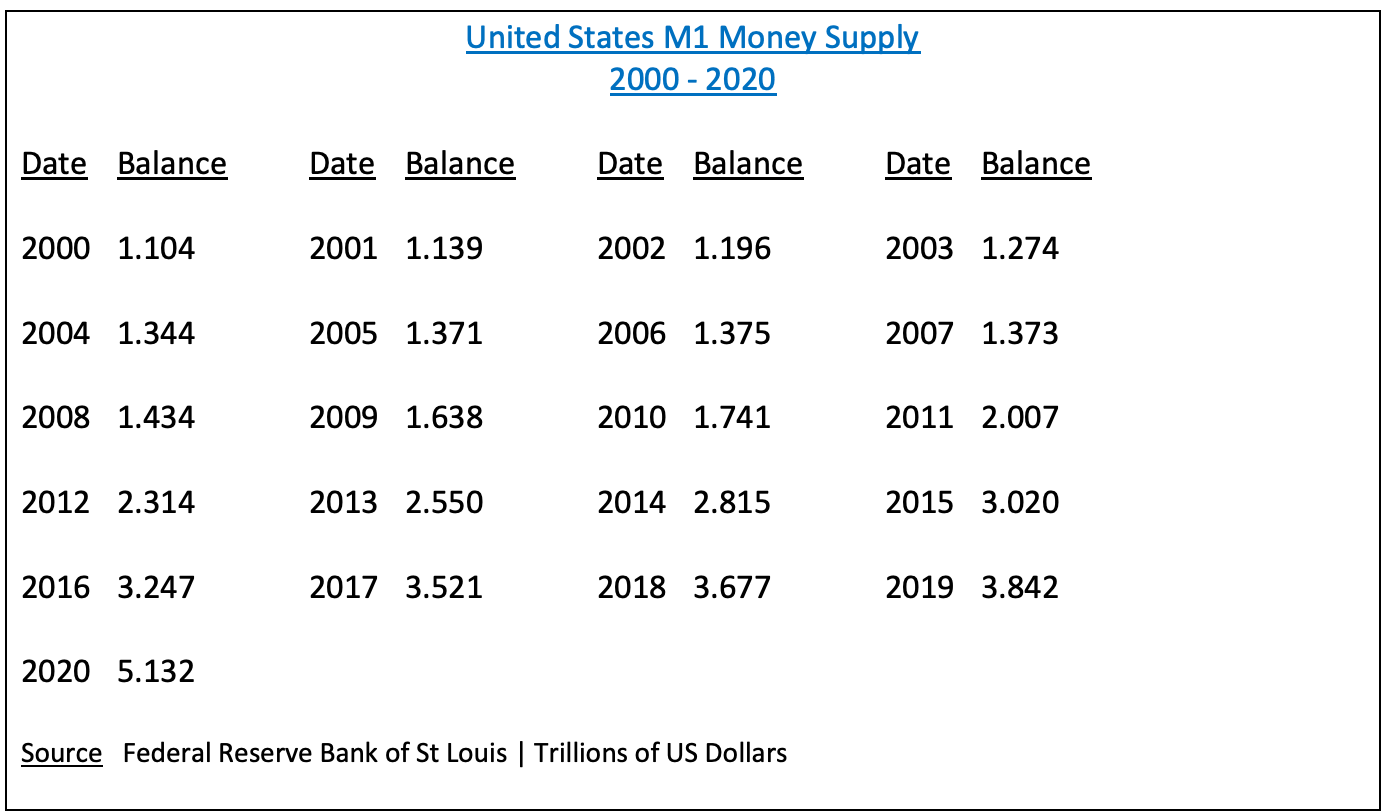
As we look back on the past decade, it’s becomes quite apparent that the global investment community began to dismiss fundamental data at approximately the same time that G20 central banks unleashed a powerful wave of money printing beginning in late-2008. The excessive money printing has completely distorted the true value of stocks and commodities. Consequently, fundamental analysis simply does not work in this type of environment. As you can see from the table, it appears that the Federal Reserve has no intentions of reducing its money printing program (also known as QE). In fact, it appears as though the Fed’s QE program will accelerate based on the growth rate of the past few years. Consequently, it’s highly unlikely that investors will pay attention to fundamental analysis any time in the near future.
The SPDR family of exchange traded funds (managed by State Street Global Advisors) introduced the Dow Jones Industrial Average ETF on 14 January 1998. The ticker symbol is DIA. This ETF is a perfect vehicle for investors who wish to participate in the performance of DJIA. DIA is an extremely popular ETF, with an average daily volume of nearly six million shares. The ETF is commonly referred to as “Diamonds.”
SHORT-TERM VIEW
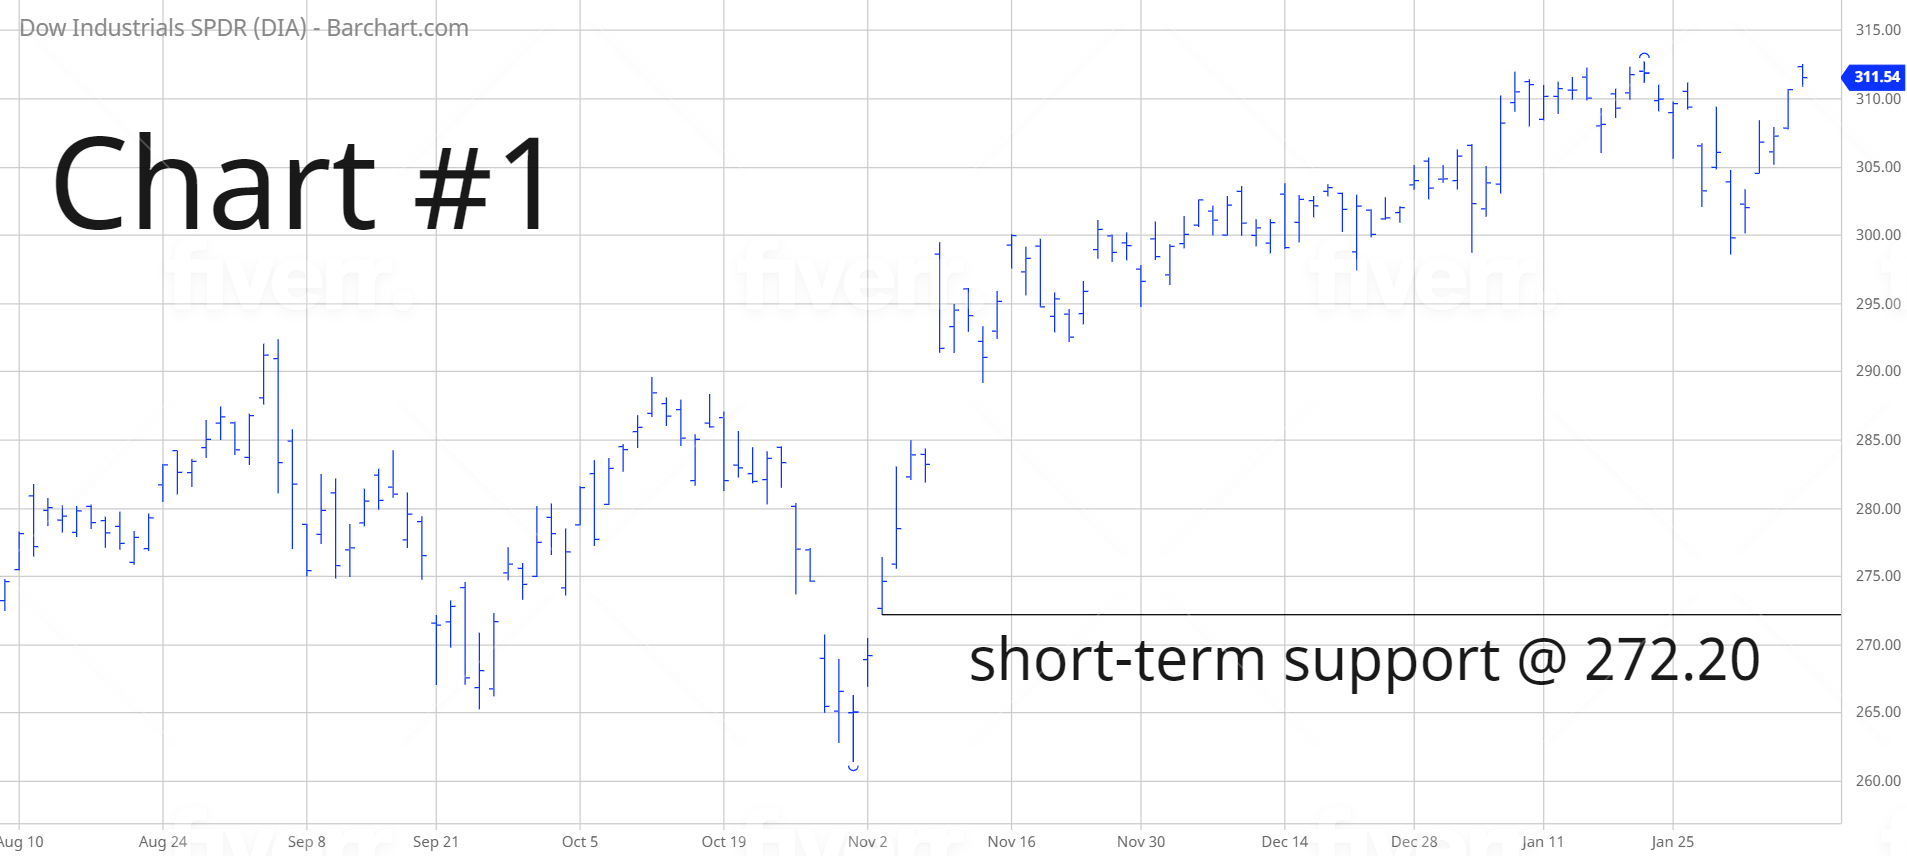
DIA remains in bullish territory on a short-term basis. The next level of resistance is 312.71. In order to recapture the momentum, the bears need a weekly close below 272.20. The most likely scenario is a continuation of higher prices.
LONG-TERM VIEW
Arguably, the most successful fundamental investor of all-time is Warren Buffett. Beginning in 1956, Buffett amassed the greatest stock market fortune in the history of Wall Street. While attending Columbia Business School, Buffett met the man that would shape his investment philosophy throughout his entire career. The man’s name was Benjamin Graham. In addition to owning his own investment firm, Graham was an economics professor at Columbia. Buffett studied under Graham at Columbia and earned a Master of Science degree in 1951.
Upon graduating from college, Buffett accepted a position as a securities analyst in Graham’s investment firm, Graham-Newman Corporation. Buffett worked at Graham-Newman until 1956, when Graham decided to retire. During his time with Graham, Buffett acquired a great deal of knowledge from Graham concerning value investing. This investment philosophy has been used exclusively by Buffett throughout his entire career.
Following Graham’s retirement, Buffett launched Buffett Partnership Ltd in 1956. Using Graham’s value investing approach, Buffett made a series of successful acquisitions throughout the first decade of his career at Buffett Partnership. One of Buffett’s more successful investments was his purchase of Berkshire Hathaway in 1962, a textile manufacturing company located in New Bedford, MA. Berkshire consisted of several textile mills geographically positioned throughout the northeast. In 1970, Buffett rebranded Buffett Partnership Ltd into Berkshire Hathaway. Over the course of the past 50 years, Buffett has transformed Berkshire Hathaway into arguably, the most profitable investment firm in the history of Wall Street. Through the use of value investing, Buffett has generated an average annual rate of return of 19.0% since 1965, compared to 9.7% for the S&P 500 during the same time period.
Despite Buffett’s incredible track record, his value investing approach is not perfect. Throughout his professional career, Buffett has certainly experienced years of underperformance. For example, the past two years have been particularly difficult for Berkshire Hathaway. In fact, 2019 and 2020 will go down in the history books as Buffett’s worst back-to-back years of stock market performance in comparison to the S&P 500. In 2019, Berkshire Hathaway underperformed the S&P 500 by 62.1%. In 2020, the number was 85.4%. Since 1965, Buffett has never experienced such lackluster results.
| Date Berkshire S&P 500
2019 10.93% 28.88% 2020 2.37% 16.26% |
Why has Buffett struggled to match the performance results of the S&P 500? Is this simply an anomaly and Berkshire will return to prominence in 2021? We will discover the answer to this question within the next ten months. There are two reasons why Warren Buffett has been unable to beat the major stock market averages since 2018. The first reason is because Berkshire is underweight in technology. Buffett has publicly stated on several occasions that he is not comfortable investing in technology. Berkshire’s portfolio confirms the fact that Buffett is hesitant to invest in technology. His reluctance to own tech companies has finally began to negatively affect Berkshire’s performance. During the past 20 years, Buffett has accumulated a large number of “old economy” stocks that are operating in the final phase of their respective life cycles.
- Airlines
- Automobiles
- Banks
- Consumer staples
- Insurance
- Railroads
The stocks that represent these various industries on this list are some of the most well-respected companies in existence. These companies have impeccable balance sheets and a history of producing excellent products and providing outstanding customer service. Unfortunately for Berkshire Hathaway and its shareholders, the vast majority of these industries will experience massive technological disruptions within the next decade. In fact, disruption is already occurring in several of Berkshire’s largest holdings. Going forward, this will be a major headwind for Warren Buffett and Berkshire Hathaway.
The second reason why Buffett has lagged the S&P 500 since 2018 is because he refuses to change his core investment approach, which is value investing. Thanks to aggressive money printing programs unleashed by global central banks, value investing simply doesn’t work in this type of environment. Throughout his investing career, Buffett has relied almost exclusively on using complex mathematical formulas to accurately forecast the present value of a company’s future earnings. However, central banks have completely distorted the present value of future earnings. Many value investors like Buffett have discovered that present value (PV) calculations simply don’t work in a ZIRP or NIRP monetary environment. As long as central banks continue to artificially depress interest rates, value investing is dead. Of course, this explains why Berkshire Hathaway has a record level of cash on its balance sheet.
Of course, Warren Buffett is certainly not the only value investor who is struggling in today’s momentum-fueled stock market environment. The entire value investing community has been unable to achieve above average results for the better part of the past decade. The past 24 months have been particularly difficult. At the end of the day, value investing is no different than any other type of investment approach in terms of its ability to generate outsized returns in comparison to the S&P 500. As we mentioned at the beginning of this report, investors have discovered many different methods, styles and strategies for speculating in the stock market. All of these various methods are cyclical in nature. In other words, they will perform exceptionally well for an extended period of time and then suddenly, usually without warning, turn cold for a number of years. Value investing is no different.
During the past several decades, value investing has experienced many “hot and cold” streaks. Therefore, the recent poor performance is not that unusual based on historical results. However, many people within the value investing community are beginning to feel uneasy about the future prospects of this style of investing. There appears to be a realization among its faithful followers that value investing could be in big trouble. If you are a strong advocate of the value investing philosophy (like Warren Buffett), you should be very concerned with the current state of global monetary policy. It certainly appears that central banks around the world have no intentions of reducing the extreme level of money printing currently in force. Consequently, as long as interest rates are kept artificially low through opaque monetary policy, value investing is dead. This current cycle of underperformance could last for a very long time.
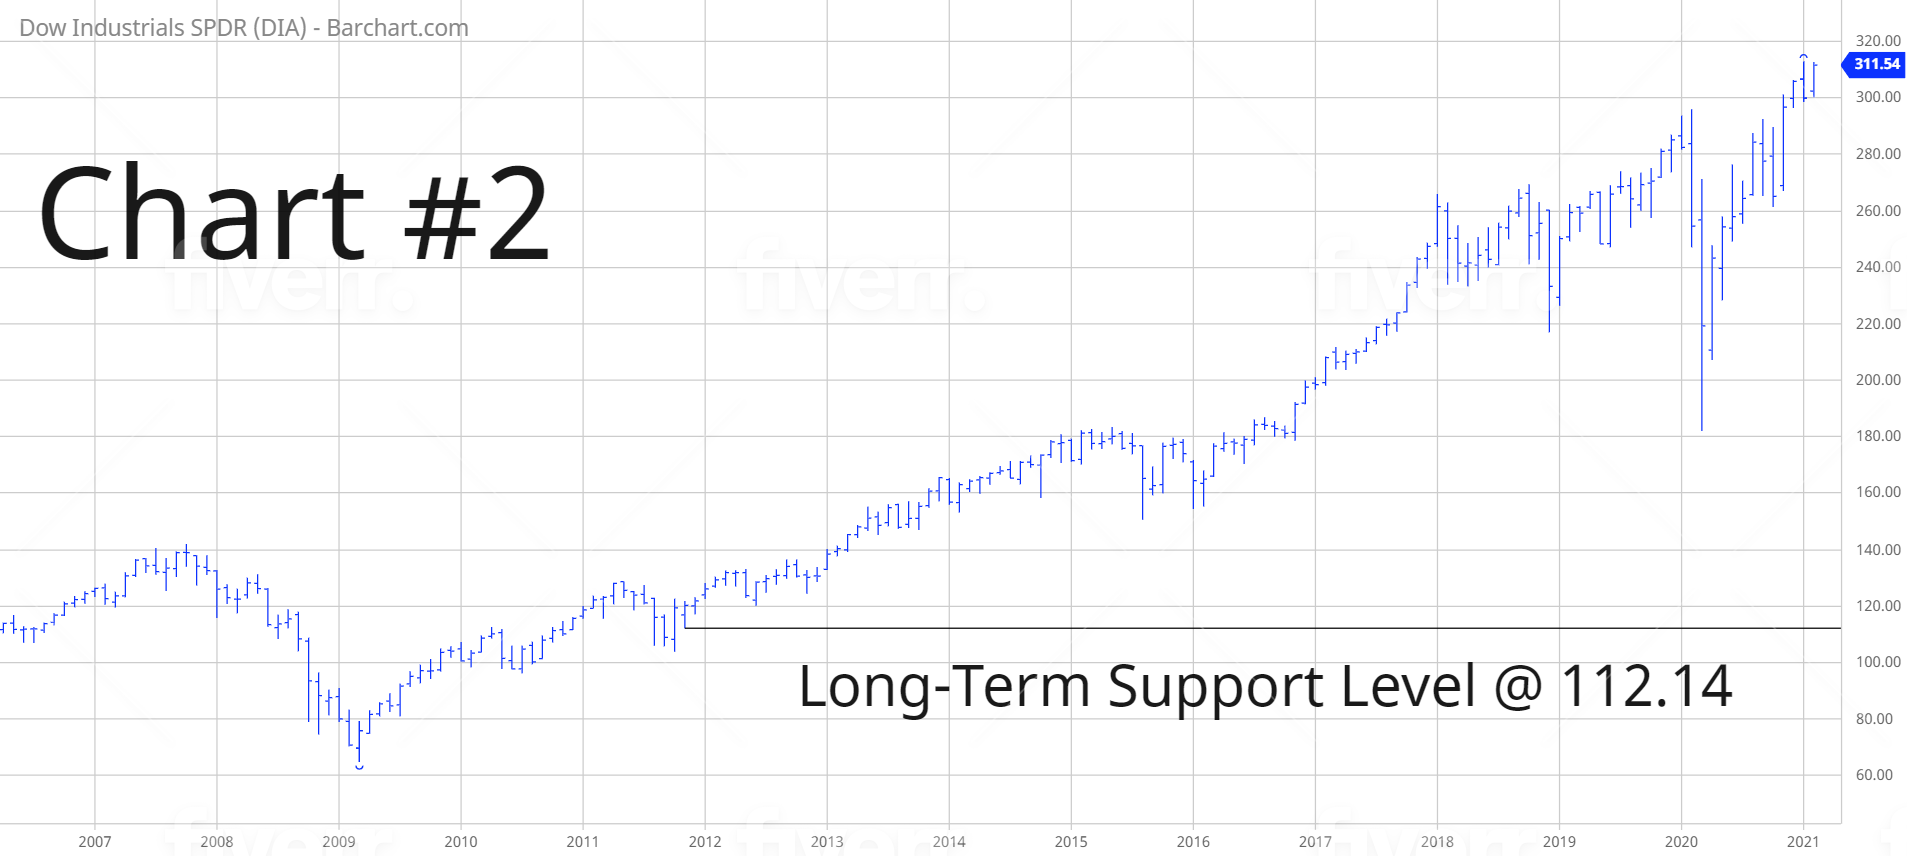
In regard to DIA, the long-term view remains extremely bullish. The next resistance level is 326.68. A weekly close below 112.14 is needed in order to reverse the momentum. It’s highly unlikely that the long-term momentum will turn bearish any time in the near future. However, if global central banks begin to lose control of their money printing apparatus, the bull market could begin to unravel very quickly.
SHORT-TERM TREND – DIA
Please review the 6-month chart of DIA (Chart #1). DIA remains in bullish territory on a short-term basis. The next level of resistance is 312.71. The chart pattern will remain bullish as long as DIA stays above 272.20 on a weekly closing basis. The most likely scenario is a continuation of higher prices.
LONG-TERM TREND – DIA
Please review the 15-year chart of DIA (Chart #2). The long-term chart pattern continues to remain extremely bullish. The next level of resistance is 312.71. A weekly close below 112.14 is needed to flip the chart into a bearish formation.