iShares MSCI Japan ETF (EWJ)
Key Statistics
Minor Support Level 61.77 Minor Resistance Level 71.88
Thank you for reading this post, don't forget to subscribe!Major Support Level 34.16 Major Resistance Level 78.56
Minor Buy Signal 73.46 Minor Sell Signal 59.97
Major Buy Signal 84.27 Major Sell Signal 29.08
BRIEF OVERVIEW
Professional money managers and institutional investors are known for developing a specific investment theme and establishing a large trading position based on their market research. Over the years, this type of investment approach has been quite successful. Many professional investors have generated substantial profits by speculating on large macro events or global investment themes. However, the major problem with this methodology is based on the fact that these “theme trades” have a tendency to create a herd mentality among professional investors. It’s not uncommon for the entire community of investment professionals to participate in the same trade at the same time.
One of the best examples of these theme trades involved the country of Japan. From approximately 1990 through 2015, the professional money management community was obsessed with the idea that the Japanese economy was on the verge of collapsing. Shorting the Japanese economy became the most overcrowded trade in the history of professional money managers. Beginning in 1990, and continuing for about 25 years, the managed money industry was convinced that the Japanese economy would eventually collapse under its own weight. Why were these investors so convinced that Japan would enter a great depression and, more importantly, why was their research completely wrong? Let’s discuss the details.
Long before Silicon Valley became the technology capital of the world, Tokyo was the king of technology. Following the end of World War II, Japan embarked upon a massive wave of economic prosperity that became known as the “Japanese economic miracle.” Beginning in 1960, Japan’s economy enjoyed three consecutive decades of unprecedented prosperity. The country’s GDP growth rate approached double digits thanks to its aggressive expansion in the area of electronics and technology. Additionally, Japan rapidly expanded its manufacturing base by focusing its efforts on creating a state-of-the-art auto manufacturing facility. The country quickly gained a reputation on the global stage for building the highest quality automobiles on the planet. Even today, 60 years after its “economic miracle,” Japan still has a reputation in the auto industry for producing high quality vehicles. In fact, Japan is currently ranked as the world’s third largest auto manufacturing country.
By 1980, the Japanese economy was expanding at an incredible rate in response to its strong export program involving automobiles, electronic devices, machine tools, textiles and chemicals. In 1960, Japan’s annual GDP was ¥16,009,100 (per million Yen). By 1980, the country’s annual GDP had exploded to ¥240,707,315. This represents a staggering increase of 1,404% over a period of 20 years.
| Japan Annual GDP
1955 8,369,500 1960 16,009,100 1965 32,866,000 1970 73,344,900 1975 148,327,100 1980 240,707,315 per million Yen | IMF |
By 1980, Japan was easily the fastest growing economy among all G20 nations. More fuel was added to the economic fire in the early-1980s when Ronald Reagan was elected president of the United States. Reagan’s free-trade economic policies were extremely beneficial to the country of Japan. In fact, economic historians agree that Japan was the biggest beneficiary of “Reaganomics” during the 1980s. Per capita GDP exploded in Japan throughout the 1980s, as the country’s citizens enjoyed high levels of disposable income. Each year, Forbes Magazine releases a list of the world’s wealthiest people. Japan dominated the list during the 1980s. The wealth in Japan became so excessive, that many of the wealthy elite began purchasing some of the most exclusive real estate around the world, particularly in the United States.
The “Black Monday” stock market crash on 19 October 1987 brought economic despair to many countries around the globe. However, Japan’s Nikkei index suffered very little damage. Thanks to the country’s vibrant economy, the Nikkei index came roaring back shortly after the crash. It appeared that nothing could stop the Japanese economic juggernaut. Of course, all good things must end, including Japan’s “economic miracle.” In 1988, a few of the country’s large money center banks began experiencing excessive amounts of loan losses, particularly in the area of real estate loans. It didn’t take long for these non-performing loans to snowball into a national crisis. Japan’s massive speculation in real estate throughout the 1980s had finally began to unravel.
By the end of 1989, Japan was in the midst of a major economic contraction. The situation was made exponentially worse by the country’s central bank, the Bank of Japan (BOJ). Much like the Federal Reserve in the United States, the BOJ was responsible for overseeing the country’s banking system. The BOJ made a huge mistake by allowing individual banks to carry its real estate loans at book value. In other words, the banks were not forced to “mark” the loans to the true market value. Consequently, Japan’s banking system found itself in dire financial straits for several years. Global investors were well aware of the fact that Japan’s banking system was in shambles. As a result, investors began liquidating all Japanese investments.
In response to this massive liquidation, the Nikkei stock index began to collapse in early-1990. The stock market peak occurred on 29 December 1989 @ 38,957.44. Over the course of the next 36 months, the index lost a staggering 68.7% of its value. The carnage continued for the next several years. Each time the Nikkei index was able to piece together a small rally, investors would create another wave of selling by dumping more shares. This pattern continued without interruption throughout the next 19 years. The collapse of the Nikkei index from 1990 through 2009 will go down in the record books as one of the greatest stock market meltdowns of all-time. From peak-to-trough, the index declined 81.9%. The final low occurred on 10 March 2009 @ 7,054.98.
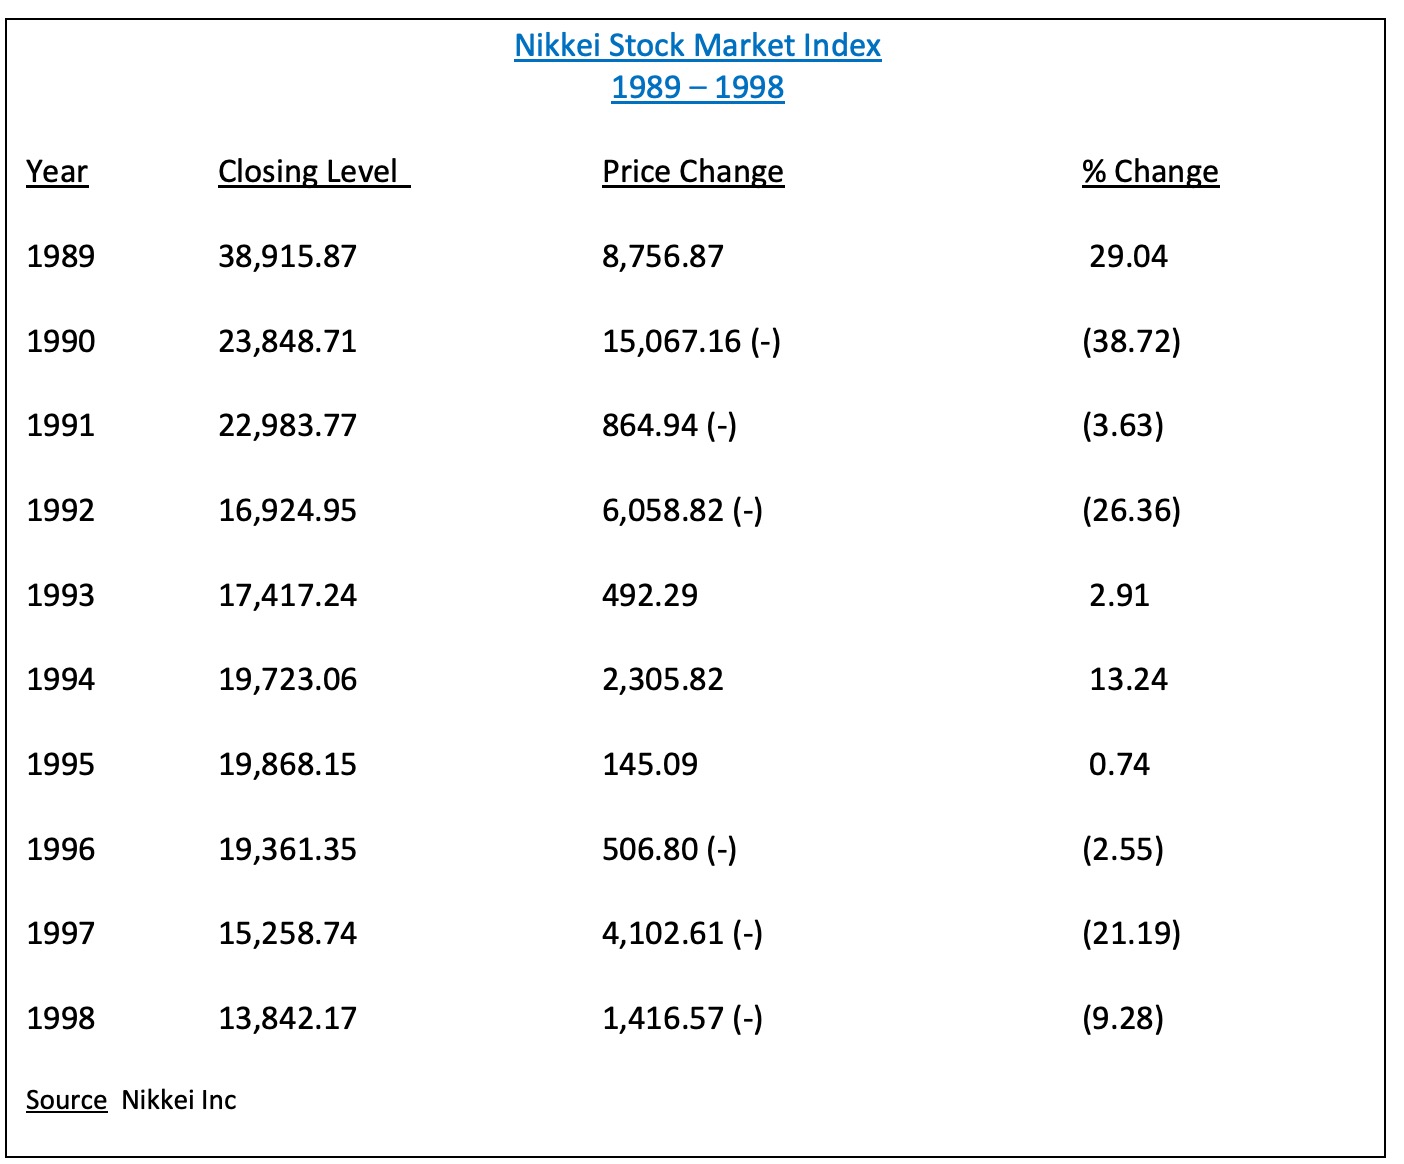
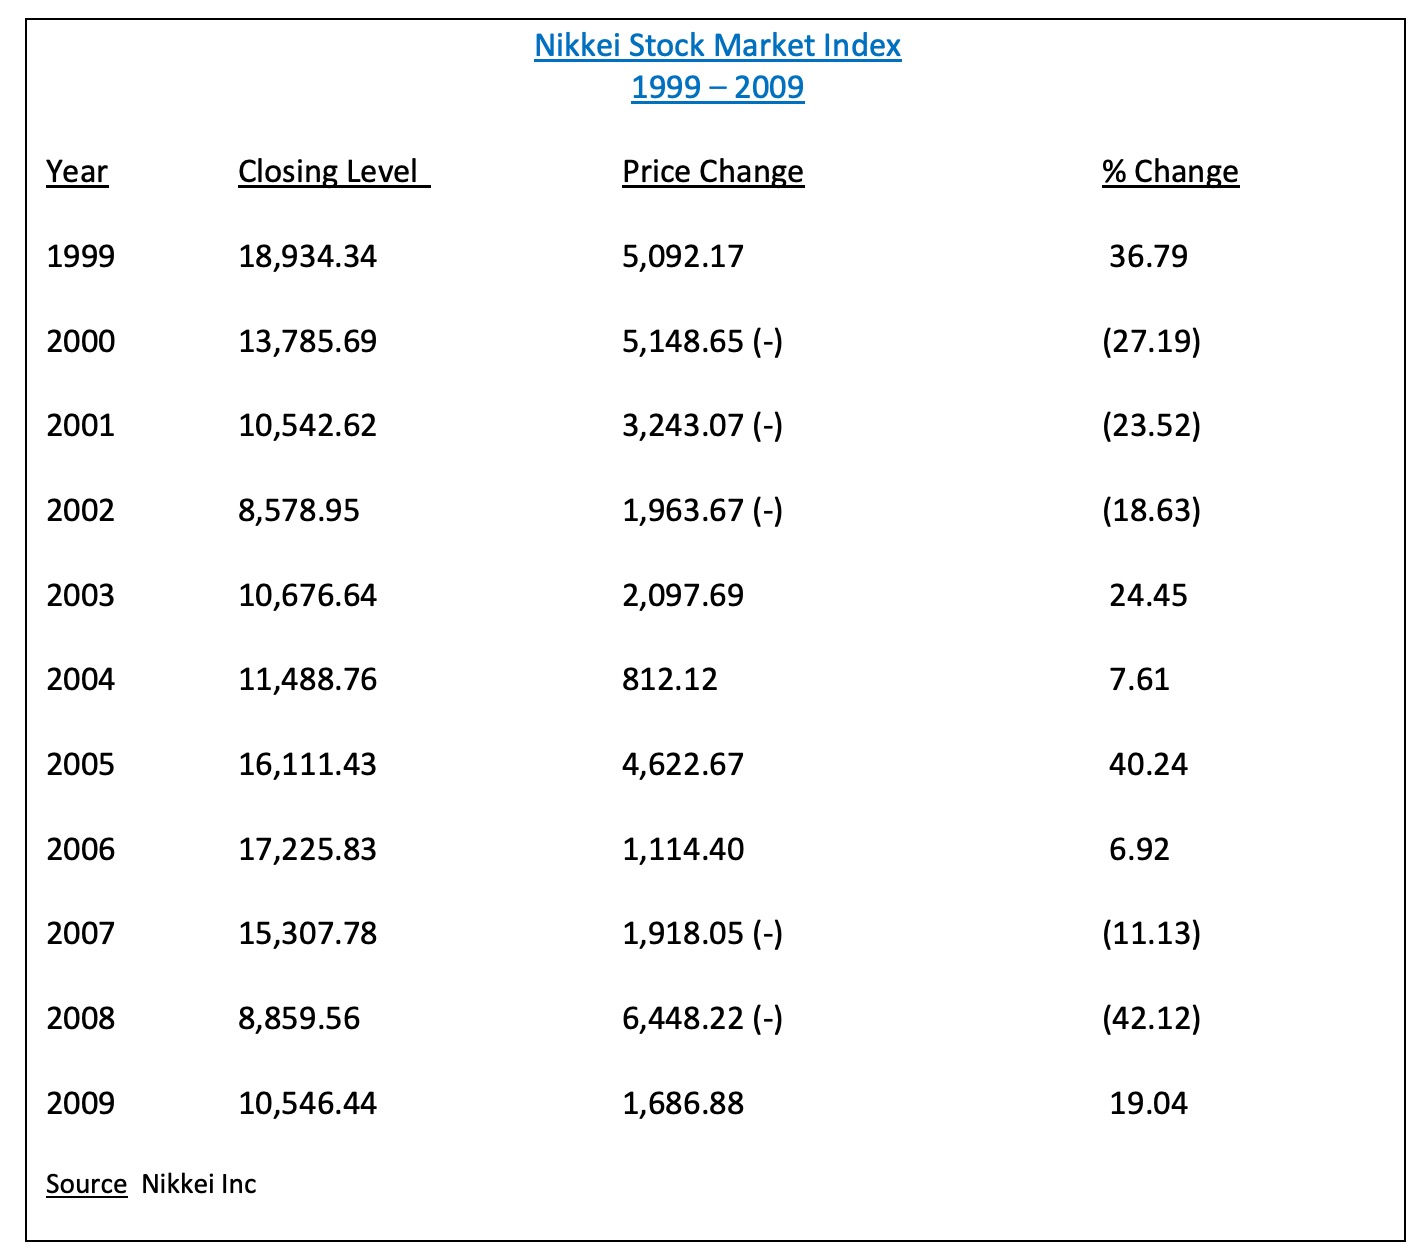
As you can see from the tables, the Nikkei produced several countertrend rallies over the years. However, these rallies were met with additional selling pressure until the final low occurred in March 2009.
In an effort to provide investors with exposure to the Japanese economy, the iShares family of exchange traded funds (managed by BlackRock) launched the MSCI Japan ETF on 12 March 1996. The ticker symbol is EWJ. The ETF provides investors with exposure to the largest publicly traded companies in Japan. EWJ has a total of 320 different holdings. The top five companies include Toyota Motor, Softbank Group, Sony Corporation, Keyence Corp and Nintendo Ltd.
SHORT-TERM VIEW
EWJ has enjoyed an incredible recovery following the pandemic low in March 2020. The ETF has advanced 66.5% since 16 March 2020. The bulls are in complete control of the short-term momentum. In order to recapture the momentum, the bears need a weekly close below 61.77.
LONG-TERM VIEW
Immediately following the initial decline of the Nikkei index in early-1990, professional money managers began jumping on the bearish Japanese bandwagon. By the mid-1990s, this became one of the most overcrowded trades of all-time. Hedge funds, CTAs, family offices, institutional investors, endowments and pension funds were placing huge bets on the demise of the Japanese economy. The majority of these bets involved some type of derivatives trade involving the Japanese Yen and Japanese government bonds.
Practically every week for the next ten years, a member of the professional trading community would appear on CNBC (or a similar business station) outlining the reasons why the Japanese economy was on the verge of collapse. They would eloquently describe the reasons why Japan’s economy would soon crash under its own weight. In addition to the talking heads on TV, there were countless articles in the financial news publications describing the country’s imminent downfall. Despite the fact that these professional investors made a convincing argument detailing Japan’s economic troubles, their dire forecast never materialized. Even though the Japanese stock market endured a brutal decline for two decades, the country’s economy never suffered any type of long-term failure. What happened? Why were these highly paid professional investors completely wrong about Japan? Let’s briefly discuss the details.
Their first mistake was assuming that Japan’s multi-year stock market decline would translate into an economic collapse. This assumption turned out to be wrong. In hindsight, it was plain to see that there was very little connection between Japan’s economy and the sell-off in the Nikkei index. The major contributing factor to the stock market decline was simply over-speculation. With the possible exception of Japanese real estate, the country’s overall economy was in fairly decent shape throughout the 1990s and 2000s. Therefore, an economic collapse was highly unlikely.
Another big mistake made by professional investors concerning Japan was assuming that Japan’s high debt-to-GDP ratio would eventually cause the country to implode. Admittedly, Japan does carry very high levels of debt. This has been true for several years. In fact, it has one of the highest debt-to-GDP ratios among all G20 nations. However, Japan has been able to manage the debt level thanks to its domestic savings rate. Historically, the country has maintained a high level of domestic savings. Please review the following table.
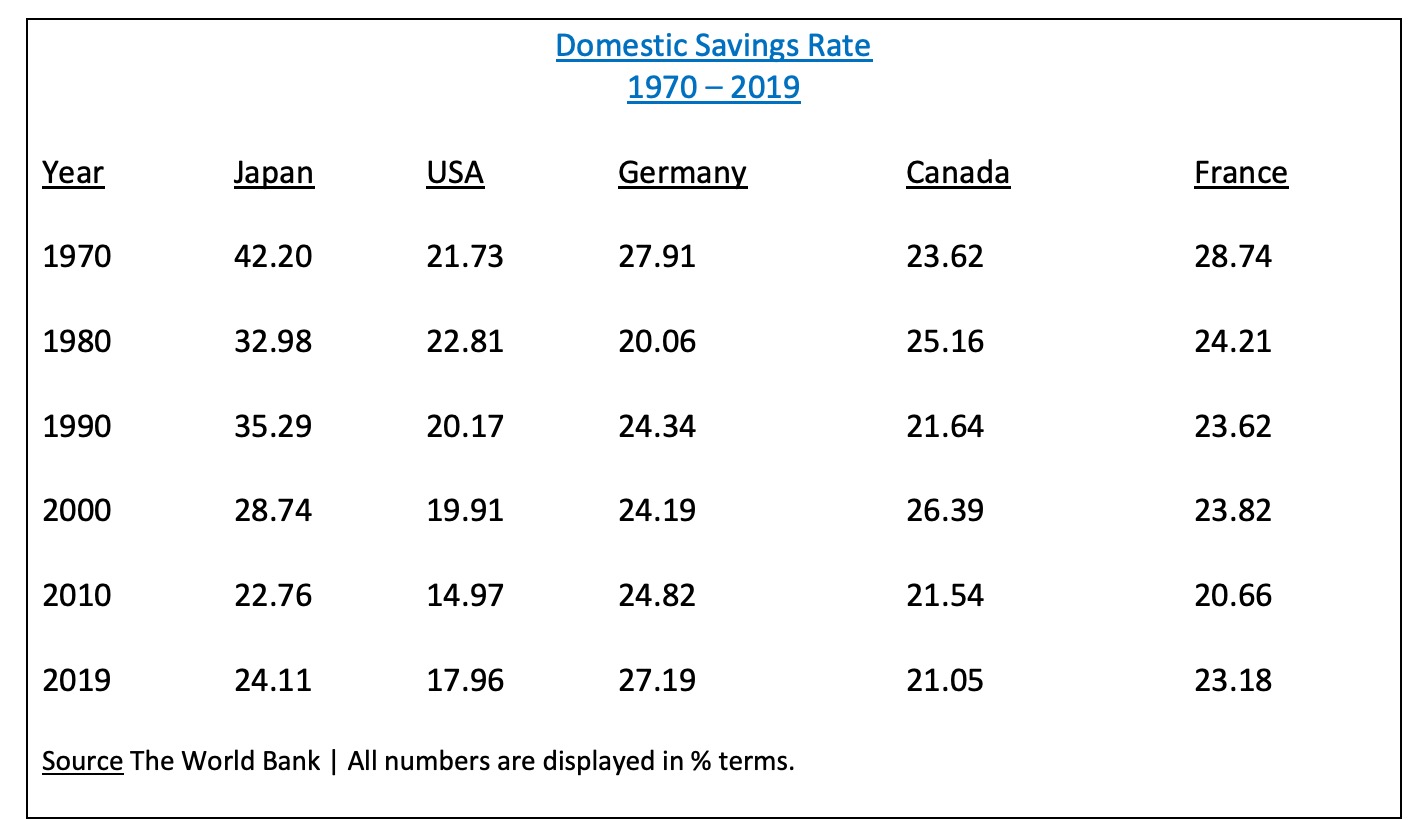
As you can see, Japan’s domestic savings rate was incredibly high throughout the 1970s, 1980s and 1990s. Admittedly, the savings rate has declined during the past 17 years. However, the decline since 2000 can be blamed on demographics. Beginning in the late 1990s, the country had to deal with an aging population. To make matters worse, as the population began to age, Japan experienced an abnormal period of declining birth rates. These two demographic factors caused the country’s domestic savings rate to fall rather sharply throughout the first 15 years of the 2000s. However, the demographic problem has subsided during the past few years. Not surprisingly, Japan’s domestic savings rate is beginning to move higher once again.
As long as Japan continues to maintain a relatively high savings rate, the country can easily manage to carry a high debt-to-GDP ratio. Essentially, Japan is financing its own debt through domestic savings. Japan’s central bank (BOJ) does not rely on foreign investors to purchase JGB government bonds. Instead, individual Japanese investors purchase the bonds through a network of government-sponsored bond purchase programs. At least for now, there’s no reason to believe that the country’s savings rate will decline. In fact, it appears that the savings rate will move higher for the next several years based on improving demographics.
In addition to its high savings rate, Japan enjoys a very healthy balance of payments (BOP) surplus. Essentially, the country exports more goods and services than it imports. A BOP surplus eases the burden of a high debt-to-GDP ratio.
Professional investors also completely missed the direction of the Japanese Yen. Everyone was expecting Japan’s currency to collapse along with its economy. Consequently, many of these traders and investors aggressively shorted the Japanese Yen beginning in 1990. This trade turned out to be a huge mistake. Instead of declining, the Yen embarked on a massive 20-year rally, culminating with a major top in October 2011. Please review Chart #1. With the exception of mid-1995 through mid-1998, the country’s domestic currency enjoyed a substantial rally.
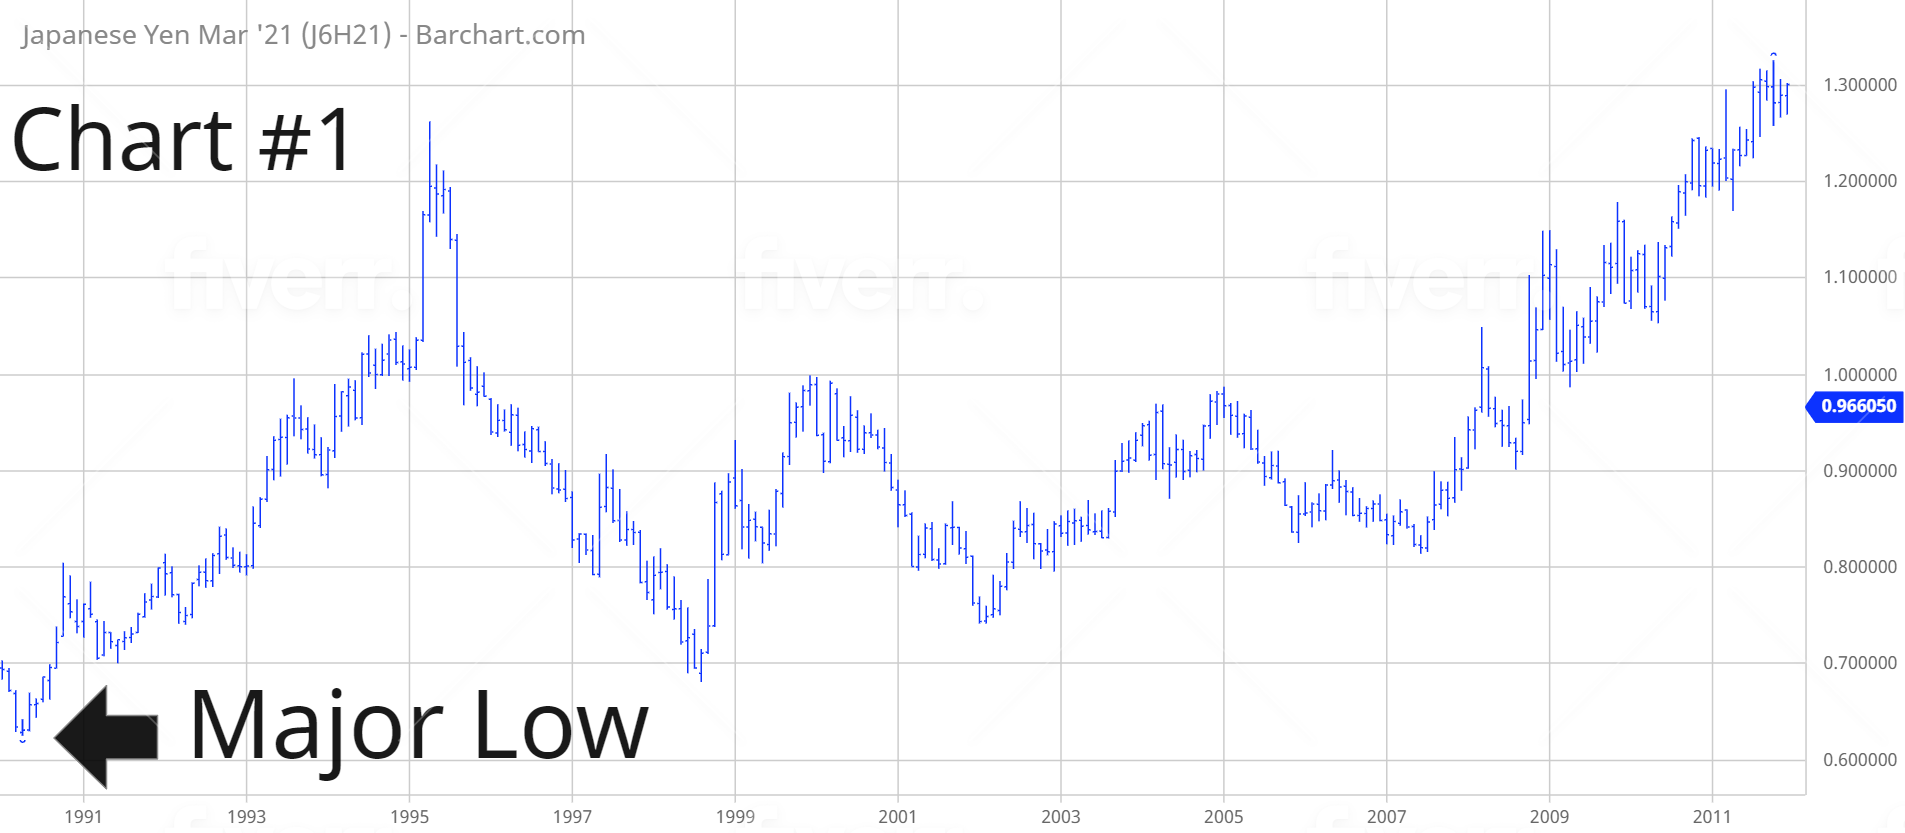
At the end of the day, probably the most important reason why the Japanese economy never collapsed was because everyone was forecasting a collapse. When all investors are making the same forecast, these projections rarely work out.
Japan received a huge vote of confidence in October 2020 when Warren Buffett revealed that his Berkshire Hathaway fund had made a substantial investment in Japanese equities. Buffett has a reputation for being a long-term investor. Therefore, he is betting that Japan’s economy will outperform other G20 economies for the next several years.
In regard to EWJ, the long-term view is extremely bullish. The ETF recently generated a new all-time high @ 69.33. The momentum is clearly in favor of the bulls. In order to reverse the momentum, the bears need a weekly close below 34.16. This type of reversal would require a dramatic collapse in global equity prices. This scenario is highly unlikely.
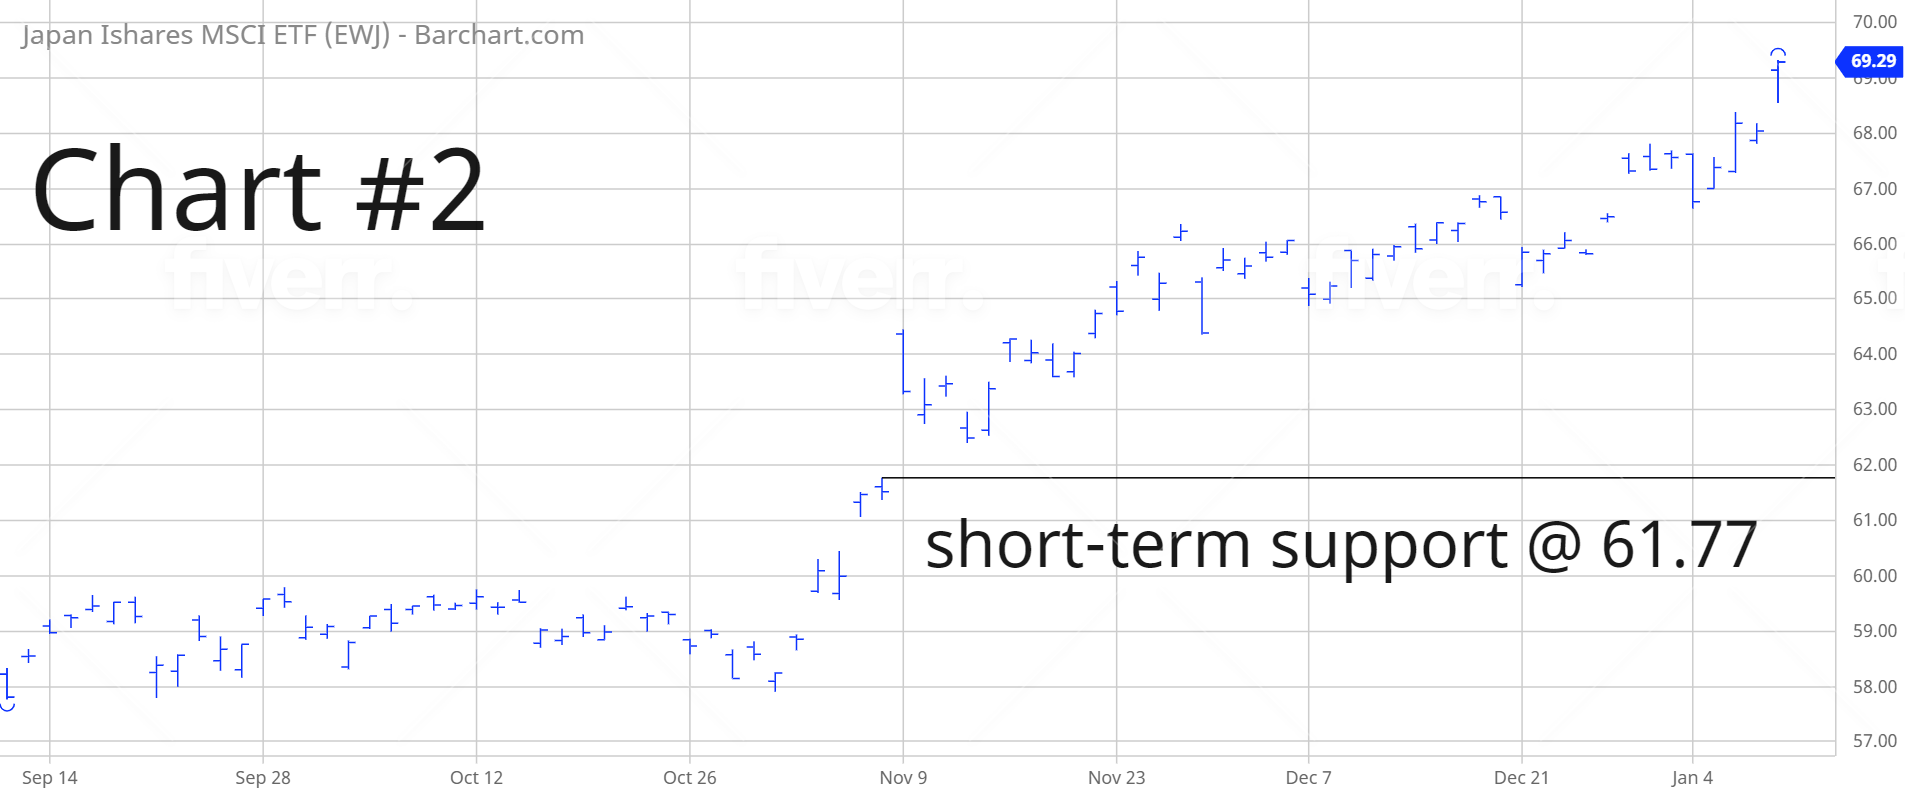
SHORT-TERM CHART
Please review the 6-month chart of EWJ (Chart #2). The short-term trend is bullish. A weekly close below 61.77 will turn the chart pattern in favor of the bears. The most likely occurrence is a continuation of higher prices.
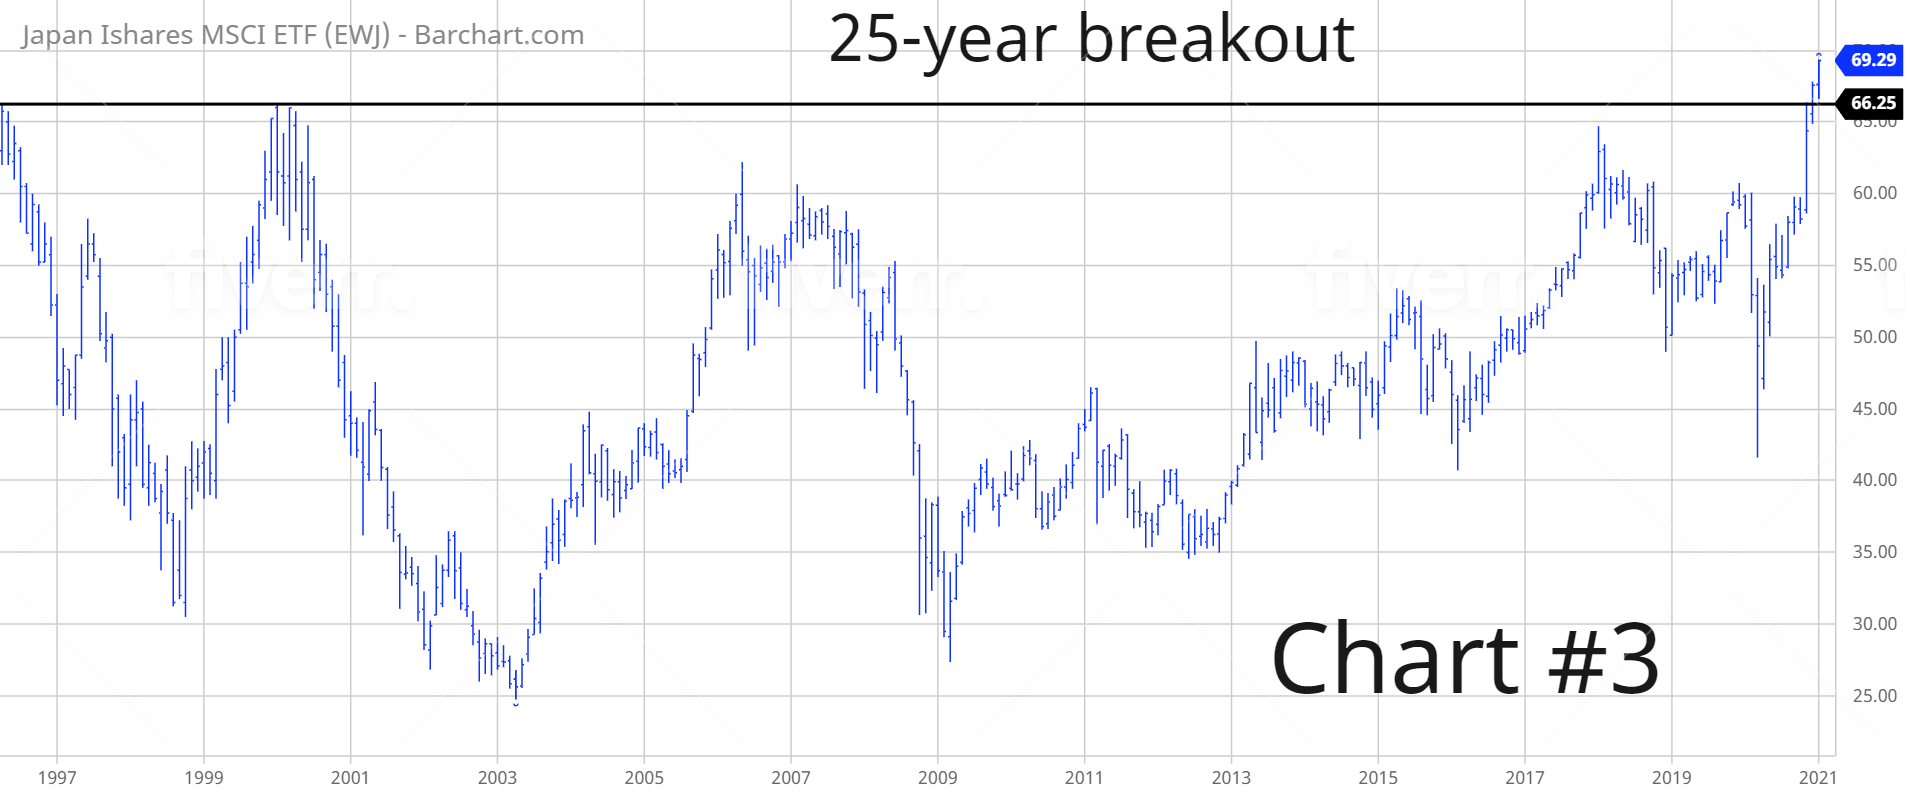
LONG-TERM CHART
Please review the 25-year chart of EWJ (Chart #3). In November 2020, the ETF completed a massive breakout when it penetrated 66.25. This is an incredibly bullish chart pattern. Most likely, EWJ will move sharply higher over the course of the next several years. In order to reverse the trend, the bears need a weekly close below 34.16. This type of decline seems highly unlikely based on the fact that global central banks are printing unlimited amounts of money in an effort to stimulate economic activity.