S&P 500 SPDR ETF (SPY)
Key Statistics (from 10/19/17)
Thank you for reading this post, don't forget to subscribe!Daily High 255.83 Short-Term Trend Bullish
Daily Low 254.35 Intermediate-Term Trend Bullish
Daily Close 255.79 Long-Term Trend Bullish
Minor Support Level 246.30 Minor Resistance Level 255.95
Major Support Level 173.71 Major Resistance Level 268.59
Minor Buy Signal 256.68 Minor Sell Signal 244.95
Major Buy Signal 269.56 Major Sell Signal 169.08
SHORT-TERM VIEW S&P 500 SPDR
Given that today is the 30-year anniversary of the greatest stock market crash of all-time (Black Monday), it’s only fitting that we review the S&P 500 SPDR ETF. Thirty years after the great crash, the United States equity markets are on the opposite side of the spectrum in comparison to October 19, 1987. Today, all major stock indices are in the midst of one of the greatest bull markets in the history of Wall Street. Of course, all good things must end. Eventually, this incredible stock market rally will reach its zenith and begin to roll over. However, at least for now, there appears to be no end in sight.
SPY recorded a new all-time high on Oct 18th @ 255.95. Obviously, the bulls are in complete control of this market. SPY continues to move relentlessly higher. There has been no meaningful correction for several months. The bears need a weekly close below 246.30 in order to move the short-term momentum in their favor.
SPY is extremely overbought in terms of its short-term stochastics reading. Therefore, the market could generate a brief correction in order to alleviate the overbought reading. For all practical purposes, stochastics indicators are rather unreliable when dealing with a powerful bull market. Trading vehicles like stocks, ETFs & commodities can remain chronically overbought for several weeks in a row. Therefore, it’s not a good idea to place too much emphasis on a stochastics indicator in the middle of a massive bull market (or bear market).
LONG-TERM VIEW S&P 500 SPDR
SPY has been in a secular bull market since March 2009. Many investors would argue that the current bull market is long in the tooth and way overdue for a multi-year decline. However, based on historical research, this is simply not the case.
There have been three secular bull markets since 1920 (not counting the current bull market). The average length of the previous secular moves is 16.7 years. Therefore, the current bull market could easily last until the mid-2020s. Of course, there’s no “magic rule” which says that all secular bull markets must last 16 years.
The shortest secular bull move lasted only eight years (1921 to 1929). The longest secular bull move occurred from 1942 to 1966 (24 years). Eventually, the current bull market will fizzle out and a new bear market will begin. It’s probably safe to conclude that today’s secular bull market will reach its conclusion somewhere between the two extremes (8 to 24 years).
Even though the current bull market has only been in existence for eight years, it feels much longer than eight years. Why? Because there has been no substantial correction for 103 consecutive months. This is the 2nd longest uninterrupted bull market of all-time. The longest uninterrupted bull market occurred from October 1990 thru March 2000 (113 months). This current bull run could easily break the record of 113 months. By the way, a “substantial correction” is defined as a decline of 20% or greater.
Many Wall Street analysts and financial experts claim the stock market is in a bubble; on the verge of a substantial decline. Certainly, a strong case could be made that equity prices are sharply overvalued. According to most valuation models, stocks certainly are not cheap. However, this won’t necessarily lead to a sharp decline. Stock markets can remain overvalued for years. However, there does appear to be a few warning signs on the horizon.
There is one major difference in today’s bull market versus previous bull markets which could cause all global equity prices to move substantially higher. During the past few years, central banks have been adding stocks to their balance sheets. Traditionally, major central banks only invested in government bonds. However, in an effort to stimulate the global economy, they recently introduced stock purchasing programs. Most likely, this explains why US equity prices have increased for 103 consecutive months without a correction.
It’s quite possible that equity prices will continue to move higher as long as central banks maintain their stock purchase programs. Consequently, the stock market could move dramatically higher over the course of the next few years. Without question, we are in unchartered territory in terms of central banks participating in the stock market. This type of activity has never occurred before. Therefore, it’s virtually impossible to determine the final outcome.
The next major resistance level for SPY is 268.59. Based on the current momentum of the stock market, it’s quite possible SPY will exceed 268.59 over the course of the next 4 to 6 months.
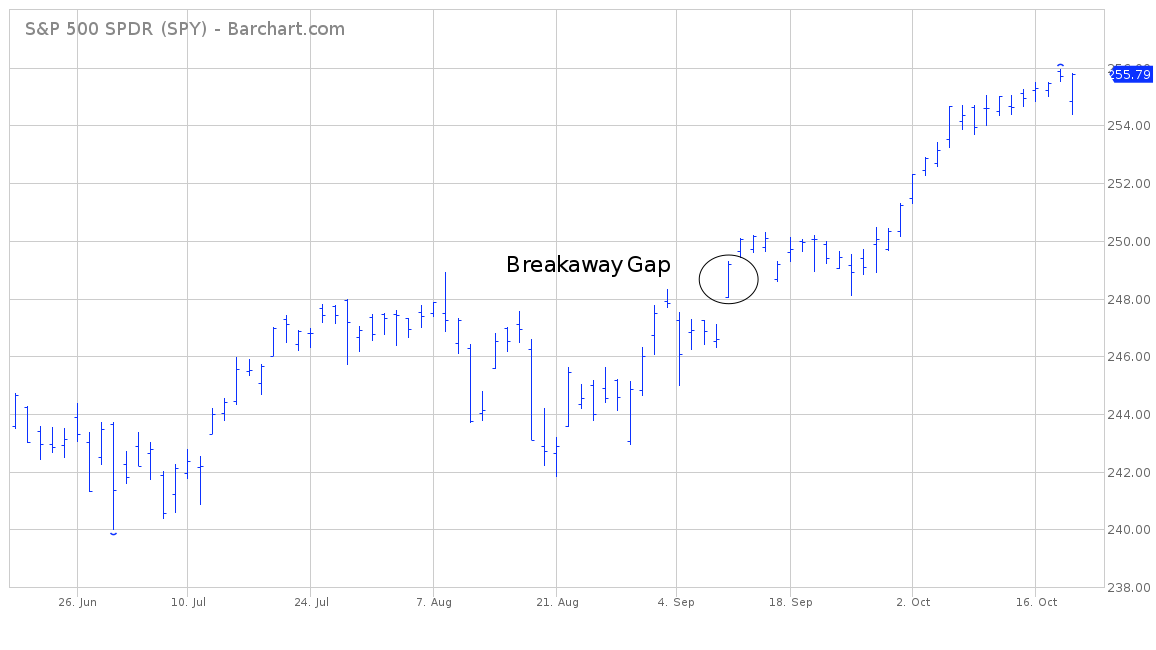
SHORT-TERM CHART
Please review the attached 4-month chart of SPY. The market generated a bullish breakaway gap on Sep 11th. The bulls are in complete control of SPY. The short-term chart pattern will continue to remain bullish as long as the gap remains unfilled. A weekly close below 246.30 will push the momentum in favor of the bears.

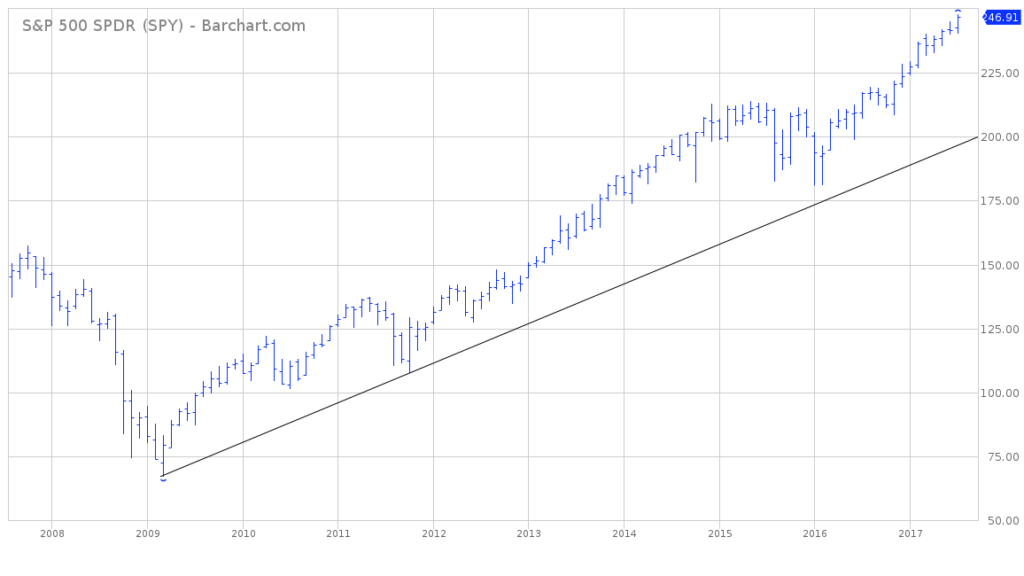
LONG-TERM CHART
Attached, you will find a 10-year chart of SPY. There’s no other way to describe this chart pattern but extremely bullish. SPY has been in an uninterrupted bull market for eight consecutive years. It doesn’t get more bullish than this. At least for now, there’s indication SPY will turn bearish any time in the near future.