20 Year Bond iShares TLT – Exchange Traded Fund
Key Statistics (as of 10/12/17)
Thank you for reading this post, don't forget to subscribe!Daily High 124.98 Short-Term Trend Bearish
Daily Low 124.24 Intermediate-Term Trend Bearish
Daily Close 124.95 Long-Term Trend Bearish
Minor Support Level 123.03 Minor Resistance Level 126.43
Major Support Level 112.73 Major Resistance Level 143.62
Minor Buy Signal 126.89 Minor Sell Signal 122.82
Major Buy Signal 146.73 Major Sell Signal 111.23
SHORT-TERM VIEW
It certainly appears the recent advance in 20 Year Bond iShares TLT ended on Sep 7th @ 129.56. The market enjoyed a nice rally during July & August. However, the bears have regained control of TLT on a short-term basis.
Based on the recent price action of TLT, long-term interest rates could be in the early stages of moving much higher over the course of the next several years. TLT has an inverse relationship to interest rates. As the price drops, long-term interest rates move higher. Conversely, when the price of TLT moves higher, interest rates drift lower. Given the fact that TLT has been pushing its way lower during the past four weeks, long-term interest rates have been moving higher.
At least for now, the bears have control of the short-term momentum. All three of the trend indicators are in bearish territory. In order to generate a more sustainable decline, the bears need a weekly close below 123.03. If the bulls want to recapture the momentum, they must push TLT above 126.43.
TLT is currently in neutral territory in terms of its stochastics reading. Therefore, the market could easily generate another leg to the downside before it becomes oversold.
LONG-TERM VIEW
Based on long-term historical data, interest rates tend to move in multi-decade cycles. It’s not uncommon for an interest rate cycle to last 30 to 40 years. Of course, it’s incredibly difficult to accurately forecast the beginning of a new interest rate cycle. Very often, it takes 3 to 4 years of price activity in order to determine if a new cycle is underway. There are many false breakouts and “head fakes” along the way.
It is quite possible that 20 Year Bond iShares TLT formed a multi-year top in July 2016 @ 143.62. Therefore, a new secular interest rate trend may have developed. If so, TLT could be in the early stages of a long-term decline. Of course, it’s too premature to boldly forecast the beginning of a new interest rate cycle.
The current interest rate cycle began in September 1981 (long before TLT became available for trading in 2002). Essentially, interest rates drifted lower for the next 35 years (1981 through 2016). Did a new interest rate cycle commence in July 2016 (as TLT was carving out a massive top)? The jury’s still out. In fact, a valid argument could be made in both directions.
Those who believe interest rates are still in a secular downtrend, would point to the fact that
inflationary expectations are trending near historically low levels. They also contend that global economic growth remains chronically weak. Additionally, they claim the Federal Reserve’s new restrictive monetary policy will continue to impede economic growth well into the end of this decade.
On the flipside, there are those investors who are convinced the 35-year interest rate cycle reached its final low in July 2016. They see interest rates moving steadily higher for the next decade or longer. Their argument is predicated on the assumption that investors will demand higher rates as the massive level of global government debt continues to expand. This expansion in debt will force all rates higher as investors seek to be compensated for the increased risk of owning government debt. This group also concludes that central bank quantitative easing (which began in 2009) is finally beginning to create inflationary pressures in the form of increased wages and rising industrial commodity prices.
Which side is correct? Are we in a new cycle of rising interest rates or will rates continue to drift lower as they have since 1981? On the surface, it definitely appears interest rates may have formed a secular low in July 2016. However, there is not enough empirical evidence to emphatically state that rates have indeed turned the corner and will push higher for the next several years.
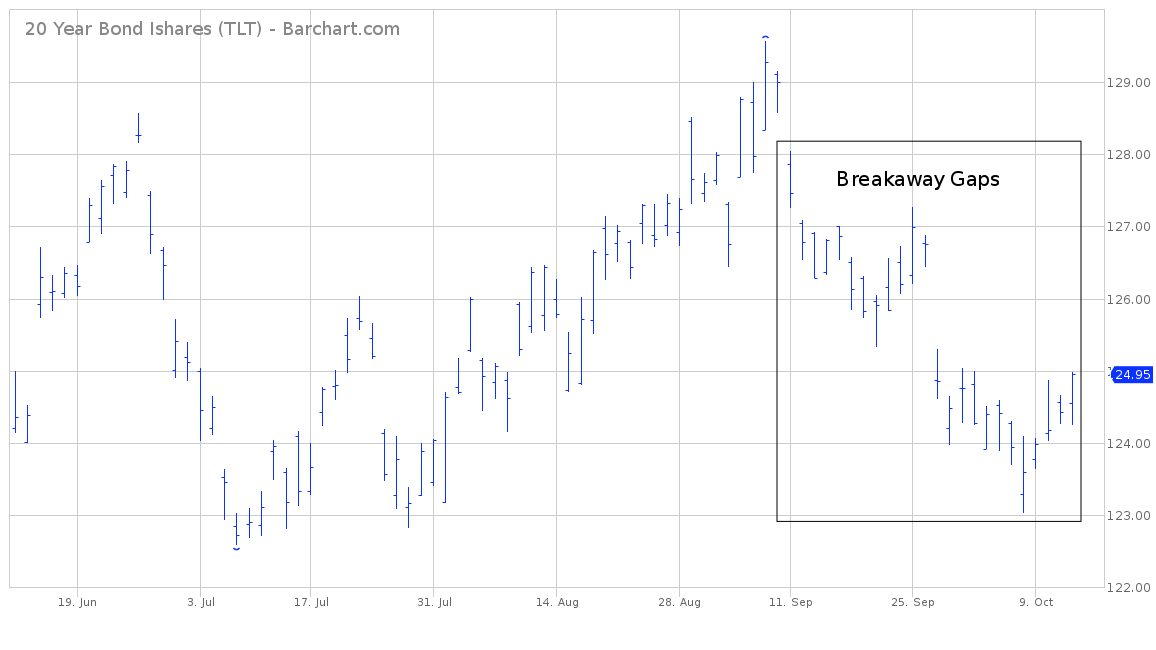
SHORT-TERM CHART
Please review the attached 4-month chart of 20 Year Bond iShares TLT. The market has generated three bearish breakaway gaps since Sep 11th (rectangular box). The short-term chart pattern is certainly in favor of the bears. A weekly close below 123.03 opens the door to much lower prices.
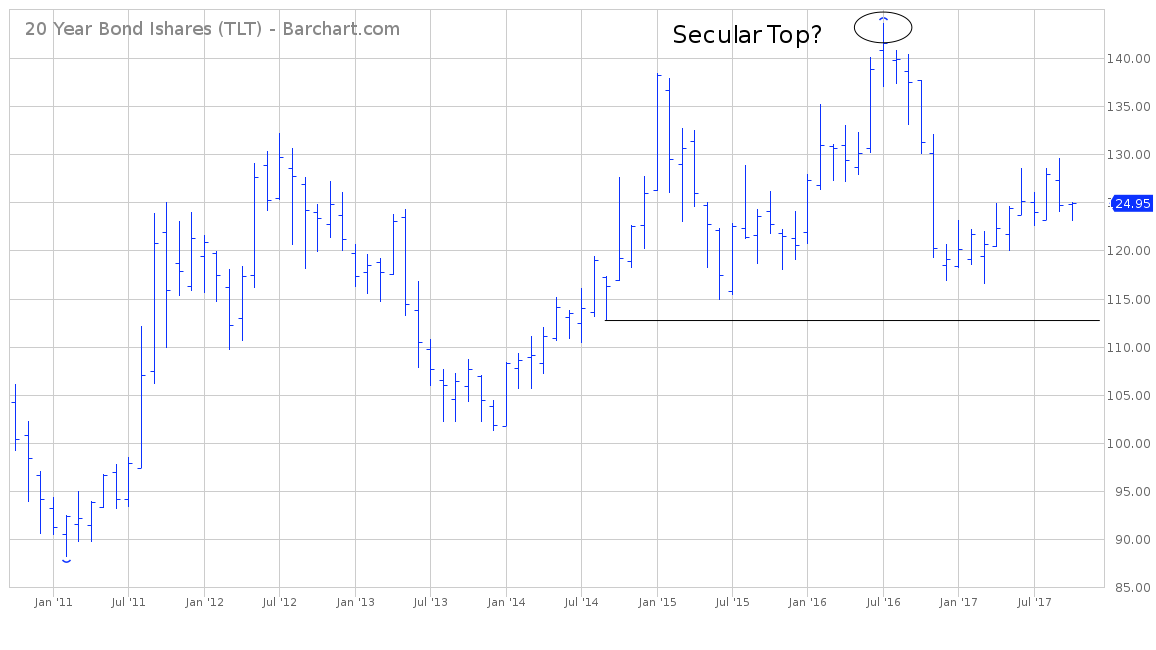
LONG-TERM CHART
Attached, you will find a 7-year chart of TLT. Based on the long-term chart pattern, TLT is still in a secular bull market (despite the sharp decline during the past 15 months). An argument could be made that TLT formed an important top in July 2016 @ 143.62. However, the bears need a close below 112.73 (horizontal line) to confirm July 2016 as a long-term top.