

SPDR S&P 500 ETF (SPY)
Key Statistics
Thank you for reading this post, don't forget to subscribe!
Minor Support Level 272.42 Minor Resistance Level 296.49
Major Support Level 107.43 Major Resistance Level 302.23
Minor Buy Signal 299.25 Minor Sell Signal 270.03
Major Buy Signal 322.07 Major Sell Signal 99.57
BRIEF OVERVIEW – SPY ETF
September will mark 126 months of uninterrupted bull market activity. This is the longest continuous bull market in the history of Wall Street, which dates back to 1792. In addition to being the most spectacular bull market of all-time, it also has the distinction of being the most hated and despised bull market in modern financial history. During the past decade, there has been an endless stream of professional investors, Wall Street money managers, individual traders and institutional portfolio managers who have absolutely despised this record-setting bull market. What’s so terrible about this bull market? Why do so many traders and investors have such disdain for today’s bull market? Additionally, is the bull market finally near the end of the line? Let’s explore the facts.
With the exception of the Great Depression of the 1930s, the 2008 Global Financial Crisis will go down in the history books as the most brutal economic disruption of the past 100 years. The global economy began to unravel in 2007, and reached its zenith in 2008. In terms of the equity markets, the bottom occurred on 6 March 2009. The S&P 500 formed a major bottom @ 666, not a very popular number in our society! All of the major stock market averages suffered brutal declines during the preceding 12 months. Officially, the S&P 500 lost 57.7% of its value.
In terms of market capitalization, investors lost $11 trillion. In addition to stock market losses, consumers experienced declines in real estate values, lost wages, as well as sharp declines in retirement accounts. In 2012, a nonprofit research firm known as Better Markets, conducted an extensive study based on government data and private research reports. Based on its findings, Better Markets concluded that American consumers lost $21.4 trillion as a result of the Global Financial Crisis.
Many investment professionals, financial reporters and individual investors were extremely critical of the Federal Reserve’s response to the crisis. They claimed that the Fed (in cooperation with the US Treasury Department) provided entirely too many financial bailouts to commercial banks, brokerage firms, investment banks, mortgage companies and other lending institutions. Those who were critical of the Federal Reserve’s plan of action, wanted the Fed to simply allow these financial institutions to fail (or be purchased by a healthy company).
At the opposite end of the spectrum, a large number of investors, financial professionals and members of the academic community were largely in favor of the Federal Reserve’s bailout proposal. They argued that the Fed (in addition to the Treasury Department) had no choice but to instigate a financial rescue plan in an effort to stabilize the global financial system.
Even though the Fed was largely uncertain on how the financial markets would react to its aggressive bailout package, they forged ahead with their plan of action. The Federal Reserve and the Treasury Department wasted very little time in launching their plan of action. Immediately following the collapse of Lehman Brothers on 15 September 2008, the Federal Reserve unveiled the first of many “alphabet soup” programs designed to stabilize the financial markets. Despite a heavy amount of criticism from the majority of the American public, the Fed succeeded in its efforts to stabilize the financial markets. In fact, the financial markets (particularly domestic stock indices) recovered much quicker than even the most bullish investors had expected. In retrospect, it certainly appears that the Federal Reserve’s plan to resurrect the global financial system was the catalyst that kickstarted the stock market’s record setting advance.
Looking back on the Federal Reserve’s aggressive bailout package coupled with the general public’s negative response to its plan of action, it now seems quite clear why today’s historic bull market is hated and despised by so many investors. Very few investors were never “on board” with the Fed’s financial bailout package. This explains why only a limited number of people have captured the huge advance in the stock market during the past decade. Additionally, the vast majority of the investment community remained on the sidelines because they were convinced that the Federal Reserve’s rescue plan would be a complete failure. They were betting that our nation’s monetary authorities would be unable to ignite a new bull market. Of course, it turns out that they were wrong.
As we mentioned earlier, the stock market is celebrating its 126th month of continuous bull market activity. Unfortunately, very few traders and investors are participating in this historic bull run. There’s really no reason to believe that the investor participation rate will improve any time in the near future. As long as the investor participation rate remains low, it increases the likelihood that the bull market will continue.
In an effort to provide investors with exposure to the S&P 500, the SPDR family of exchange traded funds introduced the S&P 500 ETF on 22 January 1993. The ticker symbol is SPY. The ETF allows investors to participate in the S&P 500 without the burden of owning shares of each company within the index. SPY is historically significant because it was the very first exchange traded fund (ETF) listed in the United States. SPY is easily the most heavily traded ETF, with daily volume usually exceeding 100 million shares.
SHORT-TERM VIEW
Despite a brief sell-off during the past few weeks, the short-term momentum is clearly in favor of the bulls. The next level of resistance is 296.49. In order to recapture the short-term momentum, the bears need a weekly close below 272.42. Based on the recent price action, the most likely scenario is a trading range between 272.42 and 296.49.
LONG-TERM VIEW
The S&P 500 consists of 11 individual sectors. These sectors are designed to provide an equal representation of the US economy. Each sector contains several publicly traded companies which form a small microcosm of our nation’s economy. Please review the following table.
Standard & Poor’s Stock Index
Stock Market Sectors
Sector 12M % Change Largest Company
Utilities 17.47% Nextera Energy
Real Estate 16.01% American Tower Corp
Consumer Staples 12.43% Wal-Mart
Communication Services 6.49% Alphabet
Information Technology 5.86% Microsoft
Consumer Discretionary 2.10% Amazon
Health Care (1.76%) Johnson & Johnson
Industrials (2.12%) Boeing
Materials (5.41%) Linde Plc
Financials (5.89%) Berkshire Hathaway
Energy (23.25%) Exxon Mobile
Source Standard & Poor’s
As we discussed briefly, the stock market has delivered 126 consecutive months of bull market activity. However, there are a few indicators which may suggest that the historical bull market formed an important top on 26 July. During the past six months, there has been a steady rotation out of the more speculative sectors within the S&P 500. This would include energy, financials and materials. Typically, these three sectors have a tendency to outperform all other sectors when the overall stock market is experiencing bullish price action. As you can see from the table, energy, financials and materials have generated the poorest rate of return during the past 12 months; particularly the energy sector.
Based on the data from the table, it’s very clear to see that investors have rotated out of the speculative sectors and into more defensive sectors like utilities and consumer staples. This is a clear sign that investors are preparing for a slowdown in the domestic economy. Generally speaking, the stock market performs poorly during periods of economic weakness. This explains why investors are rebalancing their portfolios in favor of less volatile sectors.
Of course, investors could be wrong concerning the likelihood of a major economic slowdown. During the past decade, professional investment advisors and Wall Street economists have erroneously forecasted a recession within the domestic economy on more than one occasion. Therefore, it is quite possible that the recent investor rotation into defensive sectors like utilities and consumer staples could be a mistake.
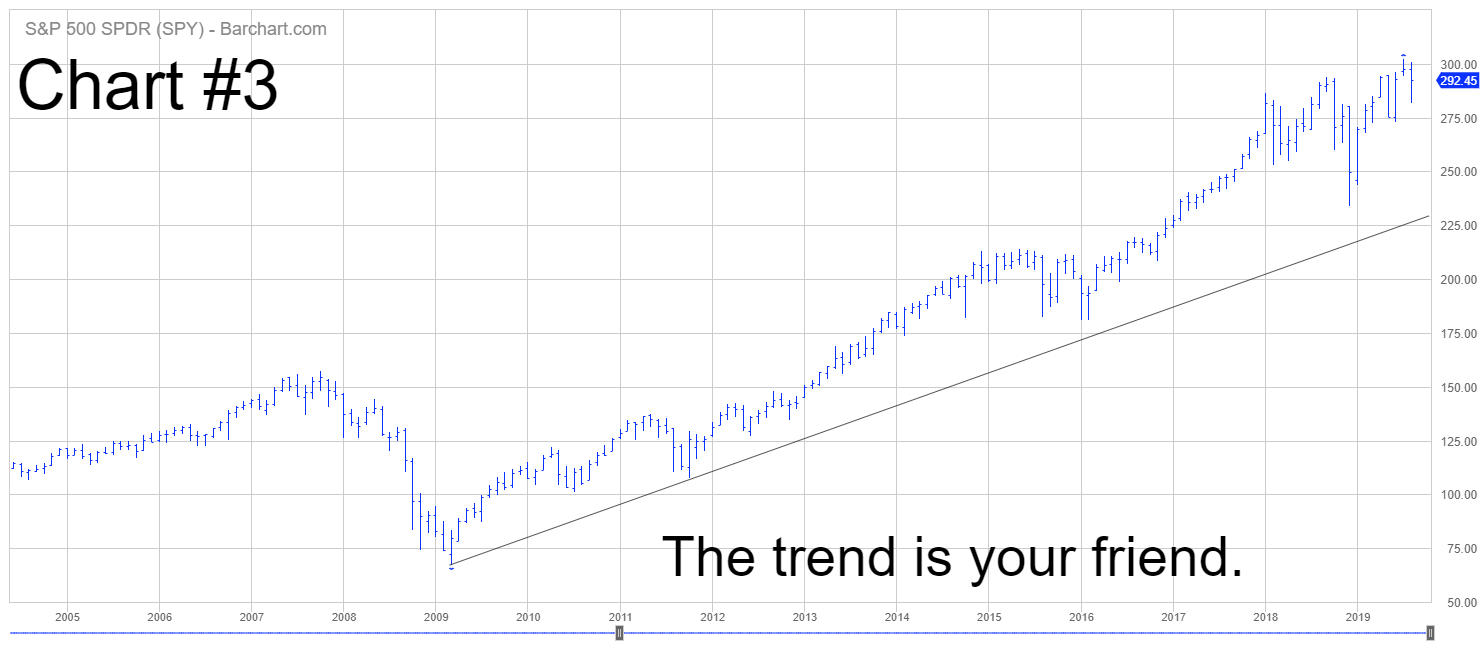
Very briefly, let’s examine a 9-month chart of the S&P 500 in an attempt to pinpoint the critical short-term support level (Chart #1). The first support level does not appear until 2722. Based on the current level of the S&P, the market would need to decline 7.0% in order to penetrate the initial support level. Although anything is possible, this type of decline seems rather unlikely in the near future. The last time the S&P 500 traded below 2722 was 8 March.
Ever since the United States entered a trade war with China in March 2018, several Wall Street money managers have been vocally forecasting a full blown bear market. As the global economy has slowed down during the past few months, these money managers have grown more vocal in their prognostication of a bear market. Despite their growing pronouncement of a bear market, the S&P in not even remotely close to bear market territory. It would take a drop of 504 S&P points to enter bear market territory. Possible but not likely. At least for now, the prospect of a bear market appears rather slim (despite the fact that investors are aggressively pursuing sector rotation).
In terms of SPY, the bulls are in complete control of the ETF. The next resistance level is 302.23. In order for the bears to gain the upper hand, a weekly close below 107.43 is needed. The most likely scenario is a continuation of the bull market.
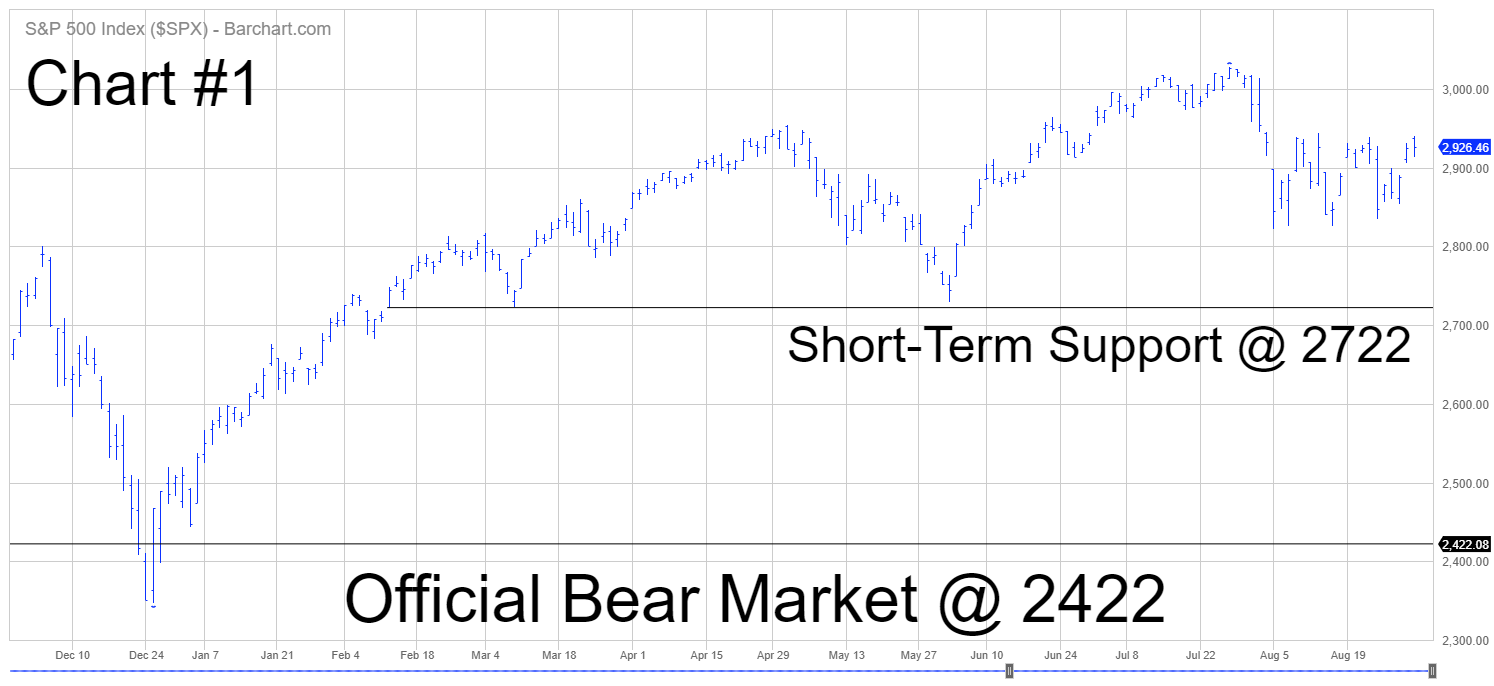
SHORT-TERM CHART
Please review the 9-month chart of SPY (Chart #2). Despite the recent sell-off, the short-term chart pattern is bullish. The next level of resistance is 296.49. The SPY chart will remain bullish until we see a weekly close below 272.42. Based on the recent price action, the most likely scenario is a trading range between 272.42 and 296.49.
LONG-TERM CHART
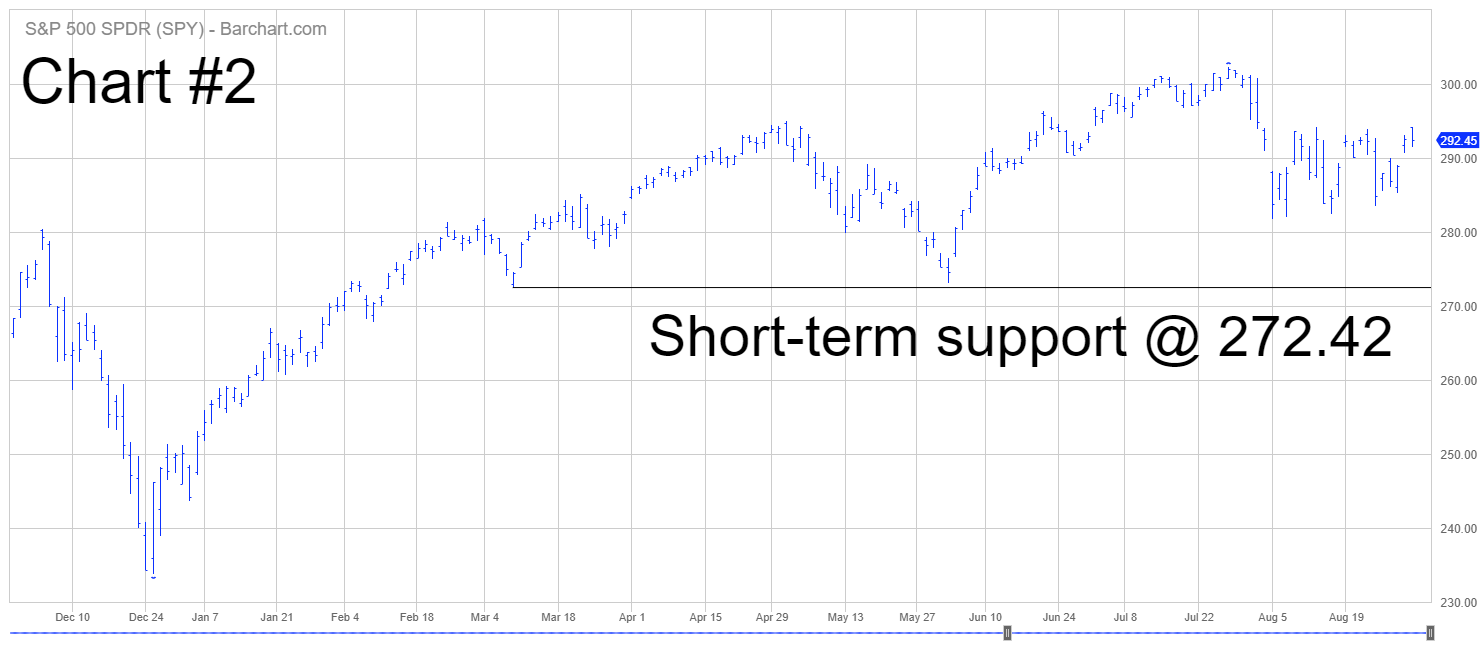
Please review the 15-year chart of SPY (Chart #3). The long-term chart pattern is incredibly bullish. Essentially, SPY has been grinding its way higher for the past 10 years (almost without interruption). This is one of the most bullish long-term chart patterns among all ETFs. The next resistance level is the all-time high @ 302.23. The bears need a weekly close below 107.43 in order to push the long-term trend in their favor.

