

Invesco QQQ ETF (QQQ)
Key Statistics
Minor Support Level 169.27 Minor Resistance Level 195.55
Thank you for reading this post, don't forget to subscribe!Major Support Level 41.77 Major Resistance Level 205.11
Minor Buy Signal 197.94 Minor Sell Signal 166.57
Major Buy Signal 212.28 Major Sell Signal 38.46
BRIEF OVERVIEW
The United States equity markets consist of approximately 6,300 companies listed on two major exchanges, the New York Stock Exchange and the NASDAQ Exchange. These two exchanges consist of five different stock indices.
- Dow Jones Industrial Average
- S&P 500
- Wilshire 5000
- NASDAQ Composite
- Russell 3000
Each index contains several different sub-indices. Arguably, the most popular sub-index is the NASDAQ-100. As the name implies, the NASDAQ-100 includes 100 of the largest domestic and international non-financial companies listed on the NASDAQ stock market based on market capitalization. The index reflects companies across major industry groups. The groups include computer hardware, computer software, telecommunications, retail trade and biotechnology. The index does not contain securities which represent financial or investment companies.
The NASDAQ-100 was launched on 31 January 1985. The base price of the index was initially set at 250. On 31 December 1993, the index was adjusted to 125 in order to allow for the trading of index options on the Chicago Board Options Exchange (CBOE) which was rolled out in 1994. In January 1998, foreign companies were allowed to be listed on the NASDAQ-100, which dramatically increased the popularity of the index with international investors. The popularity of the index began to rise substantially as the internet mania swept through the investment community beginning in 1998. The mania reached a fevered pitch in the Spring of 2000, as the NASDAQ-100 plateaued on March 24 @ 4,816. At one point during the internet mania, the NASDAQ-100 actually became more popular than the Dow Jones Industrial Average (DJIA). Of course, this was a perfect clue that we were in the midst of a giant bubble.
In an effort to provide investors with exposure to the NASDAQ-100, the PowerShares family of exchange traded funds launched the Invesco QQQ ETF on 10 March 1999, using the ticker symbol QQQ. This ETF allows investors the opportunity to track the performance of the NASDAQ-100. Although the index consists of 100 different companies, QQQ is comprised of 104 different securities. This discrepancy exists because three of the companies within the NASDAQ-100 have more than one class of common stock. These companies include Alphabet, Comcast and Facebook. The five largest holdings within QQQ are Microsoft, Apple, Amazon, Alphabet “C” and Facebook “A.” These stocks have a substantial impact on the overall performance of QQQ because they represent approximately 40% of the overall value of the ETF.
SHORT-TERM VIEW – QQQ
QQQ has enjoyed a massive rally during past six months. The bulls are in complete control of the short-term momentum. The next level of resistance is 195.55. Despite the fact that QQQ is trading at an all-time historic high, the ETF has managed to remain in neutral territory in terms of its upside momentum. This has prevented QQQ from reaching extreme overbought levels. Consequently, the bulls could easily continue to push the ETF higher before it reaches a speculative overbought phase. In order to regain the upper hand, the bears need a weekly close below 169.27.
LONG-TERM VIEW – QQQ
Arguably, the NASDAQ-100 is the most volatile stock index in North America. Why? Because the index consists primarily of technology stocks. Based on historical results, technology companies generate the most volatile and unpredictable revenue streams. Consequently, it’s very difficult for financial analysts to accurately forecast quarterly earnings results. Technology is constantly changing. This explains why these companies are difficult to analyze from a financial perspective.
For several decades, technology companies were completely avoided by most investors. They were considered much too volatile and unpredictable. Additionally, the investment community in the 1940s, 1950s and 1960s was extremely conservative. Many investors during this time period were involved in the stock market collapse of the 1930s. Therefore, they had absolutely no desire to participate in a highly speculative sector like technology. Instead, they preferred investing in conservative companies such as General Motors, General Electric, AT&T, US Steel and Proctor & Gamble.
Investors’ aversion to technology stocks began to change rather dramatically with the introduction of personal computers in the early-1980s. Companies like Apple, Microsoft, Intel and Advanced Micro Devices began to receive a great deal of attention from the investment community. The “technology revolution” was in full swing when the NASDAQ-100 arrived on the scene in January 1985. Almost immediately, the index began to outperform the majority of the “big three” indices, which included S&P 500, Dow Jones Industrial Average and Wilshire 5000. The NASDAQ-100 doubled within the first ten years of its existence.
In 1996, the index began to explode, as the World Wide Web was introduced to global consumers. Several new high flying technology companies were added to the NASDAQ-100 during the late-1990s and early-2000s. A few examples included Juniper Networks, Lycos, i2 Technologies, NVIDIA Corporation, JDS Uniphase and Broadcom Corporation.
As we discussed earlier, the NASDAQ-100 entered a mania phase beginning in 1998. From January 1998 through March 2000, the index rallied 385%. Of course, all manias eventually end in tears. The NASDAQ-100 peaked on 24 March 2000 @ 4,816. Over the course of the next 31 months, the index lost 83% of its value. The bubble had burst, as the US stock market lost over $5 trillion in market capitalization.
Following the bursting of the internet bubble, the entire technology sector quickly fell out of favor with investors, particularly those companies listed in the NASDAQ-100. The index essentially traded sideways for the next decade. Many of the high flying internet stocks declared bankruptcy or were taken over by other companies for a fraction of their valuation from the late-1990s.
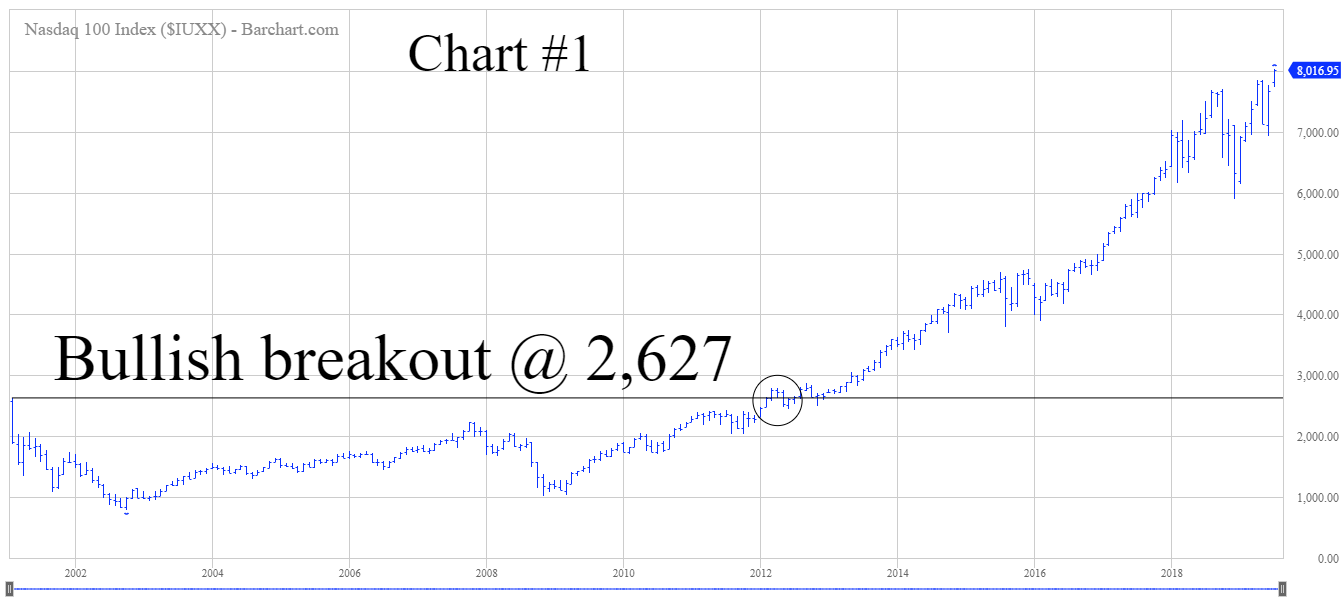
The NASDAQ-100 was locked in a trading range from 2002 through 2011. Finally, in February 2012, the index generated a bullish monthly breakout @ 2,627 (Chart #1). After trading sideways for ten years, the index had embarked upon a new long-term bull market. The majority of financial historians attributed the bull market to a new wave of technological innovations. These new innovations would include such things as the rise of social media, the global proliferation of cell phones and smart phones, Bluetooth technology, smart watches and other technological gadgets. Arguably, the greatest contributor to this new technology bull market was Satoshi Nakamoto’s unveiling of Bitcoin in January 2009 (including smart contracts and blockchain technology).
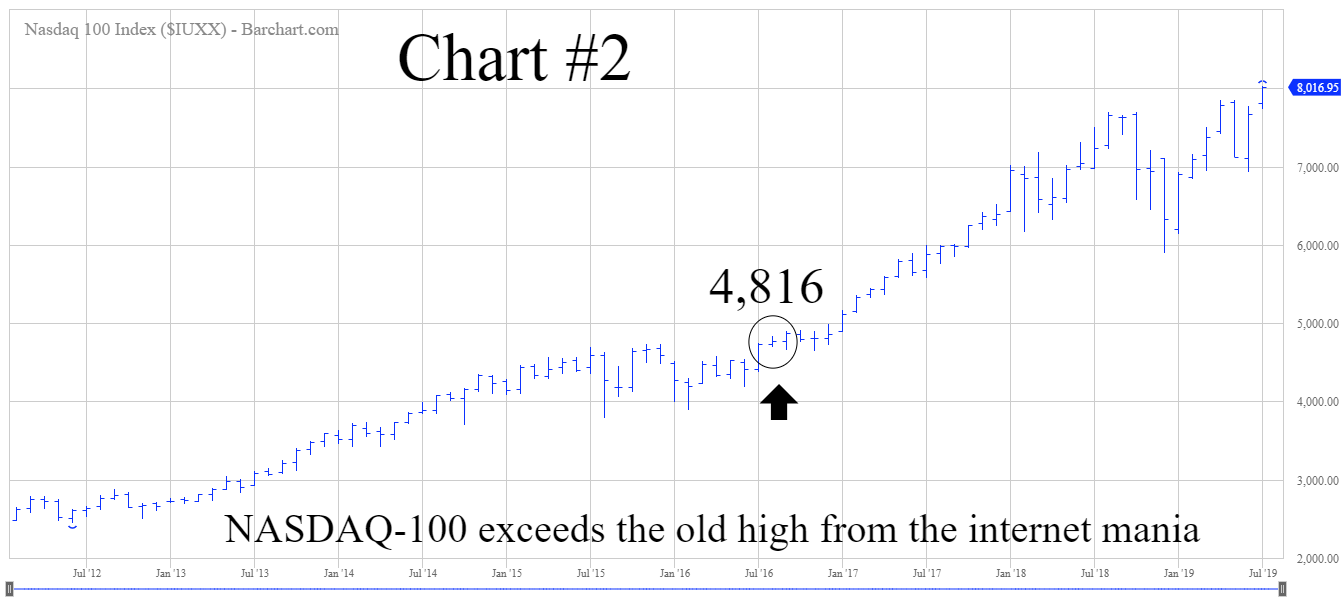
During the past few years, many professional investors and global money managers have predicted that these technological innovations will create a launching pad for a NASDAQ-100 bull market which will far exceed most investors’ expectations in terms of price levels and duration. So far, this forecast has proven to be correct. The NASDAQ-100 is in the eighth year of a new cyclical bull market (Chart #2). In August 2016, the index exceeded the previous all-time high from the days of the internet mania @ 4,816. Today, the NASDAQ-100 is trading at a new historic high of 8,016. The index has increased 205% since the new bull market began in February 2012.
The current NASDAQ-100 bull market is completely different compared to the bull market from the internet mania of the late-1990s. Today’s technology bull market has risen in a much more conservative fashion. The investment community has taken a more measured approach in terms of exposing their portfolios to the NASDAQ-100. There is absolutely no sign of a speculative top in the NASDAQ-100. In fact, the vast majority of the investment community has missed this bull market. Why? Because investors are paranoid about getting trapped in another financial crisis similar to 2008. Consequently, a large percentage of investors have remained on the sidelines for the past decade. The recent advance in the NASDAQ-100 has been one of the most hated bull markets in the history of Wall Street. Therefore, the current bull market could easily continue for several more years.
In regard to QQQ, the ETF has enjoyed the same bull market advance as the NASDAQ-100. However, public participation has been rather muted, very similar to the NASDAQ-100. The long-term view is clearly in favor of the bulls. The next resistance level is 205.11. In order to reverse the long-term momentum, the bears need a weekly close below 41.77. Of course, this type of decline is highly unlikely in the foreseeable future.
SHORT-TERM CHART – QQQ
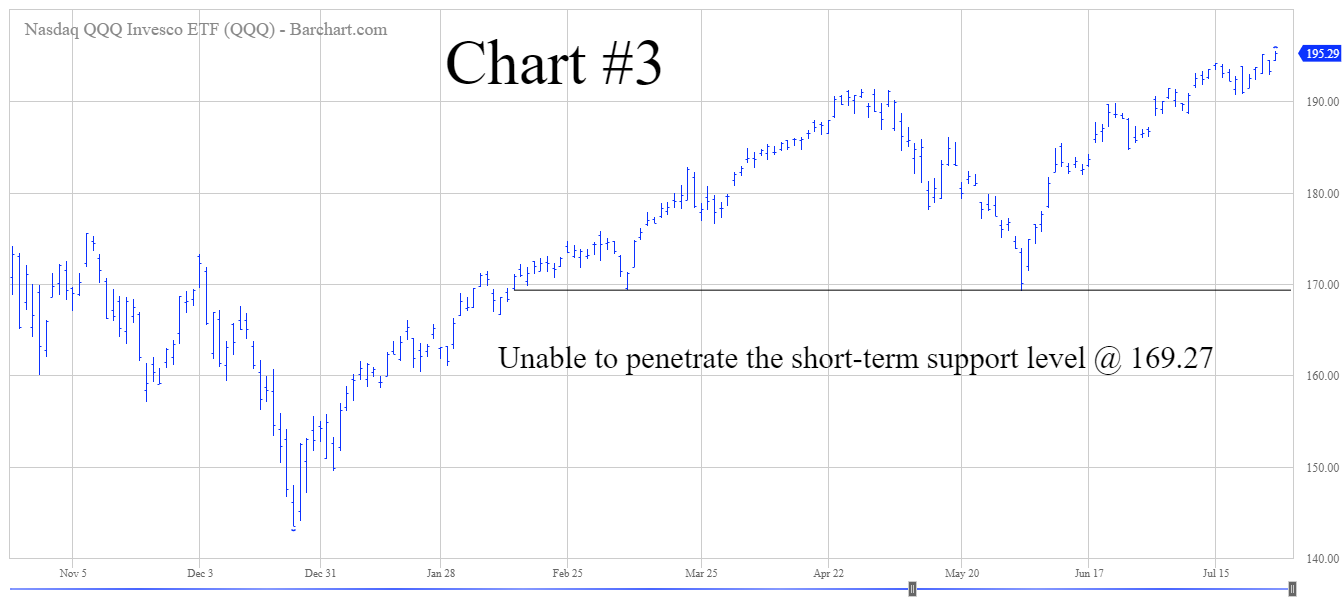
Please review the 9-month chart of QQQ (Chart #3). In terms of the short-term chart pattern, the ETF has been pushing its way higher since December 2018. There was a brief decline in May. However, the bulls managed to quickly re-establish the upward bias. The next level of resistance is 195.55. In order to regain the upper hand, the bears need a weekly close below 169.27.
LONG-TERM CHART – QQQ
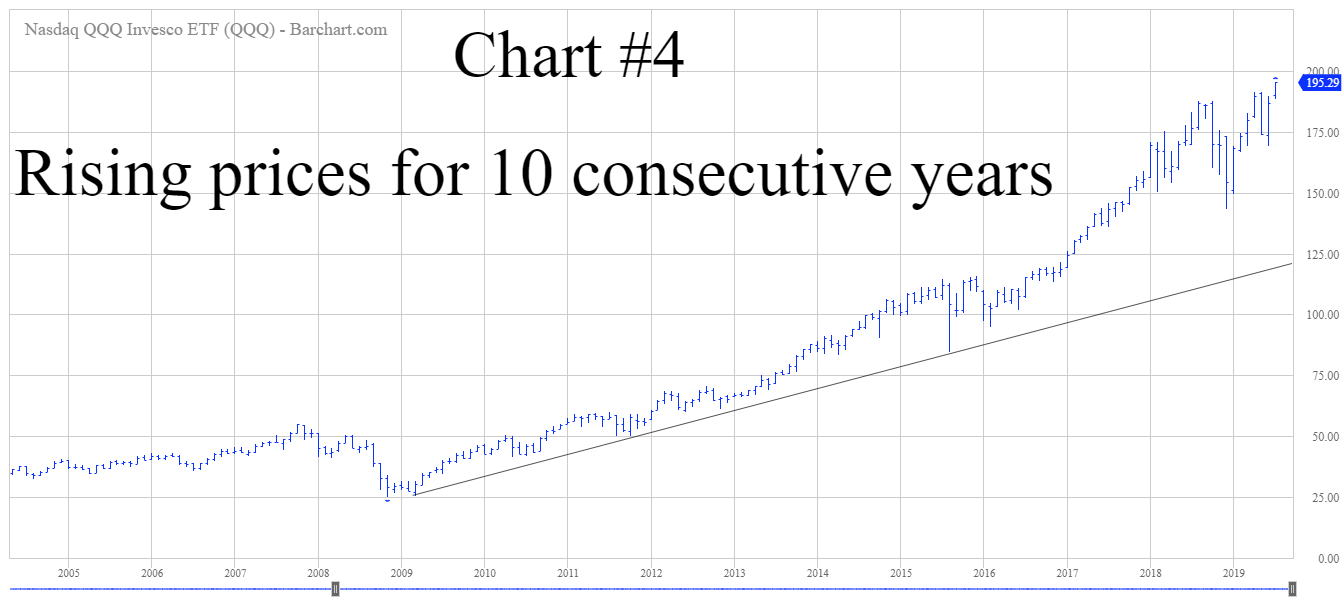
Please review the 15-year chart of QQQ (Chart #4). The long-term chart pattern has been continuously bullish since November 2008. This is one of the most bullish chart patterns within the entire ETF universe. At least for now, the bears have very little chance to push the chart pattern in their favor. A weekly close below 41.77 will reverse the trend from bullish to bearish. Highly unlikely.

