SPDR Dow Jones Industrial Average ETF (DIA)
Key Statistics
Minor Support Level 250.51 Minor Resistance Level 271.76
Thank you for reading this post, don't forget to subscribe!Major Support Level 80.96 Major Resistance Level 284.63
Minor Buy Signal 273.99 Minor Sell Signal 247.04
Major Buy Signal 298.65 Major Sell Signal 64.78
BRIEF OVERVIEW – DIA Dow Jones Exchange Traded Fund
By far, the most popular stock market index is the Dow Jones Industrial Average (DJIA). When people discuss the stock market, 99% of the time they are referring to DJIA. Why is this stock market index so popular and, more importantly, what is the future price direction of the Dow Jones Industrial Average? In order to answer these questions, let’s take a brief journey through the history of this celebrated stock index.
The Dow Jones Industrial Average (colloquially known as “the Dow”) was created by Charles Dow and his business associate, Edward Jones. The launch date was 26 May 1896. The first official closing price of the index was 62.76.
During the first 32 years of its existence, the Dow consisted of only 12 companies. In 1928, the index was expanded to include a total of 30 different companies. Although the companies within the index have changed over the years, the number of stocks that comprise the Dow has held steady at 30 since 1 October 1928.
Original 12 Companies of DJIA
26 May 1896
American Cotton Company American Sugar Company American Tobacco Company
Chicago Gas Company Distilling & Cattle Feeding Co General Electric
Laclede Gas Company National Lead Company North American Company
Tennessee Coal & Railroad Co US Leather Company US Rubber Company
Original 30 Companies of DJIA
1 October 1928
Allied Chemical American Can American Smelting
American Sugar American Tobacco Atlantic Refining
Bethlehem Steel Chrysler General Electric
General Motors General Railway Signal Goodrich
International Harvester International Nickel Mack Truck
Nash Motors North American Co Paramount Publix
Postum Inc Radio Corporation Sears Roebuck & Company
Standard Oil Texas Company Texas Gulf Sulphur
Union Carbide US Steel Victor Talking Machine Co
Westinghouse Electric Woolworth Wright Aeronautical
Dow Jones Industrial Average
7 October 2019
3M American Express Apple
Boeing Caterpillar Chevron
Cisco Cocoa-Cola Disney
DowDuPont Exxon Mobile Walgreens
Goldman Sachs Home Depot IBM
Intel Johnson & Johnson JPMorgan Chase
McDonald’s Merck Microsoft
Nike Pfizer Procter & Gamble
Travelers Companies Inc United Technologies UnitedHealth Group
Verizon Visa Wal-Mart
As you can see from the list, none of the original companies from 1928 are members of today’s Dow Jones Industrial Average. All of the companies have slowly disappeared through mergers, takeovers, acquisitions, buyouts, consolidations or bankruptcies. This dissolution of all the original Dow stocks is a perfect example of how industries are constantly changing and evolving. The global economy is in a constant state of flux, particularly as it relates to technology. Fifty years from now, all of today’s “high flying” companies will be reduced to relative obscurity. They will be replaced by something “bigger and better.”
The SPDR family of exchange traded funds (underwritten by State Street Global Advisors) introduced the Dow Jones Industrial Average ETF on 14 January 1998. The ticker symbol is DIA. This ETF is a perfect vehicle for investors who wish to participate in the performance of DJIA. DIA is an extremely popular ETF, with an average daily volume of nearly six million shares. The ETF is commonly referred to as “Diamonds.”
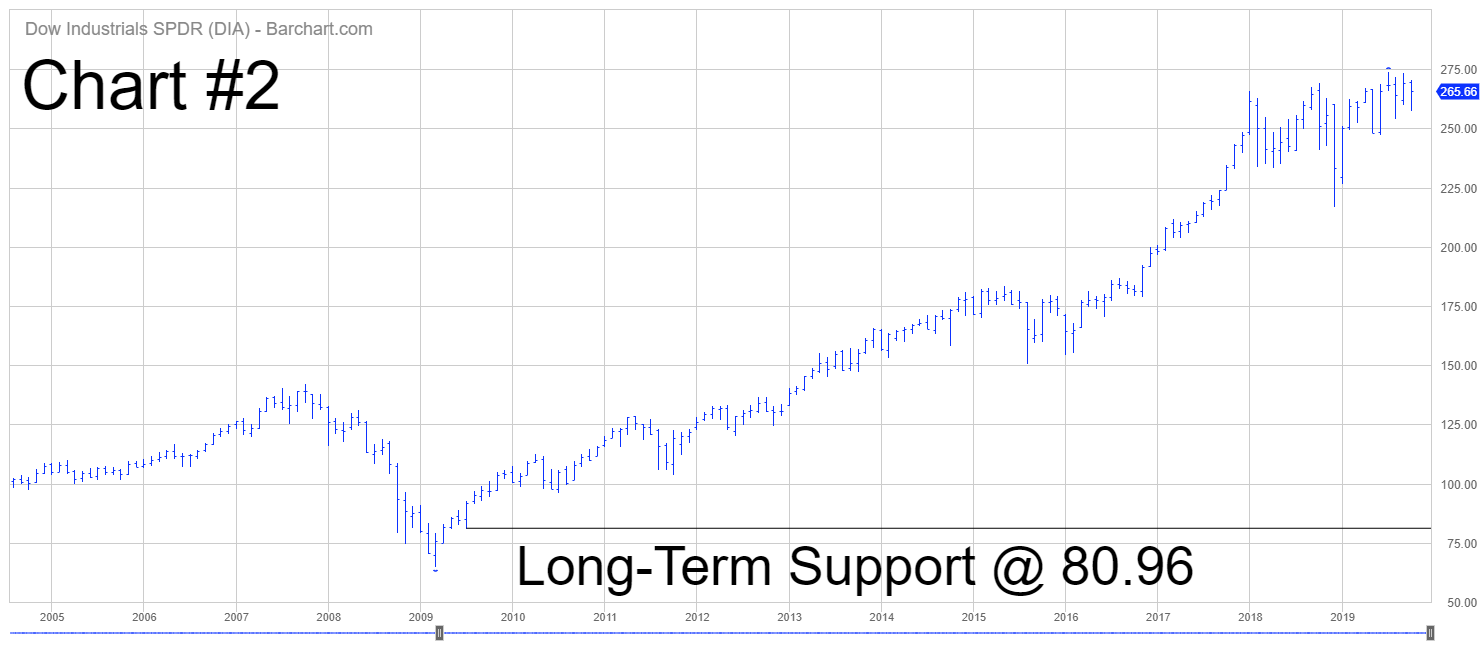
SHORT-TERM VIEW – DIA Dow Exchange Traded Fund
Despite the recent decline, the bulls are in complete control of the short-term momentum. The next level of resistance is 271.76. The bulls have been in control of DIA for the past seven months. In order to recapture the short-term momentum, the bears need a weekly close below 250.51.
LONG-TERM VIEW – DIA Dow Exchange Traded Fund
The stock market is currently enjoying the greatest bull run of all-time. 6 October will mark 127 months of uninterrupted bull market activity. This is the longest continuous bull market in the history of Wall Street, which dates back to 1792. Eventually, all bull markets must end. This bull market will be no exception.
During the past few years, there has been a laundry list of newsletter writers, professional money managers, Wall Street gurus, investment advisors and technical analysts who have been forecasting a major top in the stock market. So far, their analysis has been 100% wrong. Despite their uber bearish forecasts, equity prices continue to grind higher.
Why do so many traders and investors continue to remain bearish despite the fact that their forecasts have been chronically wrong for the past 3 to 5 years? The vast majority of the professional investment community completely missed the bear market of 2008 and 2009. Most of the popular averages declined 50% to 60% during this brutal bear market. In terms of percentages, it was one of the worst bear markets since the 1930s. This explains why a large number of today’s investors continue to remain bearish despite the fact that there is limited evidence to support their bearish argument. They are paranoid about missing the next bear market. Most likely, they will continue to remain bearish until the stock market actually generates a nasty decline.
Is there any evidence to support their bear market forecast? The answer is “Yes.” Based on historical results, one of the best indicators for predicting an impending bear market is an unraveling of the IPO market. For those of you who are not familiar with the term, an IPO is an initial public offering. An IPO occurs when a privately held company decides to issue shares of its company stock to the general public. The company stock becomes publicly traded on a stock exchange, usually the NYSE or NASDAQ.
During periods of rising stock prices, the IPO market is extremely active. New companies are taking advantage of a strong economy and a rising stock market by switching from privately held to publicly held. In a bull market, IPOs are typically quite profitable for investors. The vast majority of IPOs usually trade well above their IPO price during the first 12 months following the launch date. As long as the IPO market is active and healthy, it’s highly unlikely that the overall stock market will suffer a long-term bear market decline. This explains why professional money managers pay close attention to IPO activity. It’s usually the first sign of trouble in a bull market.
During the past few months, the IPO market has been losing its momentum. Several IPOs have been cancelled or delayed. Additionally, the overwhelming majority of the companies that became publicly traded in 2019, have provided investors with sub-par performance results. Please review the following table.
2019 Initial Public Offerings
Performance Results
Company IPO Price Current Price % Return
Greenlane Holdings 17.00 3.58 (78.9%)
Super League Gaming 11.00 4.10 (62.7%)
Sundial Growers 11.00 4.67 (57.5%)
Wanda Sports Group 8.00 4.01 (49.9%)
UP Fintech Holding Ltd 8.00 4.11 (48.6%)
Lyft 72.00 39.16 (45.6%)
Livongo Health 28.00 17.32 (38.1%)
SmileDirectClub 23.00 14.72 (36.0%)
Uber Technologies 45.00 29.67 (34.1%)
Peloton Interactive 29.00 23.01 (20.6%)
This table contains a list of the most highly publicized IPOs of 2019. As you can see, all companies on the list are trading well below their IPO price. This is a sign that investors are losing their appetite for high risk investments. Typically, this type of price action does not bode well for the overall stock market. Of course, not all of the IPOs in 2019 are underwater. Several companies have performed quite well. If you want to view a complete list of all IPOs for 2019, please visit www.iposcoop.com.
In terms of the current trend, the bulls are in complete control of DIA. At least for now, the weakness in the IPO market has not changed the long-term bullish momentum. The next resistance level is 284.63. In order for the bears to gain the upper hand, a weekly close below 80.96 is needed.
SHORT-TERM CHART – DIA Dow Exchange Traded Fund
Please review the 6-month chart of DIA (Chart #1). Despite the recent sell-off, the short-term chart pattern is bullish. The next level of resistance is 271.76. Eventually, the weakness in the IPO market will push the momentum in favor of the bears. The important number to watch is a weekly close below 250.51.
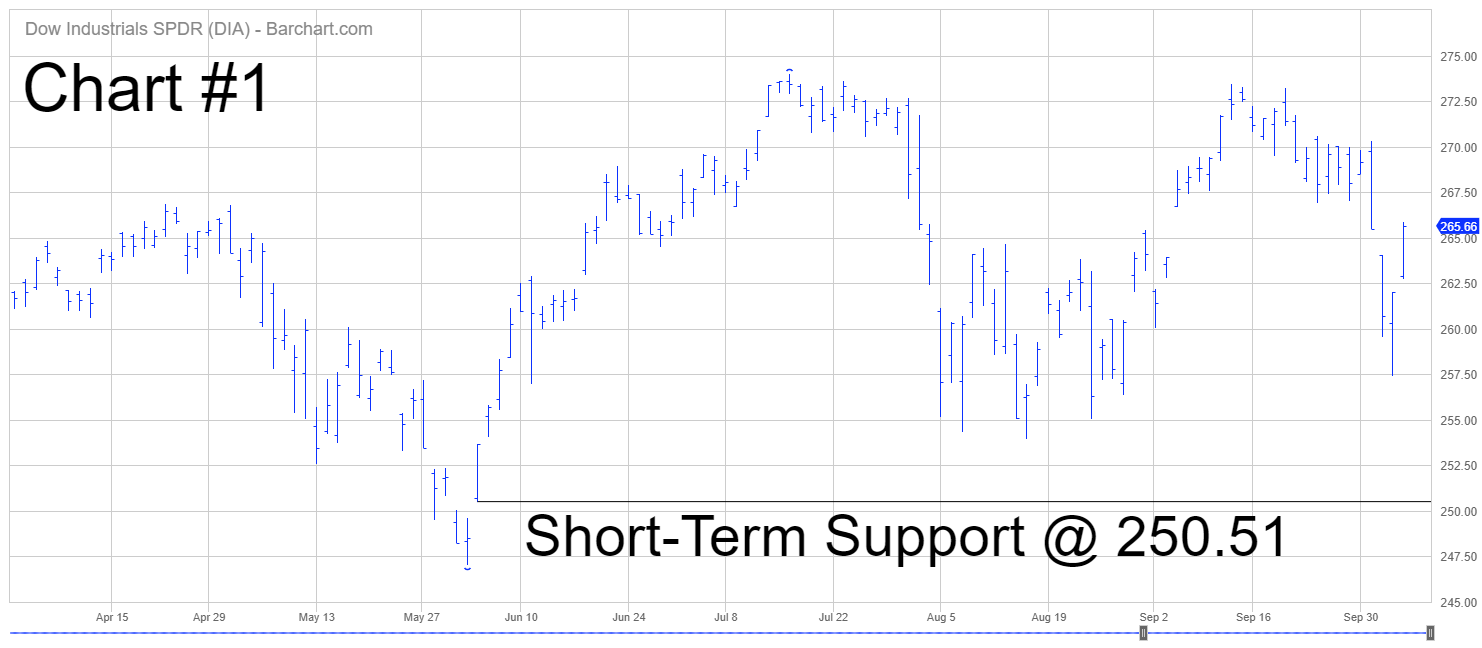
LONG-TERM CHART – DIA Dow Exchange Traded Fund
Please review the attached 15-year chart of DIA (Chart #2). The bulls are in complete control of the long-term chart pattern. The next resistance level is 284.63. In order for the bears to gain the upper hand, a weekly close below 80.96 is needed. The bulls have been in control of the long-term trend for several years. Eventually, the trend will flip from bullish to bearish. The recent weakness in the IPO market could be the catalyst.