

iShares Russell 2000 ETF (IWM)
Key Statistics – IWM iShares Russell 2000 ETF
Thank you for reading this post, don't forget to subscribe!
Minor Support Level 147.18 Minor Resistance Level 163.33
Major Support Level 41.11 Major Resistance Level 180.54
Minor Buy Signal 164.54 Minor Sell Signal 145.48
Major Buy Signal 183.67 Major Sell Signal 34.26
BRIEF OVERVIEW – IWM iShares Russell 2000 ETF
What are small-cap stocks and why should investors pay attention to these types of securities? Small-cap is a term used to classify companies with a relatively small market capitalization. For those who may not be familiar with the term, market capitalization is simply the market value of a company’s outstanding shares. For example, let’s assume XYZ Widget Company has 10 million outstanding shares selling at $40 per share. Therefore, the company’s market capitalization is $400 million.
Although there is no precise definition within the investment community, a small-cap stock is defined as a company with a market capitalization between $300 million and $2 billion. Please review the following table for a complete list of all market capitalization categories.
Market Capitalization Categories
Capitalization Category Market Capitalization Example
Nano-Cap Less than $50 million MJ Holding
Micro-Cap $50 million to $300 million Celcuity
Small-Cap $300 million to $2 billion Carbonite
Medium-Cap $2 billion to $10 billion US Steel
Large-Cap Greater than $10 billion Amazon
Historically, small-cap stocks have outperformed their large cap counterparts. This explains why many investors are drawn to these types of securities. Why do small-caps typically outperform companies with a larger market capitalization? Let’s review a few of the main reasons.
First, small-cap securities are outside of the investment universe of most institutional fund managers. As a result, this creates less demand for shares, which reduces their prices and creates better buying opportunities. Value investors love the fact that fund managers typically ignore small-cap securities because it creates far more mispriced investment opportunities versus large-cap securities.
Second, small-cap stocks have a tendency to grow more quickly than medium-cap or large-cap companies. This is due to the fact that there is simply less competition and more room to grow when a company’s market cap is $500 million (for instance) in comparison to $50 billion.
Third, companies with a small market capitalization rarely pay dividends. Instead, the companies generally plow every bit of their earnings back into the company in order to expand the business in an effort to increase market share. In contrast, large cap businesses are usually content to maintain the status quo and reward shareholders with dividend payments.
Of course, small-cap securities are saddled with an added degree of risk. Typically, these companies are highly leveraged in regard to debt as well as erratic earnings potential. Therefore, investors need to do their homework before adding these securities to their portfolios.
In an effort to provide investors with exposure to small-cap stocks, the iShares family of exchange traded funds (managed by BlackRock) introduced the Russell 2000 ETF using the ticker symbol IWM. The launch date was May 22, 2000. IWM is designed to track the performance of the Russell 2000, which is an index comprised of 2,000 small-cap domestic stocks. The top five holdings include Nektar Therapeutics, Bluebird Bio Inc, Grubhub Inc, Sage Therapeutics and Aspen Technology Inc.
SHORT-TERM VIEW – IWM iShares Russell 2000 ETF
The bulls have complete control of IWM. In fact, the ETF generated a new all-time high on
May 22nd @ 163.33. In order to reverse the bullish momentum, the bears need a weekly close below 147.18. The most likely scenario is a continuation of higher prices.
Based on the Aroon Oscillator, IWM has a moderately overbought reading of +60. The Aroon Oscillator is programmed differently than most stochastic indicators. The oscillator fluctuates between -100 and +100. A reading of 0 would indicate a neutral position. Therefore, a reading of +60 with IWM is considered moderately overbought. Most likely, the ETF is fairly close to a short-term top.
LONG-TERM VIEW – IWM iShares Russell 2000 ETF
From a long-term perspective, small-cap stocks have an excellent track record of determining major moves in the overall stock market. In other words, small-cap stocks can be used as a
forecasting mechanism. Please review the following tables.
Russell 2000 vs S&P 500
Performance Results
Year Russell 2000 S&P 500
1990 (21.46%) (6.56%)
1991 43.68% 26.31%
1992 16.36% 4.46%
1993 17.00% 7.06%
1994 (3.18%) (1.54%)
1995 26.21% 34.11%
1996 14.76% 20.26%
1997 20.52% 31.01%
1998 (3.45%) 26.67%
1999 19.62% 19.53%
Russell 2000 vs S&P 500
Performance Results
Year Russell 2000 S&P 500
2000 (4.20%) (10.14%)
2001 1.03% (13.04%)
2002 (21.58%) (23.37%)
2003 45.37% 26.38%
2004 17.00% 8.99%
2005 3.32% 3.00%
2006 17.00% 13.62%
2007 (2.75%) 3.53%
2008 (34.80%) (38.49%)
2009 25.22% 23.45%
Russell 2000 vs S&P 500
Performance Results
Year Russell 2000 S&P 500
2010 25.31% 12.78%
2011 (5.45%) 0.00%
2012 14.63% 13.41%
2013 37.00% 29.60%
2014 3.53% 11.39%
2015 (5.71%) (0.73%)
2016 19.48% 9.54%
2017 13.14% 19.42%
In terms of overall performance, small-cap stocks (as measured by the Russell 2000) have outperformed large-cap stocks (as measured by the S&P 500). Over the course of the past 27 years (1990 thru 2017), investors would have enjoyed a greater rate of return by participating in the Russell 2000.
If we dig a little deeper by examining the individual years, it’s worth noting that the Russell 2000 has a tendency to outperform the S&P 500 just prior to the start of a bull market. For example, 1991 marked the beginning of an historic bull market which lasted throughout the entire decade of the 1990s. Small-cap stocks easily outperformed their large-cap counterparts in 1991, setting the stage for a multi-year advance in stock prices.
The same pattern occurred in 2001, as the Russell 2000 beat the S&P 500 by 14.07%. 2001 turned out to be the launching pad for a six-year advance in equity prices. A similar setup appeared in 2008 and 2009, when the small-cap stocks outpaced the large-cap stocks, thus generating a buy signal. Stocks have moved relentlessly higher for the past seven years, with the small-caps leading the way. By the way, it’s worth noting that this is not a new occurrence. There are several examples of this pattern throughout the 1970s and 1980s.
Why does this investment phenomenon occur? Why do small-caps stocks have a tendency to flash a “buy signal” just prior to the beginning of an advance in equity prices? The answer is based on the fact that small-cap companies typically employ a much more aggressive business model versus their large-cap competitors. They are constantly “pushing the envelope” in regard to maximizing sales and capturing as much market share as possible.
As the economy enters a new growth phase (i.e. 1991, 2001 and 2009), small-cap companies are the major beneficiaries of this new surge in business activity. These companies easily outperform the large-cap firms, who follow a more conservative business operation. This explains why small-cap stocks outperform large-cap stocks during the first 12 to 24 months of a new economic cycle.
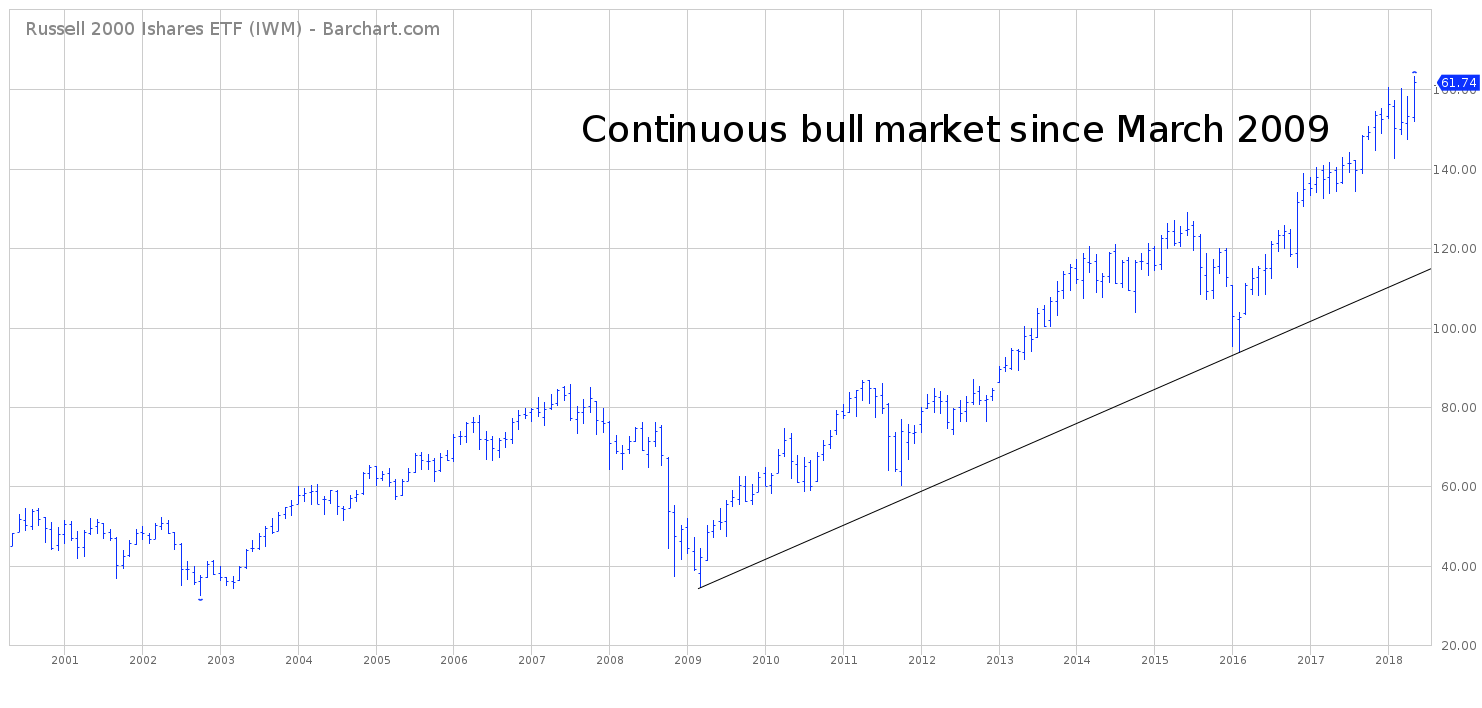
In regard to IWM, the long-term view is extremely bullish. Essentially, IWM has been moving continuously higher since the ETF formed an important bottom in March 2009. There appears to be no end in sight. As long as IWM stays above 41.11 on a weekly closing basis, the path of least resistance is to the upside.
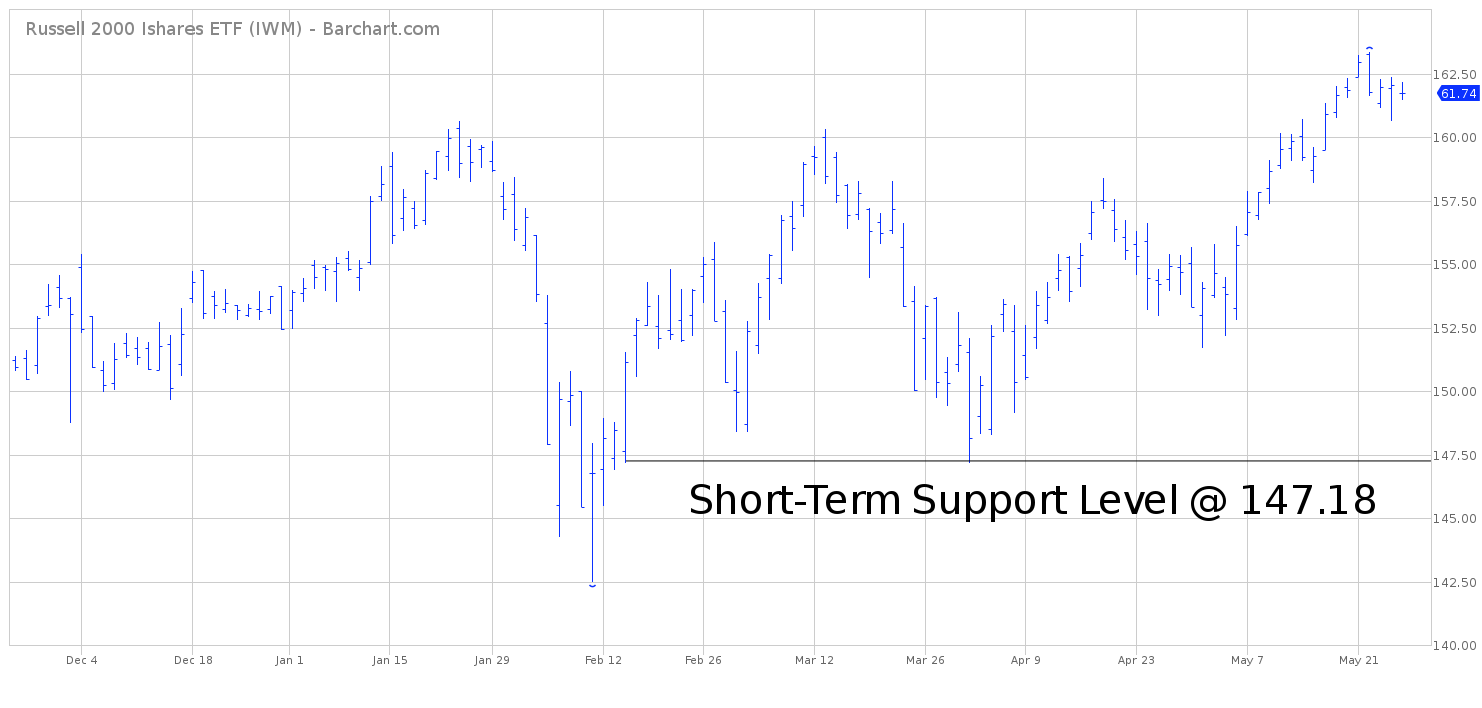
SHORT-TERM CHART – IWM Russell 2000 ETF
Please review the 6-month chart of IWM. The chart pattern remains quite bullish. The next resistance level is the May 22nd high @ 163.33. A weekly close above 163.33 opens the door to 164.54. A weekly close below 147.18 will reverse the trend from bullish to bearish.
LONG-TERM CHART – IWM Russell 2000 ETF
Please review the 18-year chart of IWM. This chart covers the entire trading history of the ETF. The long-term chart pattern of IWM is incredibly bullish. The first sign of trouble would be a penetration of the 9-year uptrend line @ 114.35. Until the trendline is violated, the bulls are in control.

