iShares Silver Trust ETF (SLV)
Key Statistics – SLV iShares Silver ETF
Thank you for reading this post, don't forget to subscribe!
Daily Close 15.48 Long-Term Trend (100 SMA) Bearish
Minor Support Level 14.74 Minor Resistance Level 16.64
Major Support Level 10.20 Major Resistance Level 42.78
Minor Buy Signal 17.14 Minor Sell Signal 14.09
Major Buy Signal 46.23 Major Sell Signal 8.45
BRIEF OVERVIEW – SLV iShares Silver ETF
Historically, silver is the most volatile trading vehicle within the universe of commodity futures. Additionally, it is easily the most intensely debated commodity among traders and investors. Silver evokes a great deal of emotion from the investment community. It is both loved and despised, all at the same time. Let’s examine silver from an historical perspective in order to determine why this market conjures up such emotional responses from traders and investors alike.
Silver is an incredibly important metal in regard to the scientific community. It is one of only 118 known chemical elements which comprise the periodic table of elements. The symbol for silver in the periodic table is Ag. It is grouped with gold & copper in the periodic table. Together, this group is known as the “coinage metals.” It has the distinction of being the oldest elements in the periodic table. These metals have been in existence since prehistoric times.
Silver is used in a number of different capacities, both as a precious metal and an industrial metal. Silver fills its role as a precious metal by being used in bullion coins as well as legal tender currency. In terms of an industrial metal, silver is used in solar panels, water filtration, high-value tableware, window coatings, stained glass, electronic devices and several different types of medical instruments.
Arguably, the main reason silver tends to be such an emotional topic among traders and investors is based on the fact that silver has been part of the United States currency system since the very beginning of our nation’s history. Specifically, silver can trace its roots back to March 4, 1789, which marks the date Congress officially convened for the first time under the US Constitution.
One of its first orders of business was to establish a national currency system. Congress accomplished this task by creating the US Mint in 1792, which was located in Philadelphia. Immediately, the US Mint began producing silver coins as part of our nation’s currency system. Silver remained the cornerstone of the US currency until 1965, when Congress passed the Coinage Act of 1965. This act completely removed all silver content from nickels, dimes and half dollars.
Unofficially, the Coinage Act began the slow transition away from gold and silver’s linkage to the US currency system. In its place, the US monetary authorities inserted a digital program, which involves the “printing” of US Dollars with the simple push of a keyboard linked to a computer. The final decoupling occurred on August 15, 1971, when President Nixon suspended the convertibility of the US Dollar to gold.
Of course, the “gold and silver bugs” will argue that the US Dollar will eventually become worthless based on the fact that it is no longer linked to any tangible asset like gold and silver.
Instead, the US Dollar can simply be created out of thin air in unlimited amounts. At the end of the day, the gold and silver bugs will probably have the last laugh. Most likely, the US Dollar will eventually be replaced with a completely new global currency system. However, financial pundits have been predicting the collapse of the US Dollar since 1971. The current fiat money system could easily continue for several more years (or it could all come crashing down tomorrow). These historic events are impossible to accurately forecast.
The iShares family of exchange traded funds (managed by BlackRock) introduced the Silver Trust ETF on April 21, 2006. The ticker symbol is SLV. This ETF is a perfect vehicle for investors who are searching for “pure play” exposure to the silver market. SLV does not maintain an equity position in silver mining companies. Instead, the ETF is 100% invested in physical silver.
SLV is easily the most popular silver ETF, with over 9 million shares exchanging hands on a daily basis.
SHORT-TERM VIEW – SLV iShares Silver ETF
SLV has been locked in a trading range during the past four months, with a slight bias to the downside. The bears are in control of the short-term momentum. The next level of support is 14.74. In order to recapture the upside momentum, the bulls need a weekly close above 16.64. The most likely scenario is a continuation of the trading range.
LONG-TERM VIEW – SLV iShares Silver ETF
Silver is known as “the poor man’s gold” because it is less expensive than gold. However, in terms of price volatility, silver is definitely more erratic than gold. As we discussed previously, silver is the most volatile commodity among all actively traded US futures contracts. This market is notorious for generating huge price swings on a daily basis.
In terms of supply and demand, the outlook for silver looks rather bleak. Silver investment demand literally collapsed in 2017. The final figures for 2017 totaled 50.2 million ounces, a reduction of 50.2% from 2016. Investment demand for 2018 is forecasted to be 43.9 million ounces, the lowest level since 2006. Please review the following table.
Silver Mine Production
2005 – 2018
Date Annual Production Date Annual Production
2005 20,800 metric tons 2012 25,500 metric tons
2006 20,100 metric tons 2013 26,000 metric tons
2007 20,800 metric tons 2014 26,800 metric tons
2008 21,400 metric tons 2015 25,100 metric tons
2009 22,200 metric tons 2016 25,700 metric tons
2010 23,800 metric tons 2017 25,000 metric tons
2011 23,300 metric tons 2018 24,300 metric tons (forecast)
Source Statista
As you can see from the table, global silver mine production is expected to decline for the second consecutive year in 2018, to 24,300 metric tons. This represents the lowest annual production rate since 2011. However, silver production continues to outpace demand.
Despite the unfavorable supply and demand numbers, many precious metals analysts are forecasting higher silver prices over the course of the next 3 to 5 years. This bullish price forecast is based on silver’s precious metals component. These analysts believe geopolitical risks coupled with inflationary expectations and changes in monetary policy could lay the groundwork for a perfect storm scenario of higher silver prices.
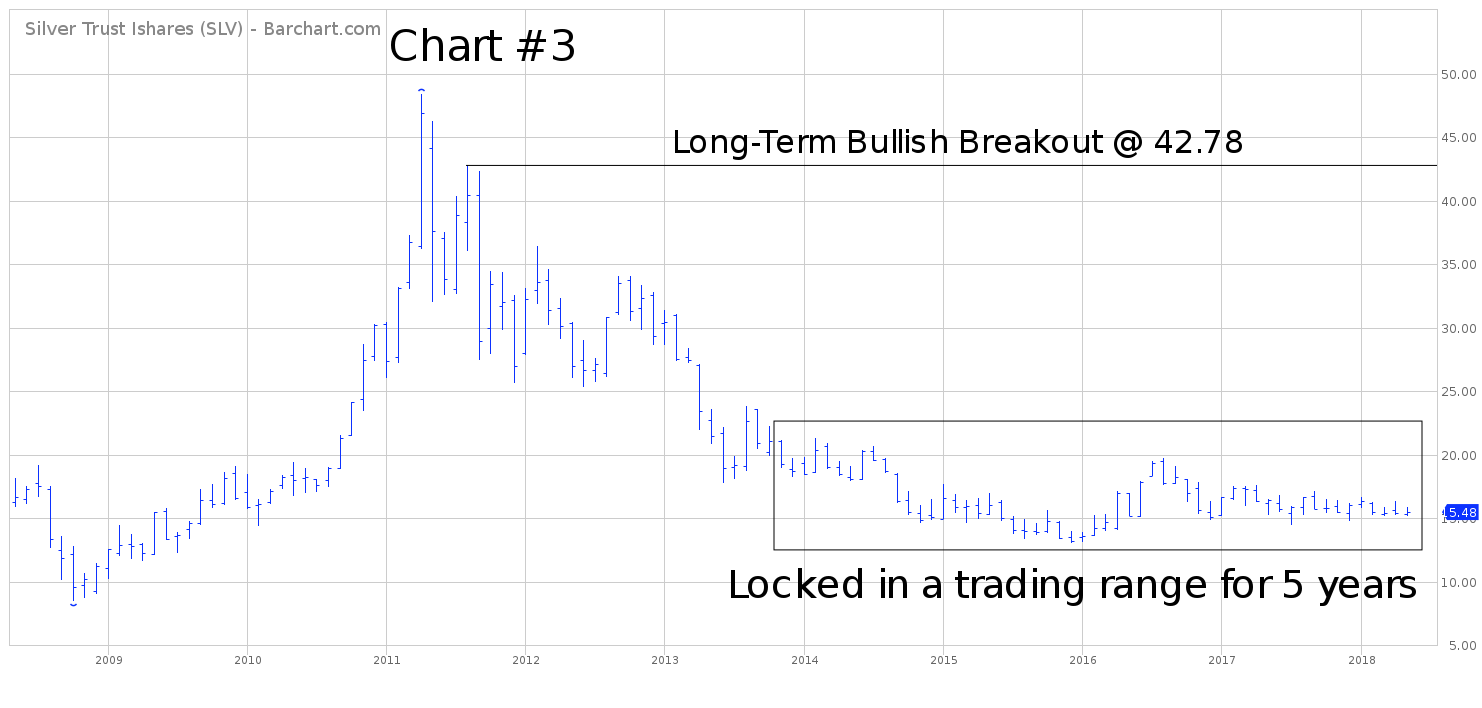
Please review the 40-year chart of silver prices (Chart #1). One of the most spectacular price increases in the history of the commodity universe occurred in the silver market during the final few months of 1979, culminating with a blow-off top in January 1980. Nelson and Bunker Hunt launched an unsuccessful attempt to control the entire global supply of silver. As you can see from the chart, the Hunt brothers failed in their effort to corner the silver market. Prices collapsed just as quickly as they had risen. The entire event played out in less than four months.
The Hunt brothers debacle marked the beginning of a brutal 25-year bear market in silver. With the exception of a few brief rally attempts, silver was locked in a $4 trading range for over 20 years. The market finally embarked on a new bullish advance beginning in January 2006. An argument could be made that silver entered a new secular bull market in 2006. If this analysis is correct, prices are headed dramatically higher for the next several years. The final top should occur in the early 2030s.
Of course, the silver bears will disagree with this analysis. They claim the bull market came to an abrupt end when silver was unable to penetrate $50 per ounce in April 2011. Based on their interpretation of the market, the silver bears are forecasting sharply lower prices for the next several years (very similar to the price action throughout the 1980s, 1990s and 2000s). If their analysis is correct, silver will eventually drop into the single digits.
Which analysis is correct, the bullish analysis or the bearish analysis? This is a difficult question to answer. Based on the current price of silver, an equally strong argument could be made for both the bulls and the bears. The important numbers to watch are 8.45 and 25.09. A weekly close below 8.45 probably means silver prices will remain cheap for the next two decades. Conversely, a weekly close above 25.09 would indicate much higher prices into the 2030s. We should experience a breakout within the next 18 to 24 months.
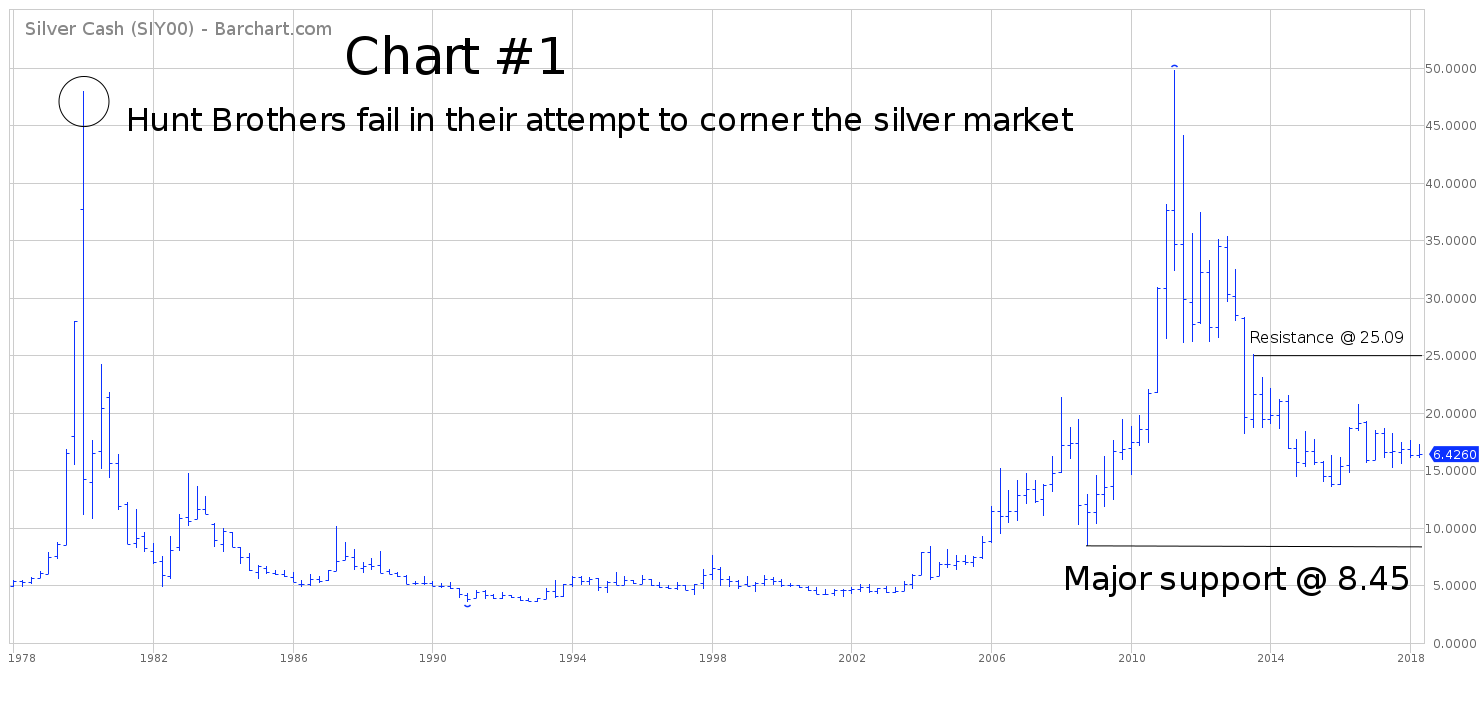
In terms of SLV, the long-term momentum favors the bearish camp. The next level of support is 10.20. In order to recapture the upside momentum, the bulls need a weekly close above 42.78. Obviously, it would require a dramatic rally in silver to push SLV above 42.78. At least for the next several months, the bears will maintain the upper hand.
SHORT-TERM CHART – SLV iShares Silver ETF
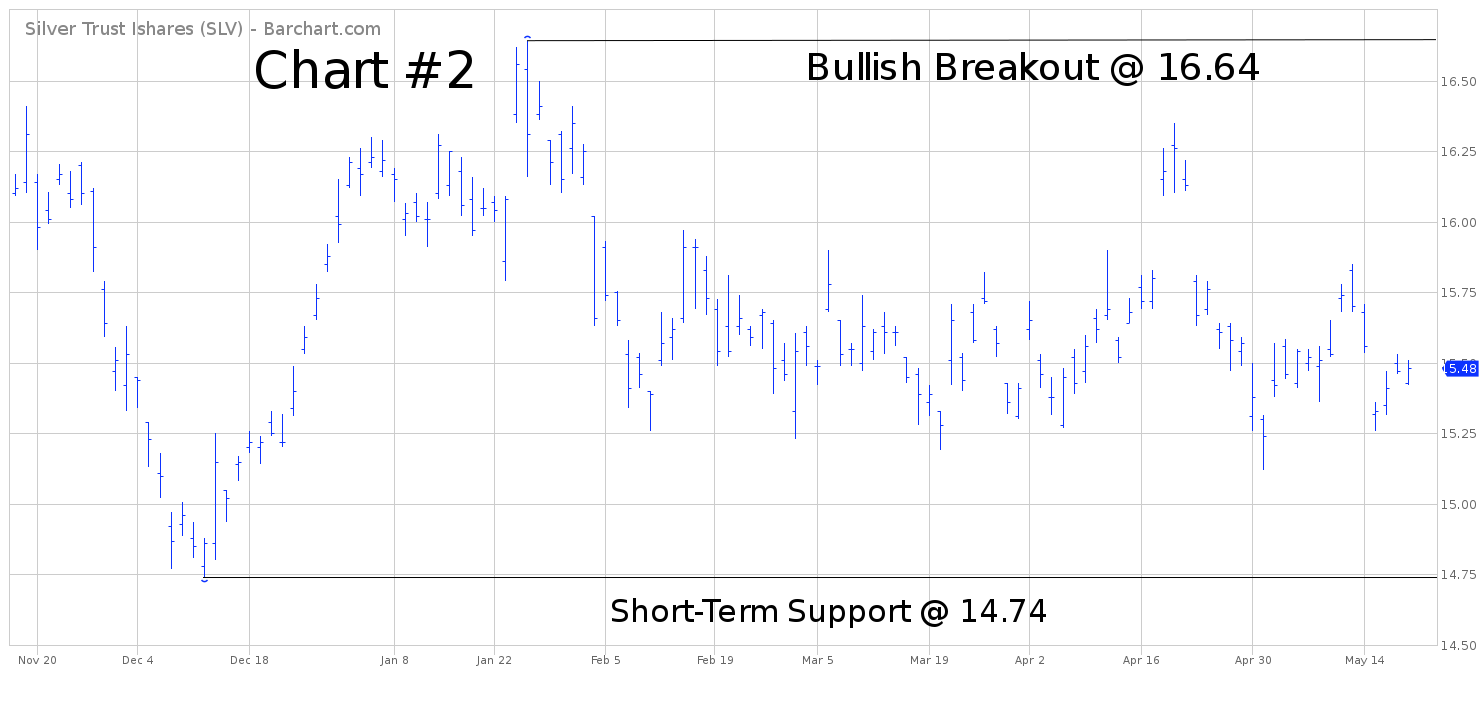
Please review the 6-month chart of SLV (Chart #2). The ETF has been trading sideways throughout 2018, with a bias to the downside. The short-term chart pattern is bearish. The next level of support is 14.74. The trend will turn bullish on a weekly close above 16.64. The current trading range could easily continue for the next few months.

LONG-TERM CHART – SLV iShares Silver ETF
Please review the 10-year chart of SLV (Chart #3). The ETF has been stuck in a boring trading range for the past five years. The bears are in control of the long-term trend. A weekly close above 42.78 will reverse the trend from bearish to bullish.