

iShares S&P GSCI Commodity-Indexed Trust (GSG)
Key Statistics – GSG Exchange Traded Fund
Thank you for reading this post, don't forget to subscribe!
Minor Support Level 16.02 Minor Resistance Level 18.31
Major Support Level 12.03 Major Resistance Level 57.91
Minor Buy Signal 19.36 Minor Sell Signal 15.65
Major Buy Signal 66.35 Major Sell Signal 7.74
BRIEF OVERVIEW – GSG Exchange Traded Fund
Quite often, investors (particularly novice investors) are overwhelmed by the amount of different products available for investing. The list would include such things as growth stocks, international stocks, value stocks, corporate bonds, tax-free bonds, mutual funds, precious metals, real estate investment trusts, money markets and foreign currencies, just to name a few.
The sheer size of the overall investment landscape can be rather intimidating. However, despite the endless number of different vehicles available for investing, each of these individual investments can be broken into four different categories. The categories include stocks, bonds, commodities and cash. This adds a great deal of simplification to managing an investment portfolio.
Among the four investment categories, commodities offer the greatest potential rate of return. Of course, this category also carries the most risk. In addition to its high rate of return, investors are also attracted to commodities because of its low correlation to other asset classes. In other words, commodities usually move in the opposite direction of other investments. As a result, commodities can be used to diversify an investor’s portfolio.
Commodities are divided into eight major groups. These groups include grains, meats, metals, energy, stock indices, currencies, softs and interest rates. During the past few months, digital currencies have been added to the list. Please review the following table.
List of Commodities
Eight Major Groups
GRAINS MEATS METALS ENERGY STOCK INDEX
Corn Lean Hogs Gold Crude Oil S&P 500
Oats Live Cattle Silver Gasoline DJIA
Soybeans Feeder Cattle Copper Heating Oil Russell 2000
Soybean Meal Platinum Natural Gas NASDAQ 100
Soybean Oil Palladium
Wheat Aluminum
CURRENCIES SOFTS INTEREST RATES
Japanese Yen Coffee T-Bonds (30 yr)
Euro FX Cocoa T-Notes (10 yr)
Swiss Franc Sugar T-Notes (5 yr)
Aussie Dollar Orange Juice T-Notes (2 yr)
Canadian Dollar Cotton Eurodollar
Mexican Peso Lumber
British Pound
The iShares family of exchange traded funds (managed by BlackRock) introduced the S&P GSCI Commodity-Indexed Trust on July 10, 2006. The ticker symbol is GSG. This investment vehicle is not a standard ETF (as defined by the Investment Company Act of 1940). Instead, GSG is a statutory trust registered with the Commodity Futures Trading Commission as a Commodity Pool. Investors’ assets are “pooled” together in order to purchase exchange-traded index futures contracts. These index futures contracts represent investments in various commodities. Therefore, GSG is a perfect vehicle for investors who are searching for “pure play” exposure to the commodity markets. The top five commodities within GSG include crude oil, natural gas, corn, heating oil and aluminum.
SHORT-TERM VIEW – GSG Exchange Traded Fund
Despite the bearish price action during the past few days, the bulls are in control of GSG. The next level of resistance is 18.31. An argument could be made that GSG formed an important short-term top on May 22nd. A weekly close below 16.02 would confirm a short-term top is firmly in place.
LONG-TERM VIEW – GSG Exchange Traded Fund
Based on historical research, commodities are the most cyclical asset class within the investment universe. They follow a fairly reliable pattern in terms of price behavior. This pattern consists of two predominant cycles. The length of the first cycle is typically 3 to 6 years. The length of the second cycle is 14 to 25 years. Please review the following table.
Commodity Cycles
DATE BULLISH/BEARISH % MOVEMENT
1970 – 1975 Bullish 318%
1975 – 1977 Bearish (50%)
1977 – 1981 Bullish 95%
1981 – 1986 Bearish (52%)
1986 – 1991 Bullish 193%
1991 – 1994 Bearish (32%)
1994 – 1997 Bullish 52%
1997 – 1999 Bearish (42%)
1999 – 2008 Bullish 220%
2008 – 2009 Bearish (57%)
2009 – 2011 Bullish 72%
2011 – 2016 Bearish (58%)
2016 – ? Bullish ?
Source Bloomberg
This table is loaded with valuable information as it relates to the future direction of commodity prices. Most notably, the table allows us to calculate the average duration of each commodity cycle. Since 1970, each cycles has been 4.7 years. Therefore, we can expect the current bull market cycle to reach its peak in 2021.
As we discussed briefly, commodity cycles consist of two distinct time periods. The first time period is 3 to 6 years. The second time period is 14 to 25 years. The commodity table dates back to 1970. Therefore, the table only displays the short-term cycles of 3 to 6 years. However, based on the data contained in the table, we can conclude that a new long-term commodity cycle probably began in 1999. Given the fact long-term cycles last 14 to 25 years, the dominant trend in the commodity universe will be one of rising prices (most likely reaching a peak in 2022).
If commodity prices are indeed headed higher for the next 3 to 4 years, how high will commodities climb? Will this be an explosive bull market (similar to the early-1970s) or can we expect a rather subdued rally? Of course, it’s impossible to answer this question with complete certainty. However, based on historical data, the most logical conclusion is to expect a modest commodity bull market over the course of the next few years. At least for now, it appears rather unlikely that commodities are on the verge of moving dramatically higher.
As a side note, many traders and investors believe the recent bull market from 2000 through 2008 was the most powerful commodity bull market of the past 50 years. As you can see from the table, this is not true. The bull market from 1970 through 1975 generated the greatest commodity price advance of the past 100 years.
Several commodities literally exploded in price during this time period. For example, the price of soybeans increased 424% in less than three years (1970 – 1973). Sugar literally exploded from 1970 through 1974. The price increased an astonishing 2,192%. Another big mover in the first half of the 1970s was silver. The “poor man’s gold” advanced 402%, rising from $1.28 per ounce to $6.43 per ounce. These are just a few examples of the dramatic price increases from the 1970s commodity bull market.
The current data clearly favors rising commodity prices for the next few years. However, it will not come close to matching the huge moves from 1970 through 1975 and again from 1999 through 2008. Instead, the price advance will be rather measured (similar to the bull market from 1994 through 1997).
In regard to GSG, the long-term view is extremely bearish. Essentially, GSG has been drifting lower since July 2008. It’s certainly not a coincidence that crude oil generated its all-time high along with GSG in July 2008. Why? Because the energy sector is the largest component of GSG. Therefore, the price of crude oil greatly influences the price of GSG.
The bears are in complete control of the long-term view. The next level of support is 12.03. In order to capture the upside momentum, the bulls need a weekly close above 57.91. Most likely, the bears will remain in control of GSG for the next several months.
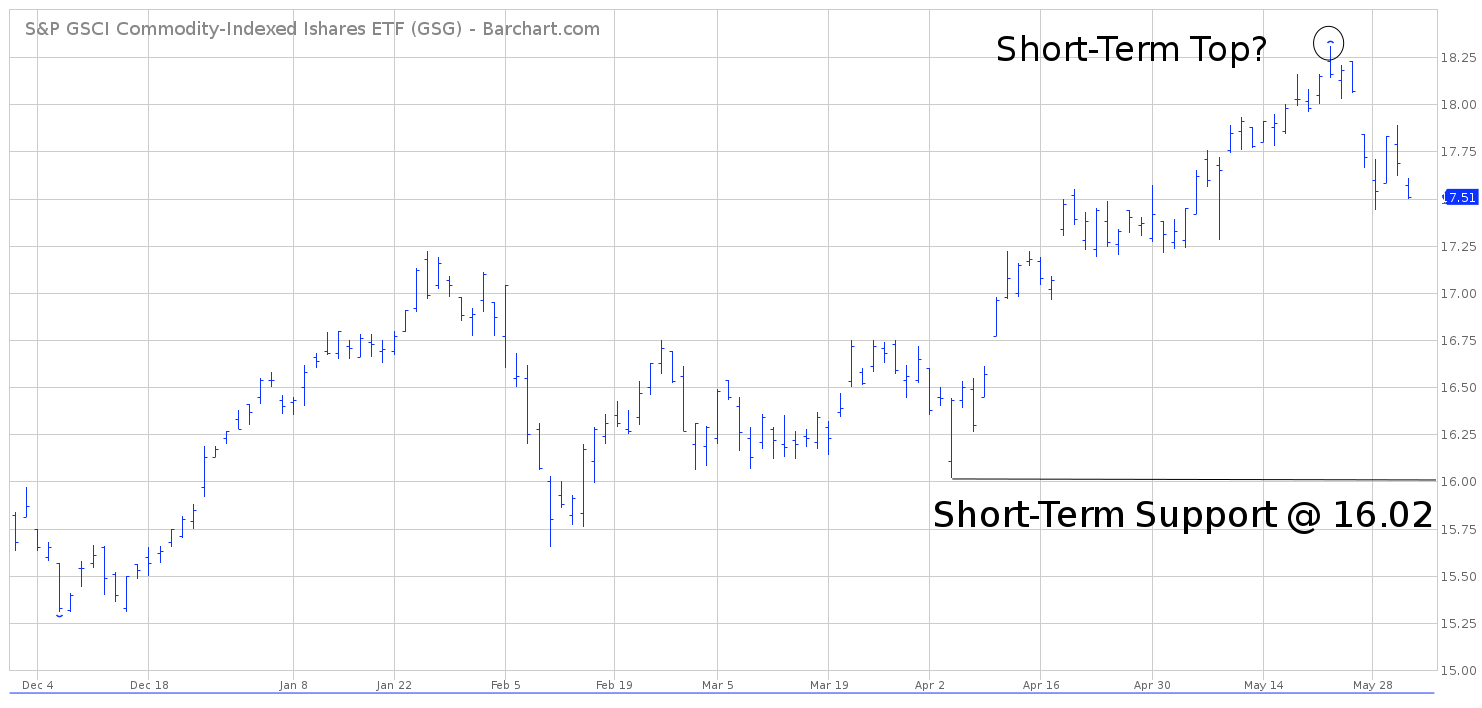
SHORT-TERM TREND – GSG Exchange Traded Fund
Please review the 6-month chart of GSG. The bulls are in control of the short-term trend. However, they are losing their grip on GSG rather quickly. A weekly close below 16.02 would be “bad news” for the bullish camp. A weekly close above 18.31 would definitely enhance the bullishness of the chart pattern.
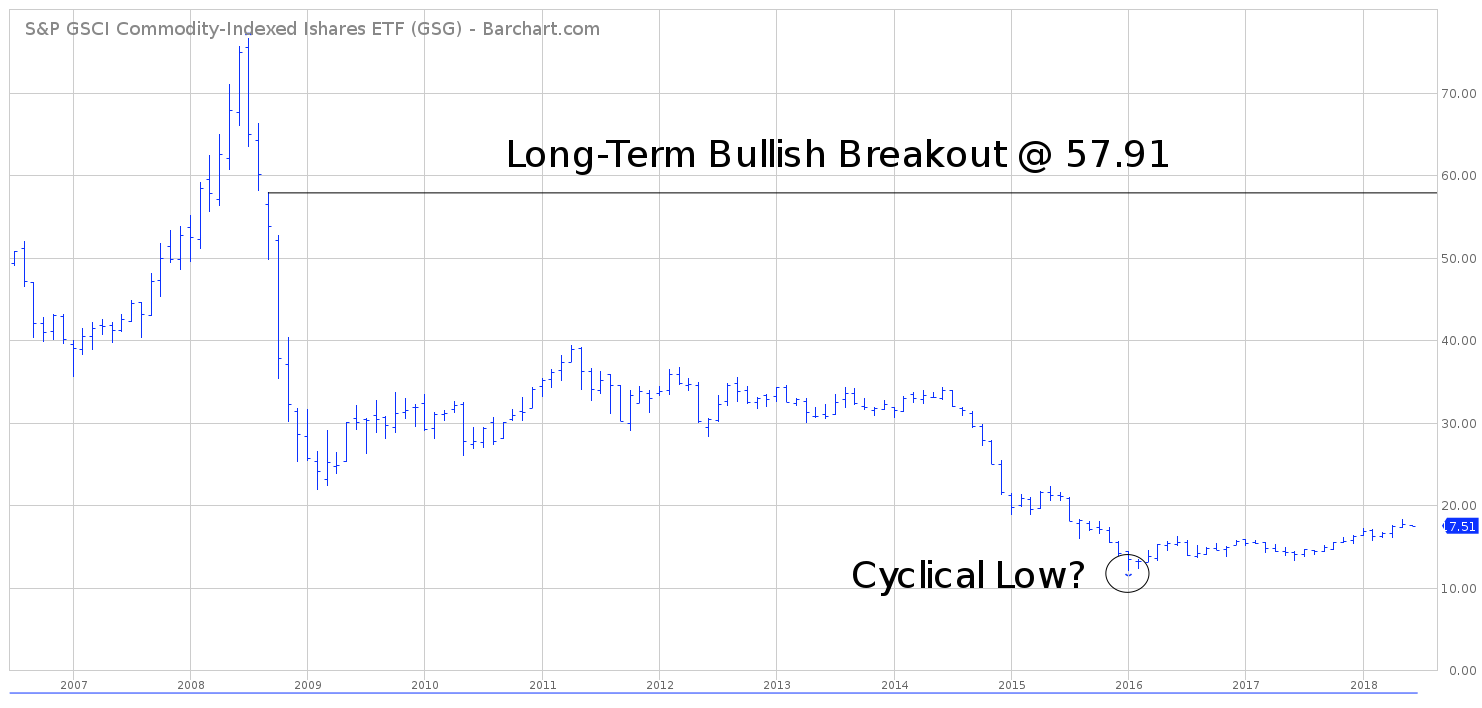
LONG-TERM TREND – GSG Exchange Traded Fund
Please review the 12-year chart of GSG. This chart covers the entire trading history. Without question, the bears are in control of the long-term trend. The chart pattern looks incredibly bearish. However, an argument could be made that GSG made a long-term bottom in January 2016, @ 12.03. This low coincides perfectly with the major low generated by crude oil during the same time period in 2016. Crude oil hit bottom near $26 per barrel in early-2016. It seems highly unlikely that crude will revisit the $26 level any time during the next few years. Therefore, GSG probably made a cyclical low @ 12.03.
Although GSG most likely formed an important bottom in January 2016, it will take several months of rising prices to push the long-term trend in favor of the bulls. A weekly close above 57.91 is required in order to flip the chart pattern from bearish to bullish. At least for the next several months, the bears have the upper hand.

