SPDR Dow Jones Industrial Average ETF (DIA)
Key Statistics
Thank you for reading this post, don't forget to subscribe!
Minor Support Level 261.41 Minor Resistance Level 303.60
Major Support Level 112.14 Major Resistance Level 314.04
Minor Buy Signal 308.48 Minor Sell Signal 256.46
Major Buy Signal 323.02 Major Sell Signal 101.33
BRIEF OVERVIEW – DIA
Arguably, Charles H Dow is regarded as the most prolific financial journalist in modern American history. Born in Sterling, CT on 6 November 1851, Dow began his journalism career at the age of 21 as a reporter for the Springfield Daily Republican. For the next ten years of his career, Dow wrote for various newspapers and periodicals throughout Connecticut and Rhode Island, specializing in business and investing articles.
In an effort to advance his business writing career, Dow moved to New York in 1880 and accepted a position with Kiernan Wall Street Financial News Bureau. A few months after Dow’s arrival in New York, one of his journalist friends from Rhode Island decided to join Dow at Kiernan. His name was Edward Jones. Dow and Jones worked at Kiernan for two years. In 1882, they decided to launch their own financial news agency. The name of the new company was Dow, Jones & Company.
The new company was immediately successful. Dow and Jones had a reputation on Wall Street for providing truthful analysis and fact-based reporting. Unfortunately, many financial reporters during the late-1800s would accept “kickbacks” from companies if the reporter would write a positive story about the company in an effort to boost the price of the company’s stock. Dow and Jones never engaged in such activity. Consequently, Dow, Jones & Company became one of the most trusted news sources on Wall Street.
In 1889, seven years after forming their news agency, Dow and Jones expanded their operation by rolling out a full-fledged daily newspaper. The name of the newspaper was The Wall Street Journal. The first issue was released on 8 July 1889. The newspaper quickly became the most popular financial publication in New York.
In addition to his journalism, Charles Dow was an avid stock market researcher. He was obsessed with financial research along with the study of technical analysis. In order to improve his financial research, Dow (along with Edward Jones) created two stock market indices beginning in the mid-1880s. Specifically, the Dow Jones Transportation Average (DJTA) was first released in July 1884. This was followed by the Dow Jones Industrial Average (DJIA) in May 1896.
Dow combined his stock market research and technical analysis to develop the Dow Theory, which was a trend-following indicator designed to generate buy/sell signals based on daily price movements in DJIA and DJTA. Dow laid out the original framework of the Dow Theory in a series of articles published in The Wall Street Journal throughout the 1890s. Dow never had the opportunity to complete his studies on the Dow Theory indicator. He passed away in 1902. Upon his death, William Peter Hamilton gained access to Dow’s original notes and eventually completed the Dow Theory indicator in the early 1900s. Hamilton eventually became the fourth editor of The Wall Street Journal.
The Dow Theory was originally founded on the notion that the overall stock market was in a bullish trend if DJTA was outperforming DJIA on a relative basis. According to his research, Charles Dow discovered that DJTA was an excellent indicator in determining the strength or weakness of the US economy. Dow concluded that a rise in transportation stocks would signal the beginning of a prolonged period of economic growth for the US economy. This would lead to an increase in corporate earnings follow by a strong rally in the overall stock market. Conversely, a sustained decline in DJTA would indicate a slowdown in US economic activity. This would be followed by a sell-off in the stock market.
When Dow was conducting his initial research in the 1890s, railroad companies dominated the Dow Jones Transportation Average landscape. Over the course of the past 100+ years, DJTA has transitioned into a much more diversified transportation index. These days, DJTA consists of a mixture of 20 different transportation companies. Please review the following list.
- Airlines – 6
- Delivery Services – 3
- Marine Transportation – 2
- Railroads – 4
- Rental & Leasing – 1
- Transportation – 1
- Trucking – 3
As you can see from the list, DJTA is comprised of a diverse group of transportation and delivery companies. The index consists of only four railroad companies. When Charles Dow created the original transportation index in 1884, 82% of the index was composed of railroad companies.
Despite the fact that DJTA has changed over the years, it has not affected the results of the Dow Theory indicator. In fact, the results have actually improved during the past 20 years as DJTA has added a few technology-based transportation companies to the list. Originally, many Dow Theory “purists” were convinced that the indicator would lose its effectiveness if railroad companies played a diminished role in the overall index. However, these fears ultimately proved to be unfounded.
The SPDR family of exchange traded funds (managed by State Street Global Advisors) introduced the Dow Jones Industrial Average ETF on 14 January 1998. The ticker symbol is DIA. This ETF is a perfect vehicle for investors who wish to participate in the performance of DJIA. DIA is an extremely popular ETF, with an average daily volume of nearly six million shares. The ETF is commonly referred to as “Diamonds.”
SHORT-TERM VIEW – DIA
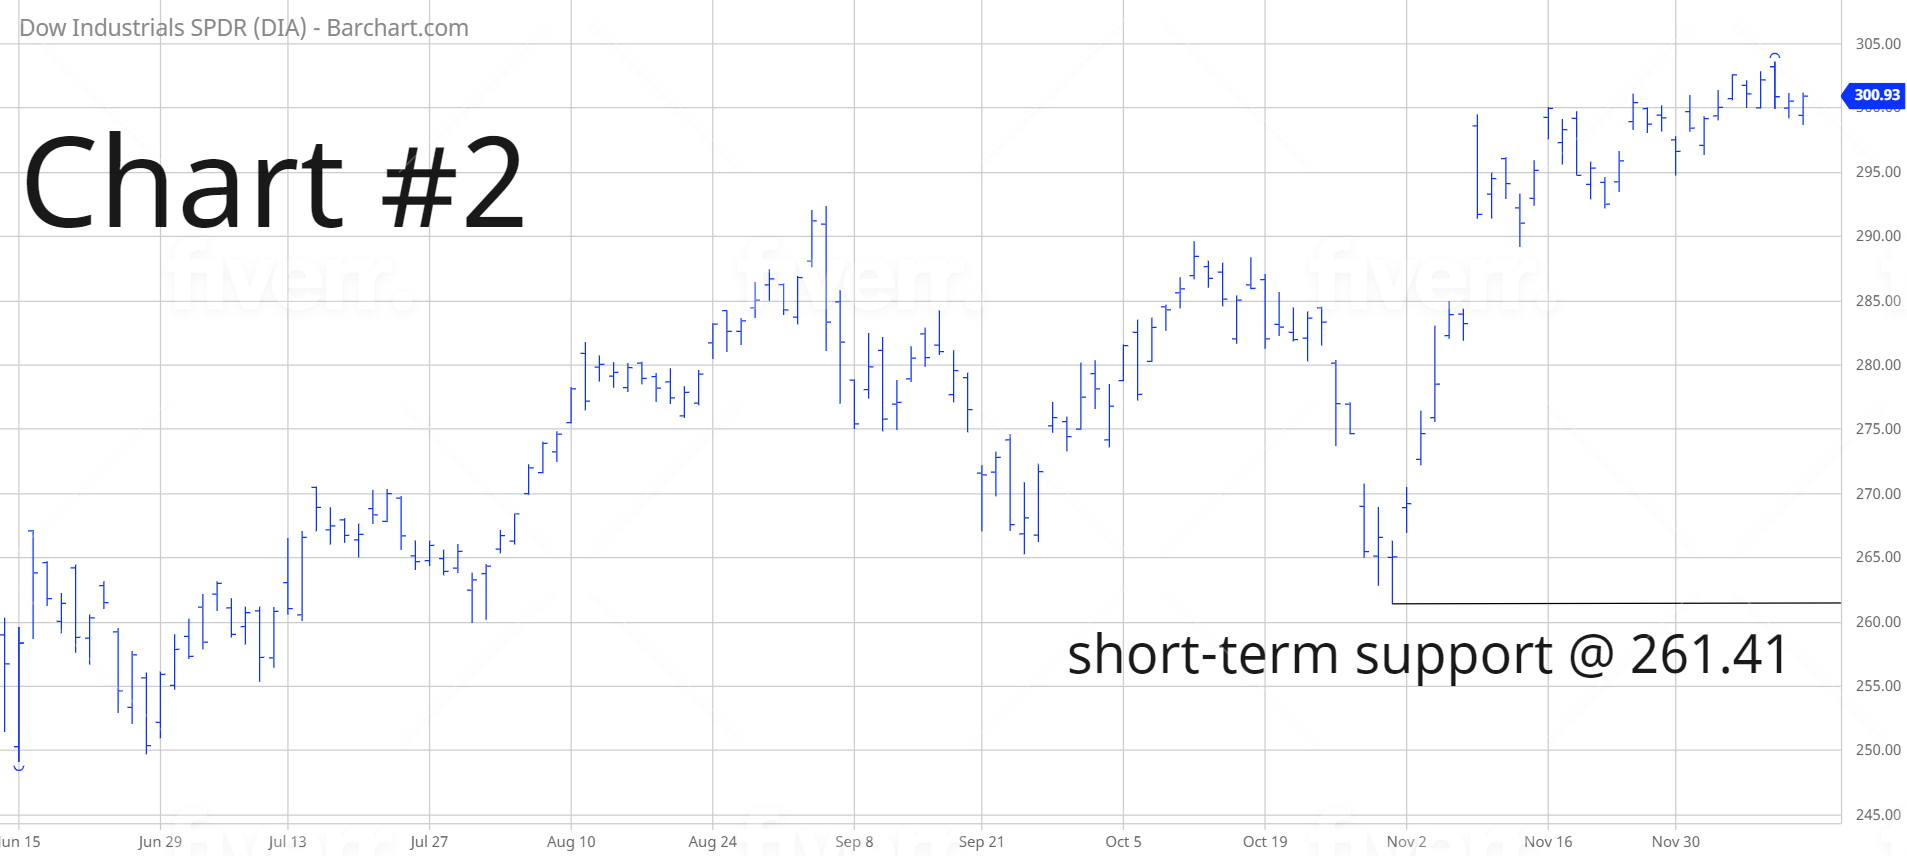
DIA remains in bullish territory on a short-term basis. The next level of resistance is 303.60. In order to recapture the momentum, the bears need a weekly close below 261.41. The most likely scenario is a continuation of higher prices.
LONG-TERM VIEW – DIA
Financial markets love to frustrate as many investors as possible. Speculative assets (like stocks) usually move in the opposite direction of the general consensus. This explains why the overwhelming majority of investors have missed the substantial rally following the “pandemic low” on 23 March. The global investment community was convinced that equity prices would enter a new secular bear market in response to COVID-19. Initially, this forecast proved to be correct as major stock indices around the world suffered a dramatic decline in February and March. However, the sell-off abruptly ended in late-March and stocks have been moving higher for the past nine months.
Arguably, the industry most negatively impacted by the global pandemic is the transportation industry. Over the course of the past nine months, all forms of travel have witnessed a sharp decline. Consequently, most investors would assume that the Dow Jones Transportation Average would be trading near a multi-year low. When the coronavirus news was initially released to the general public in February, DJTA suffered a brutal sell-off. However, the decline was contained to only four weeks. An important low was achieved on 18 March and the index has been moving relentlessly higher for the past nine months.
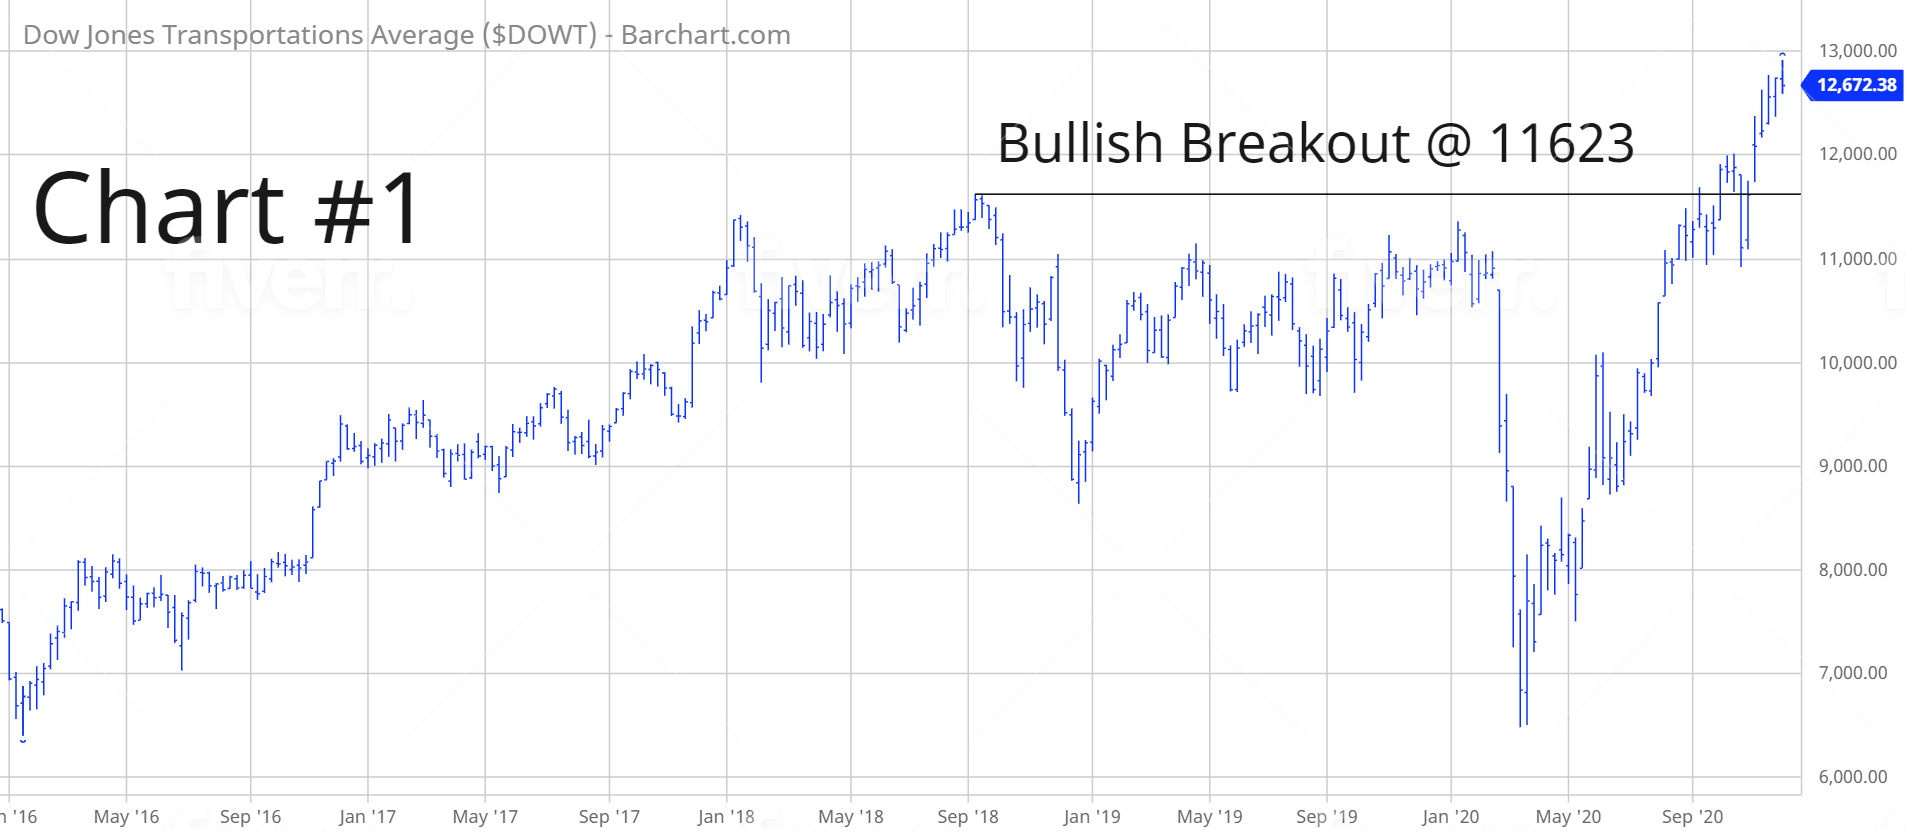
The recent performance of DJTA is a perfect example of how speculative assets usually move in the opposite direction of the general consensus. How was it possible for a transportation index to rally in the middle of a pandemic, which included global travel restrictions? Because, as we briefly discussed, DJTA has been updated over the years in an effort to include a few technology-based transportation companies. These adjustments were made in order to modernize DJTA based on the fact that many transportation companies are heavily dependent on new technological innovations. Some investors claim that DJTA now trades more like a technology index versus a transportation index. Whatever the case may be, DJTA has enjoyed much higher prices following the “pandemic low” in March. In fact, the index recently generated a substantial bullish breakout @ 11623 (Chart #1).
The Dow Theory indicator has continued to work extremely well despite the changes that have occurred to DJTA over the years. Please review a list of the Dow Theory trading signals from 1970 through 2020.
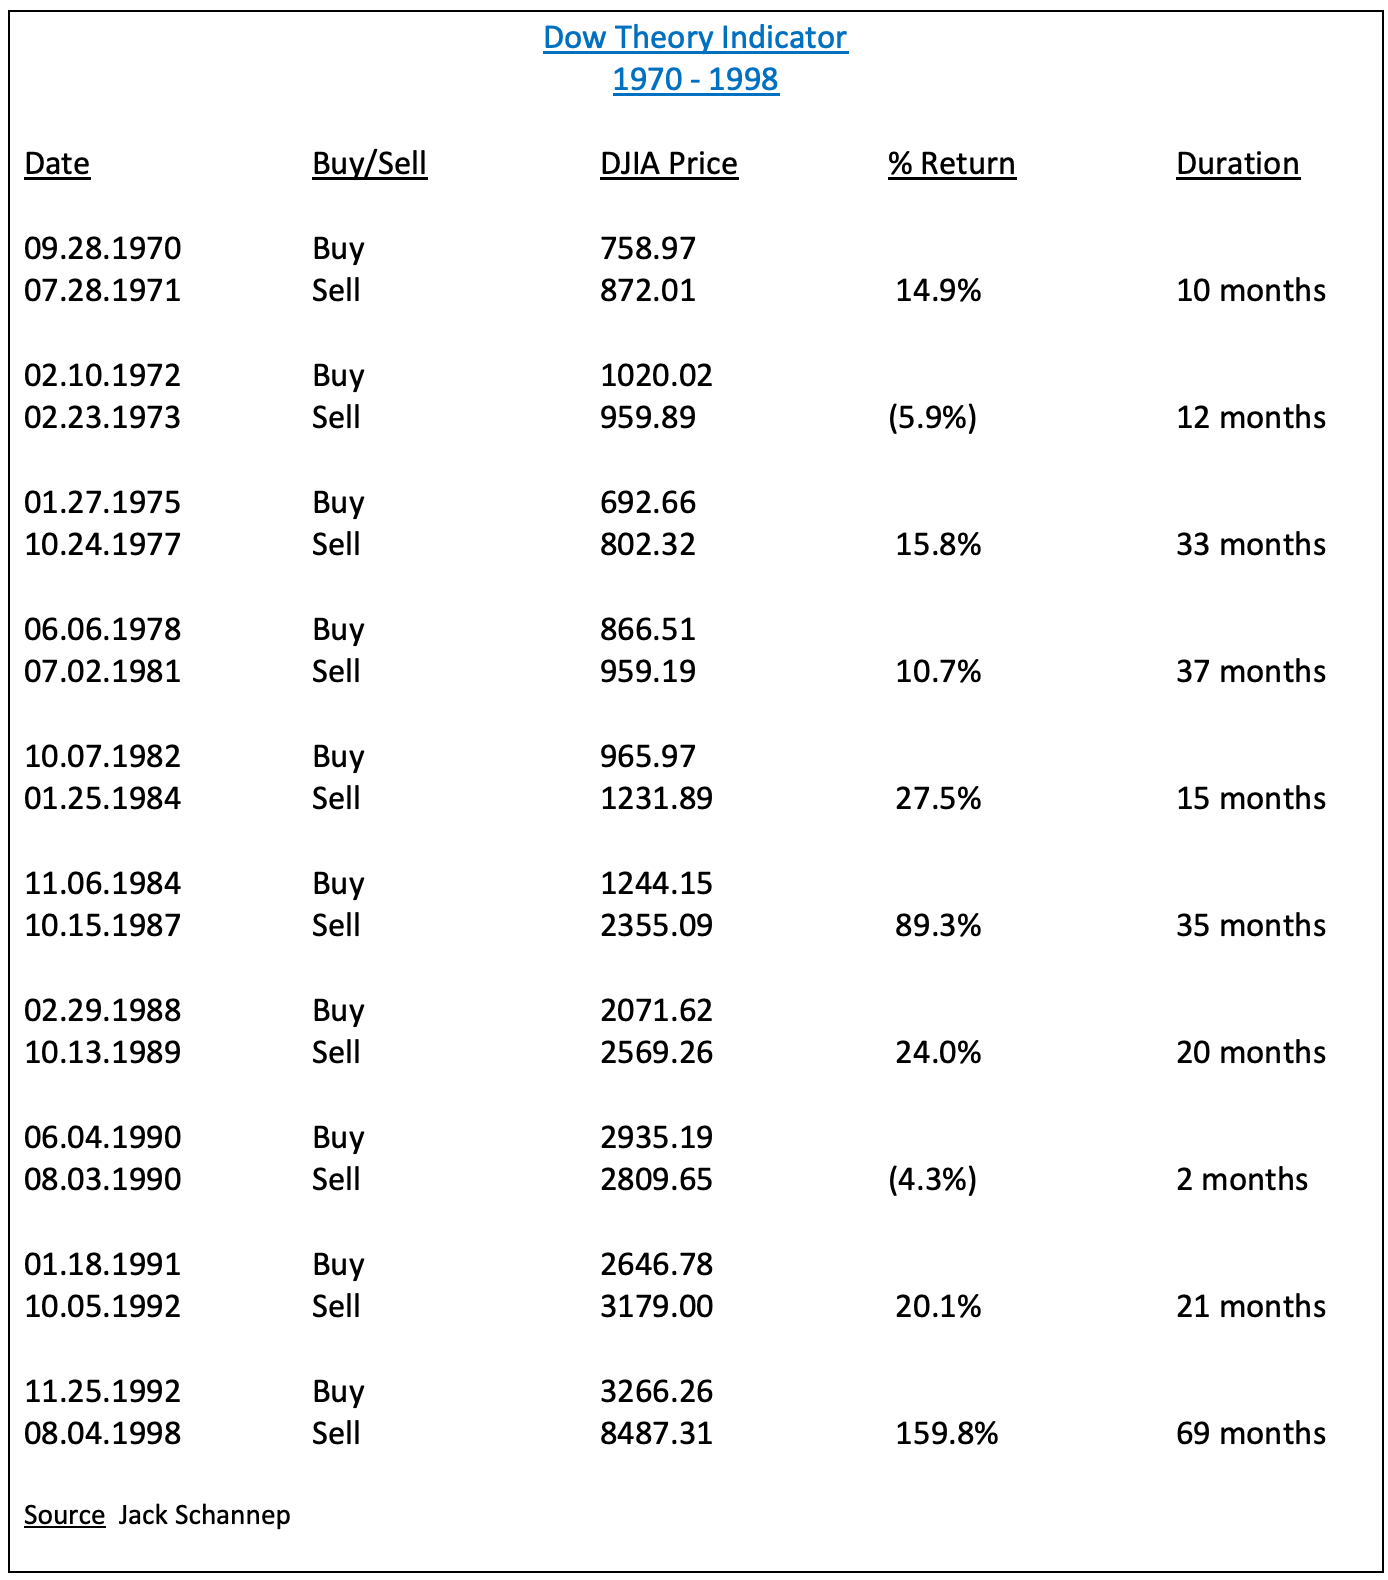
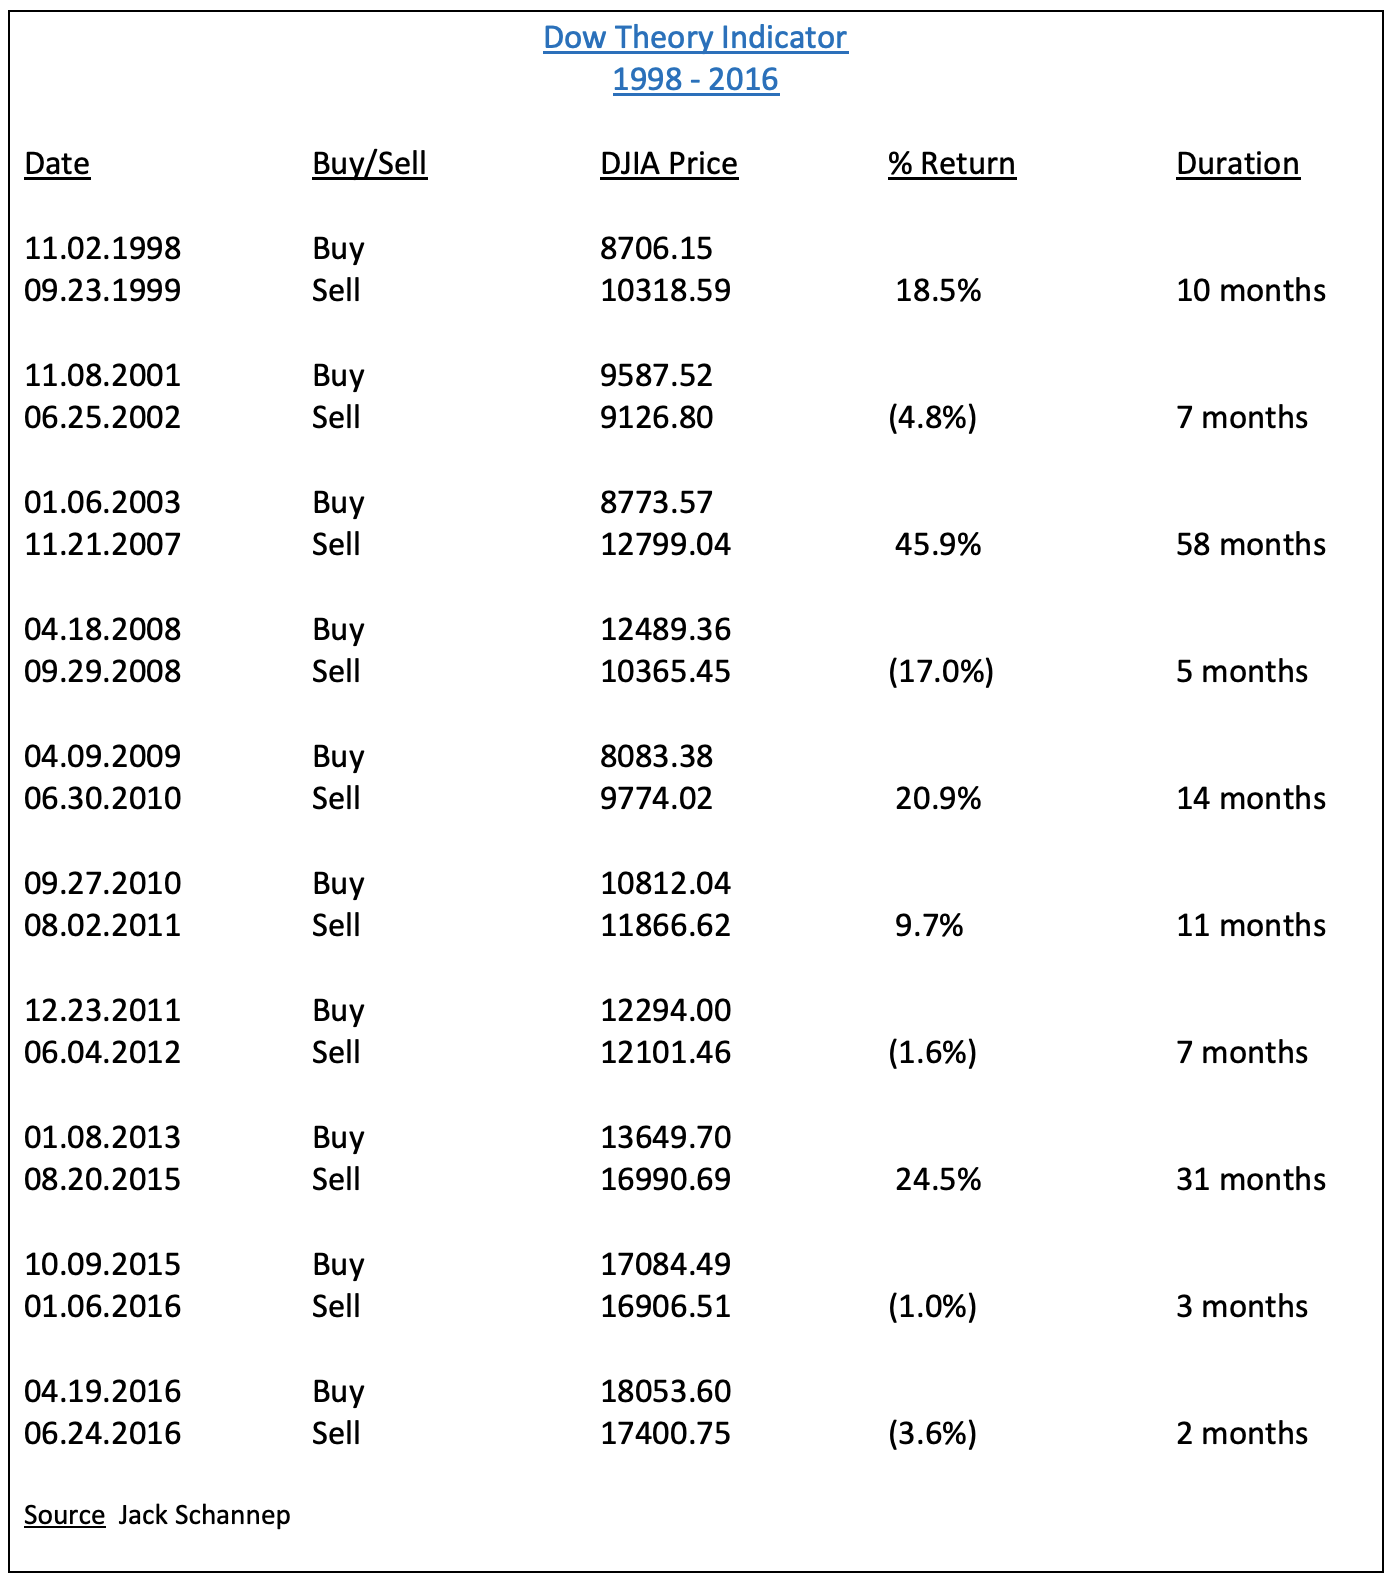
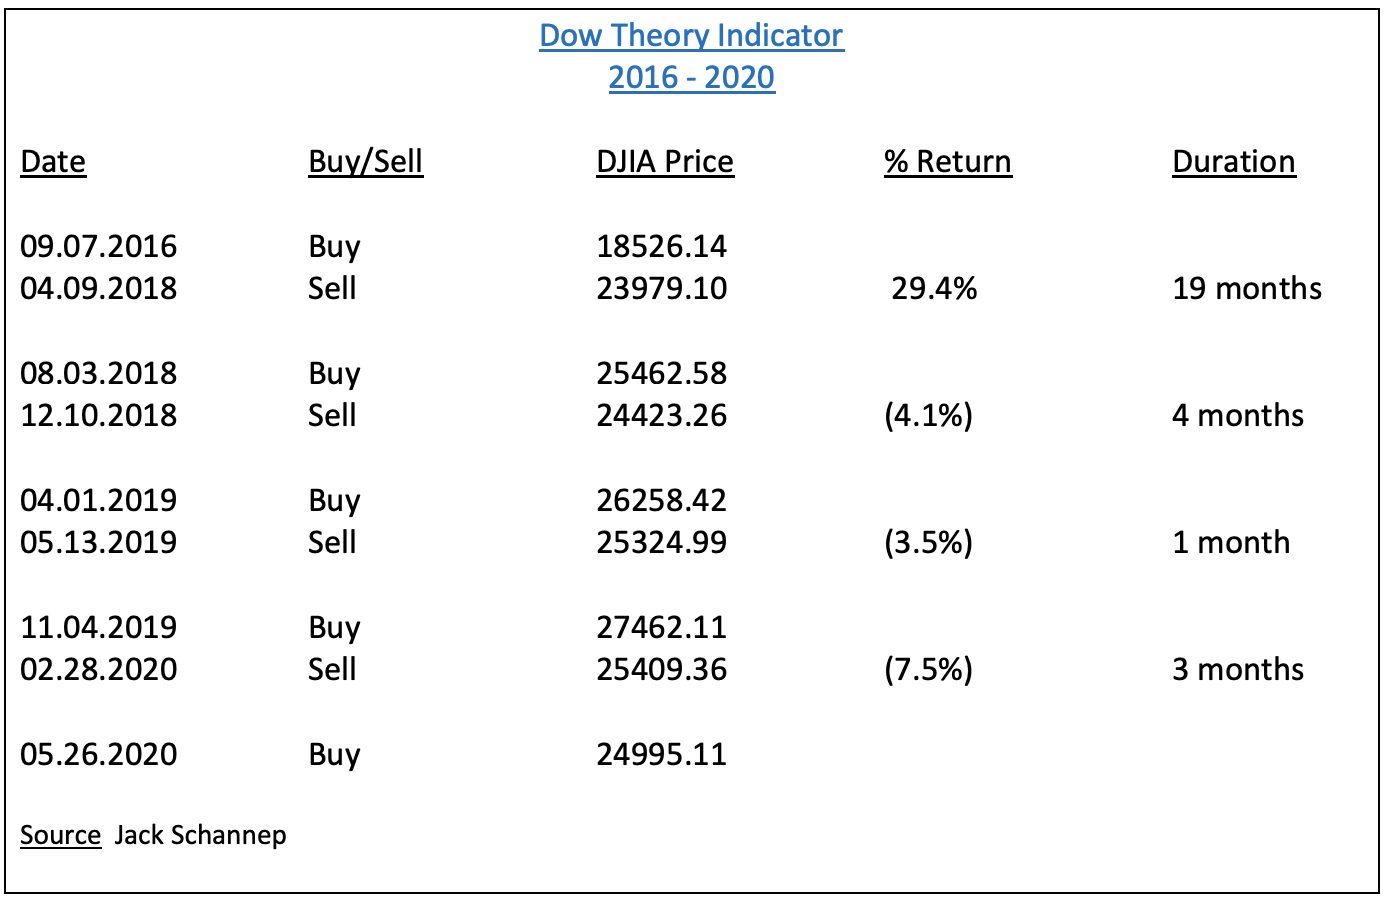
As you can see from the table, the Dow Theory indicator has generated incredibly consistent results during the past five decades. Dow Theory completely avoided the 1987 stock market crash and the 2001 collapse following the internet bubble. Dow Theory also avoided the majority of the stock market decline following the 2008 global financial crisis. More recently, the indicator managed to escape the brutal sell-off from the global pandemic. The most recent buy signal occurred on 26 May.
Jack Schannep tested the Dow Theory indicator from 1953 through 2019. Based on Schannep’s results, the indicator produced an average annual return of 12.9%. During the same time period, a “buy and hold” strategy increased by 10.6% per year. Dow Theory outperformed “buy and hold” by 2.3% per year. These results are extremely impressive. There are very few indicators with the ability to outperform a buy and hold strategy by such a wide margin over the course of 60+ years.
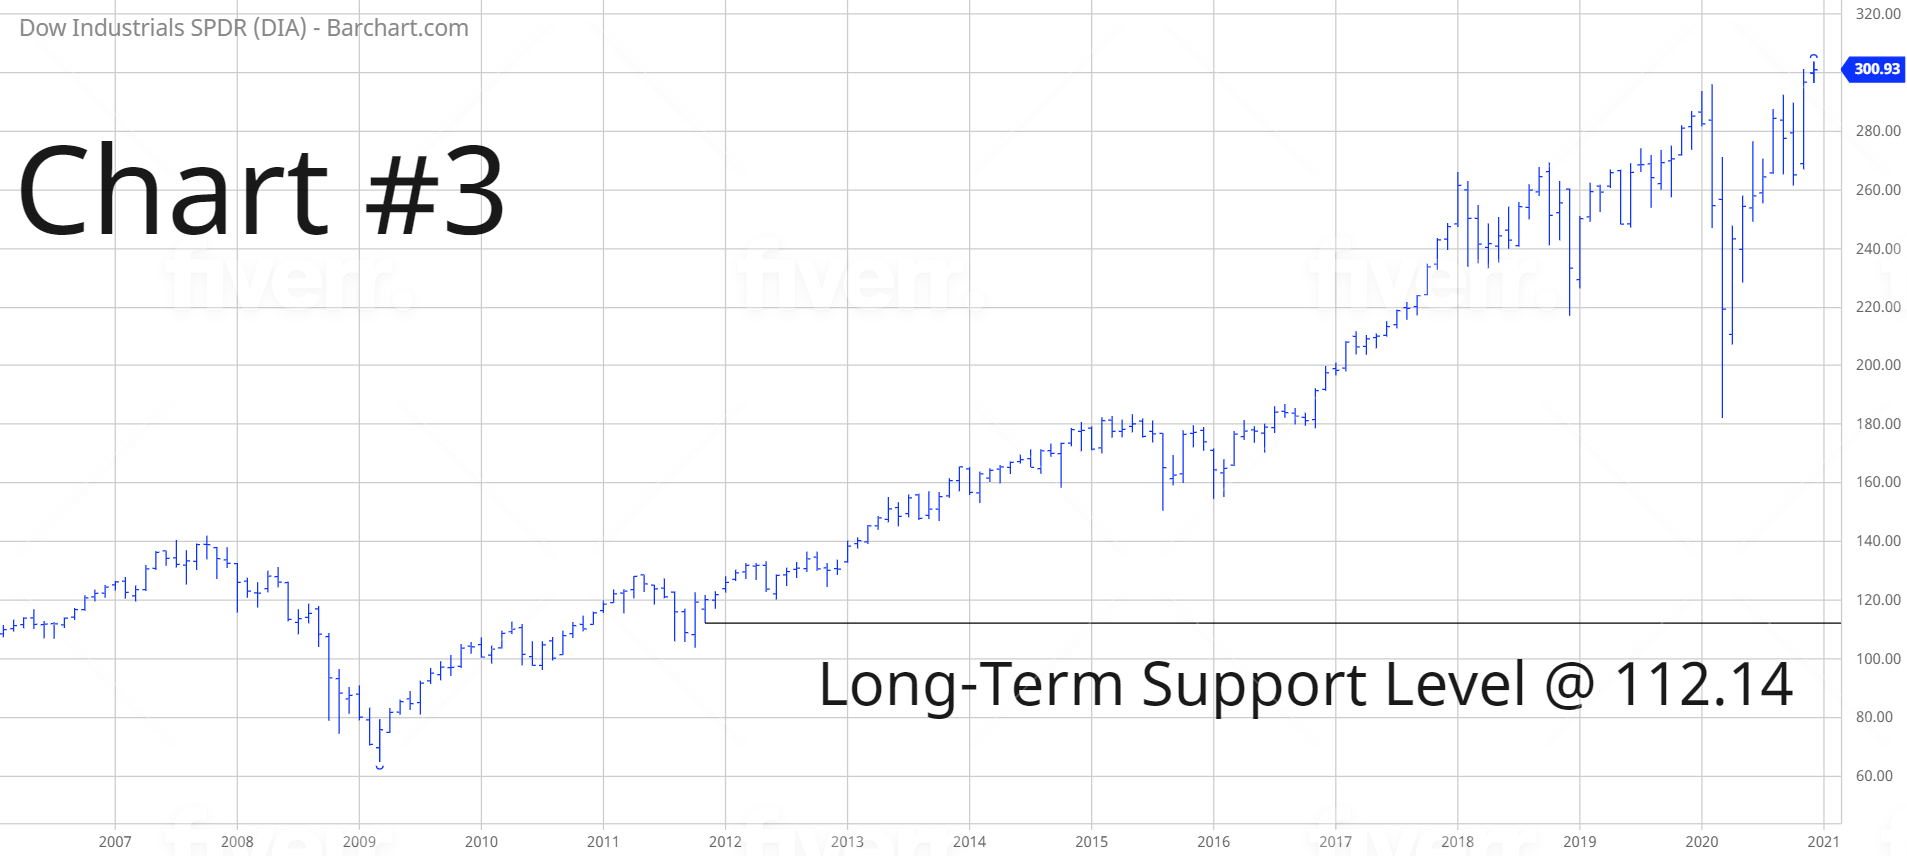
What about DIA? The long-term view remains very bullish. The next resistance level is 314.04. A weekly close below 112.14 is needed in order to reverse the momentum. It’s highly unlikely that the long-term momentum will turn bearish any time in the near future.
SHORT-TERM TREND
Please review the 6-month chart of DIA (Chart #2). DIA remains in bullish territory on a short-term basis. The next level of resistance is 303.60. The chart pattern will remain bullish as long as DIA stays above 261.41 on a weekly closing basis. The most likely scenario is a continuation of higher prices.
LONG-TERM TREND
Please review the 15-year chart of DIA (Chart #3). The long-term chart pattern continues to remain extremely bullish. The next level of resistance is 314.04. A weekly close below 112.14 is needed to flip the chart into a bearish formation.