SPDR S&P 500 ETF (SPY)
Key Statistics
Minor Support Level 362.03 Minor Resistance Level 398.12
Thank you for reading this post, don't forget to subscribe!Major Support Level 155.73 Major Resistance Level 414.34
Minor Buy Signal 404.31 Minor Sell Signal 359.17
Major Buy Signal 430.55 Major Sell Signal 139.54
BRIEF OVERVIEW
On 16 August 1971, President Richard M Nixon laid the foundation for hyperinflation in the United States by closing the gold window and removing the link between the US Dollar and gold, a link which had been firmly in place since the signing of the Bretton Woods Agreement in July 1944. This action by Nixon officially removed the convertibility of US Dollars into gold. By abandoning the gold standard, the United States could freely print unlimited sums of money without the impediment of linking an equal amount of gold to each printed currency unit.
Of course, like all good politicians, Nixon was able to dupe the American public into believing that the closing of the gold window was only temporary. The President assured US citizens that the gold window would be reopened immediately upon stabilization of the US Dollar, which had risen dramatically against our nation’s trading partners beginning in the late-1960s, thus placing the US economy at an extreme disadvantage.
Less than 12 months after Nixon closed the gold window, the US Dollar had stabilized, the country’s trade deficit had disappeared, the stock market was rising and the economy was gaining momentum. Without question, Nixon’s elimination of the gold standard turned out to be a raging success. In fact, removing the link between the US Dollar and gold had been so successful, that Nixon and his team of economic advisors quietly decided to permanently close the gold window. This decision by Nixon officially ended the 1944 Bretton Woods Agreement between the US and other major industrialized countries.
President Nixon had no intentions of notifying the American people of his decision to permanently remove the link between the US Dollar and gold. Very few people in the media questioned Nixon concerning his decision to close the gold window. As we mentioned, eliminating the gold standard was a “home run” for Nixon and the US economy. Everybody was happy. Consequently, Nixon never received any pushback from reporters or other members of the media. Of course, the good times did not last forever. By the mid-1970s, the US economy was struggling, inflation was heating up, stocks were in a bear market and the value of the US Dollar was declining against other foreign currencies. By the time these issues had surfaced, someone else had to deal with the problem because Richard Nixon was long gone. Although very few people were aware of it at the time, Nixon’s decision to close the gold window in August 1971, lit the fuse for hyperinflation in the United States. However, it would take another 50 years before the problem would turn into a crisis.
Have you ever wondered why the price of goods and services continues to rise year-after-year? Why does your trip to Wal-Mart always cost more and never less? Do you usually have less money remaining at the end of the month? The answer to these questions can be traced back to the elimination of the gold standard on 16 August 1971. President Nixon and his team of economic advisors supplied the necessary ingredients to ignite hyperinflation. Large macro events (like the closing of the gold window) rarely cause any problems immediately upon release. Invariably, these things take time to manifest themselves. Isn’t it ironic that as we approach the 50th anniversary of the elimination of the gold standard, that this decision by the Nixon administration has finally turned into a crisis?
For the past 100+ years, economists and financial experts have often debated on the root cause of hyperinflation. What are the main warning signs of hyperinflation and how can it be prevented? Despite years of analytical research and quantitative analysis, most professional economists agree that there is no “magic formula” for eradicating hyperinflation, particularly once it begins. Why? Because, more than anything, hyperinflation involves a loss of confidence in the country’s domestic currency. Once the citizens lose confidence in the currency, panic ensues and the value of the currency collapses, usually overnight. This explains why hyperinflation occurs so quickly.
Although there is no proven formula for preventing hyperinflation, warning signs do exist. Without question, the most obvious warning sign is an increase in a country’s supply of money. As you know from your college economics classes, as the supply of a good or service increases, the value decreases. For example, what happens to the price of corn when farmers produce a bumper crop? The price declines. The same thing applies to the value of money. When the Federal Reserve produces large amounts of US Dollars, the value declines. As we previously discussed, this explains why your weekly trip to Wal-Mart is more expensive today compared to five years ago.
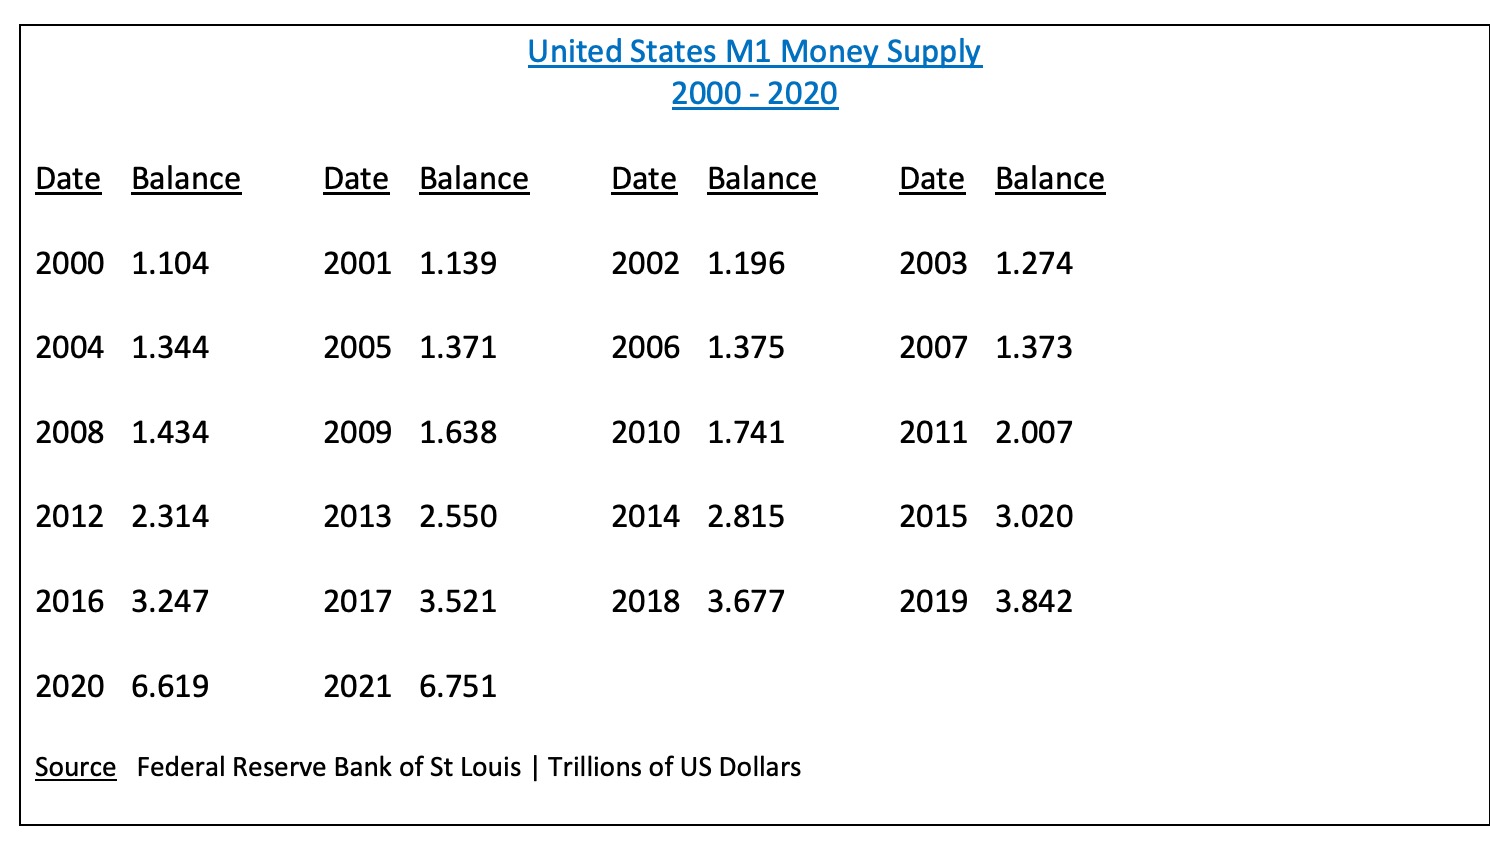
Please review the following table. As you can see, our nation’s central bank (i.e. Federal Reserve) has substantially increased the supply of money during the past two decades. Since 2000, the money supply has expanded 511%. This rate of increase is absolutely insane and completely unsustainable. Check out the huge spike from 2019 to 2020. The money supply exploded by 72%. Why did the Federal Reserve raise the money supply by such a large amount in 2020? Because government officials and monetary leaders were desperately trying to resurrect the US economy following the global pandemic.
By massively increasing the US money supply, our nation’s monetary leaders have significantly enhanced the likelihood of a hyperinflationary event in the United States within the next few years. This is a “tell-tale” sign of desperation from the Federal Reserve. The professional investment community is fully aware that the Fed has backed themselves into a corner. This is a perfect example of how investors begin to lose confidence in a country’s domestic currency, like the US Dollar. When confidence is lost, hyperinflation is unleashed.
Note: For those of you who are curious, the level of the US money supply in August 1971, just prior to Nixon’s closing of the gold window, was a paltry $225.6 billion. Over the course of the past five decades, our nation’s monetary authorities have expanded the money supply by 2,892%. In retrospect, it’s a miracle that the US has avoided hyperinflation for so long.
Over the course of the past few centuries, there have been several examples of hyperinflation. When most people think of recent examples of hyperinflation, they are reminded of Brazil, Venezuela and Zimbabwe. Please review the following list.
Historic Examples Of Hyperinflation
- Austria 1921 – 1922
- Bolivia 1970s – 1980s
- Brazil 1985 – 1994
- China 1948 – 1949
- Germany 1920 – 1923
- Greece 1941 – 1946
- Peru 1980s – 1990s
- Venezuela 2016 – present
- Yugoslavia 1989 – 1994
- Zimbabwe 2007 – 2008
Although the United States did not make the list, our nation has certainly experienced periods of hyperinflation during its 245-year history. The first episode of hyperinflation occurred during the Revolutionary War in the late 1770s. At its peak in 1779, the monthly rate of inflation reached 47% (564% annualized). The most recent example of hyperinflation in the US appeared during the Civil War between 1861 and 1865. In an effort to finance the war, the confederate states decided to print their own currency, the Confederate Dollar. The currency became practically worthless, particularly throughout the south.
These days, many people are under the assumption that the United States is immune to hyperinflation. They believe that the stability of the US Dollar will prevent our nation from experiencing high levels of inflation. Nothing could be further from the truth. The United States is more vulnerable to hyperinflation today than at any other time in the past 150 years.
Is hyperinflation bullish or bearish for the stock market? Based on historical research, hyperinflation is extremely bullish for stock prices. As the inflation rate spirals out of control and the country’s domestic currency plummets in value, investors seek shelter by purchasing assets that can’t be printed out of thin air. These assets are known as tangible assets (or hard assets). The list includes stocks, precious metals, commodities, real estate, undeveloped land and agricultural land. Tangible assets have proven to be an excellent store of value during inflationary periods.
In an effort to provide investors with exposure to the S&P 500, the SPDR family of exchange traded funds (managed by State Street Global Advisors) introduced the S&P 500 ETF on 22 January 1993. The ticker symbol is SPY. The ETF allows investors to participate in the S&P 500 without the burden of owning shares of each company within the index. SPY is historically significant because it was the very first exchange traded fund listed in the United States. SPY is easily the most heavily traded ETF, with daily volume usually exceeding 100 million shares.
SHORT-TERM VIEW
Stocks have exploded to the upside as investors anticipate additional money printing by the Federal Reserve and multiple stimulus packages from the Biden administration. The short-term momentum has been in favor of the bulls for the past several months. The next level of resistance is 398.12. The momentum will turn bearish on a weekly close below 362.03.
Based on the Aroon Oscillator, SPY has a fairly neutral reading of +36. The Aroon Oscillator is programmed differently than most stochastic indicators. The oscillator fluctuates between -100 and +100. A reading of 0 would indicate a neutral position. Therefore, a reading of +36 is considered relatively neutral. Based on the current level of the oscillator, the next big move could be in either direction. The most likely direction is a breakout to the upside.
LONG-TERM VIEW
As you know from our previous discussions, the Federal Reserve unleashed an aggressive money printing program in response to the global pandemic. Within the past 12 months, the Fed has essentially doubled the US money supply. Therefore, we should not be surprised that prices of basic goods and services have exploded since March 2020. In addition to goods and services, the value of speculative assets have exploded to the upside. Please review the following table.
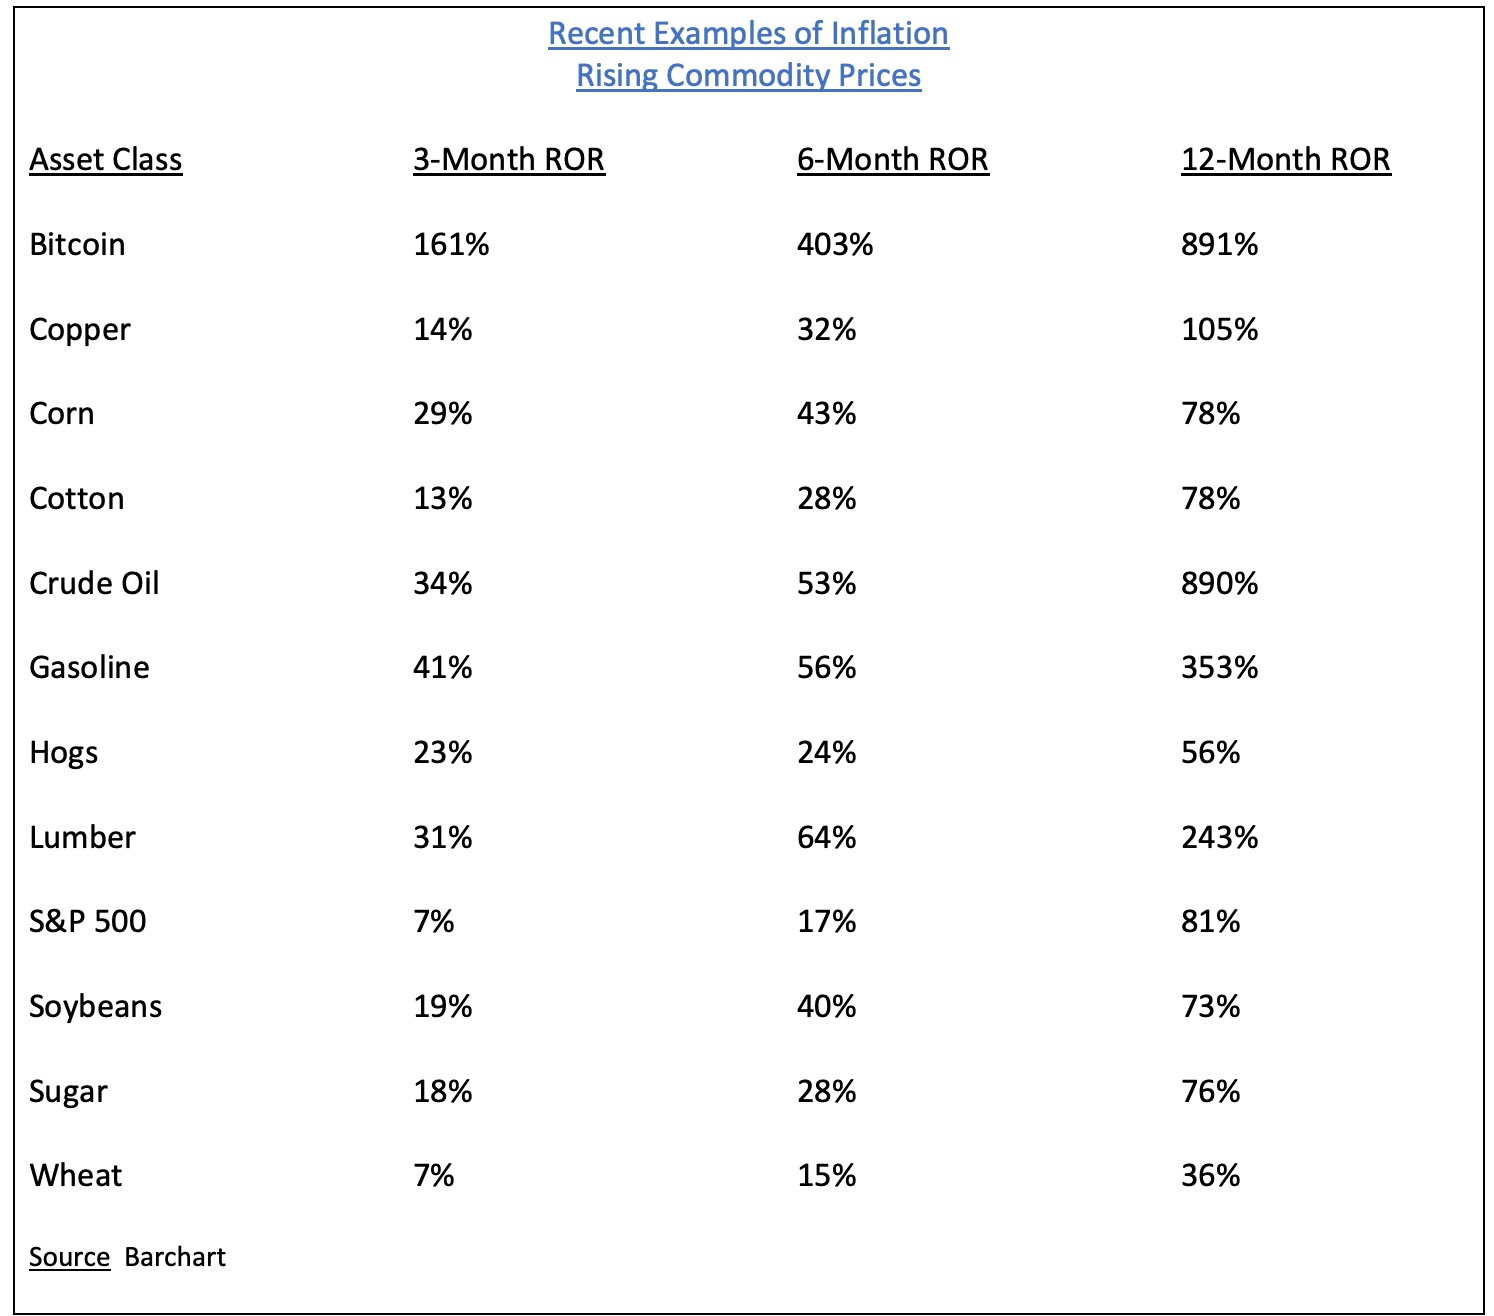
As long as our nation’s central bank continues to keep its foot on the accelerator by expanding the money supply, speculative assets will move relentlessly higher. Speculative assets include stocks, commodities, precious metals, artwork, antiques, collectibles, jewelry and rare coins. This is a clear indication that wealthy investors are exchanging their US Dollars for tangible assets, as they prepare for much higher rates of inflation during the next few years.
Two of the wealthiest men on the planet are aggressively adjusting their portfolios. On the surface, it certainly appears as though Bill Gates and Warren Buffett are preparing for higher levels of inflation in the United States.
During the past 12 months, Buffett has invested in gold miners and oil companies. Buffett is also investing in Japan, which is less likely to experience high levels of inflation compared to the United States.
Bill Gates is one of the most intelligent investors on the planet. Currently, he is the third wealthiest person in the world, with a net worth of $132 billion. During the past five years, Gates has methodically (and quietly) reduced his ownership stake in Microsoft. Gates is fully aware that the United States is probably on a collision course with rising levels of inflation. Therefore, he invested the proceeds of his Microsoft stock in assets that serve as a hedge against inflation. Specifically, Gates made the following investments:
- Deere & Company
- Western Asset/Claymore Inflation-Linked Opportunities & Income Fund
- Cornerstone Building Brands
- Private farmland
- Undeveloped land
What do these investments have in common? What is the major theme? Each of these assets have historically worked well during periods of rising prices. In other words, Gates is “inflation-proofing” his investment portfolio in an effort to survive a major inflationary spike within the next 3 to 5 years.
Let’s take a brief look at Gates’ portfolio. He owns an enormous amount of Deere & Company common stock. His ownership position is $9.1 billion, which represents a huge chunk of his overall portfolio @ 6.9%. For those of you who may not be familiar, Deere & Company is more commonly known as John Deere, which is the world’s largest manufacturer of agricultural equipment. If inflation arrives in the United States, agriculture prices will move sharply higher. Deere & Company will benefit substantially from this type of event.
Recently, Gates became the largest landowner in the United States. He owns more acres of undeveloped land than any other person in North America. This is no accident. Gates sees the writing on the wall. He has been preparing for the inevitable surge of inflation probably for the past decade. He has positioned his portfolio to suffer the least amount of damage if hyperinflation rears its ugly head.
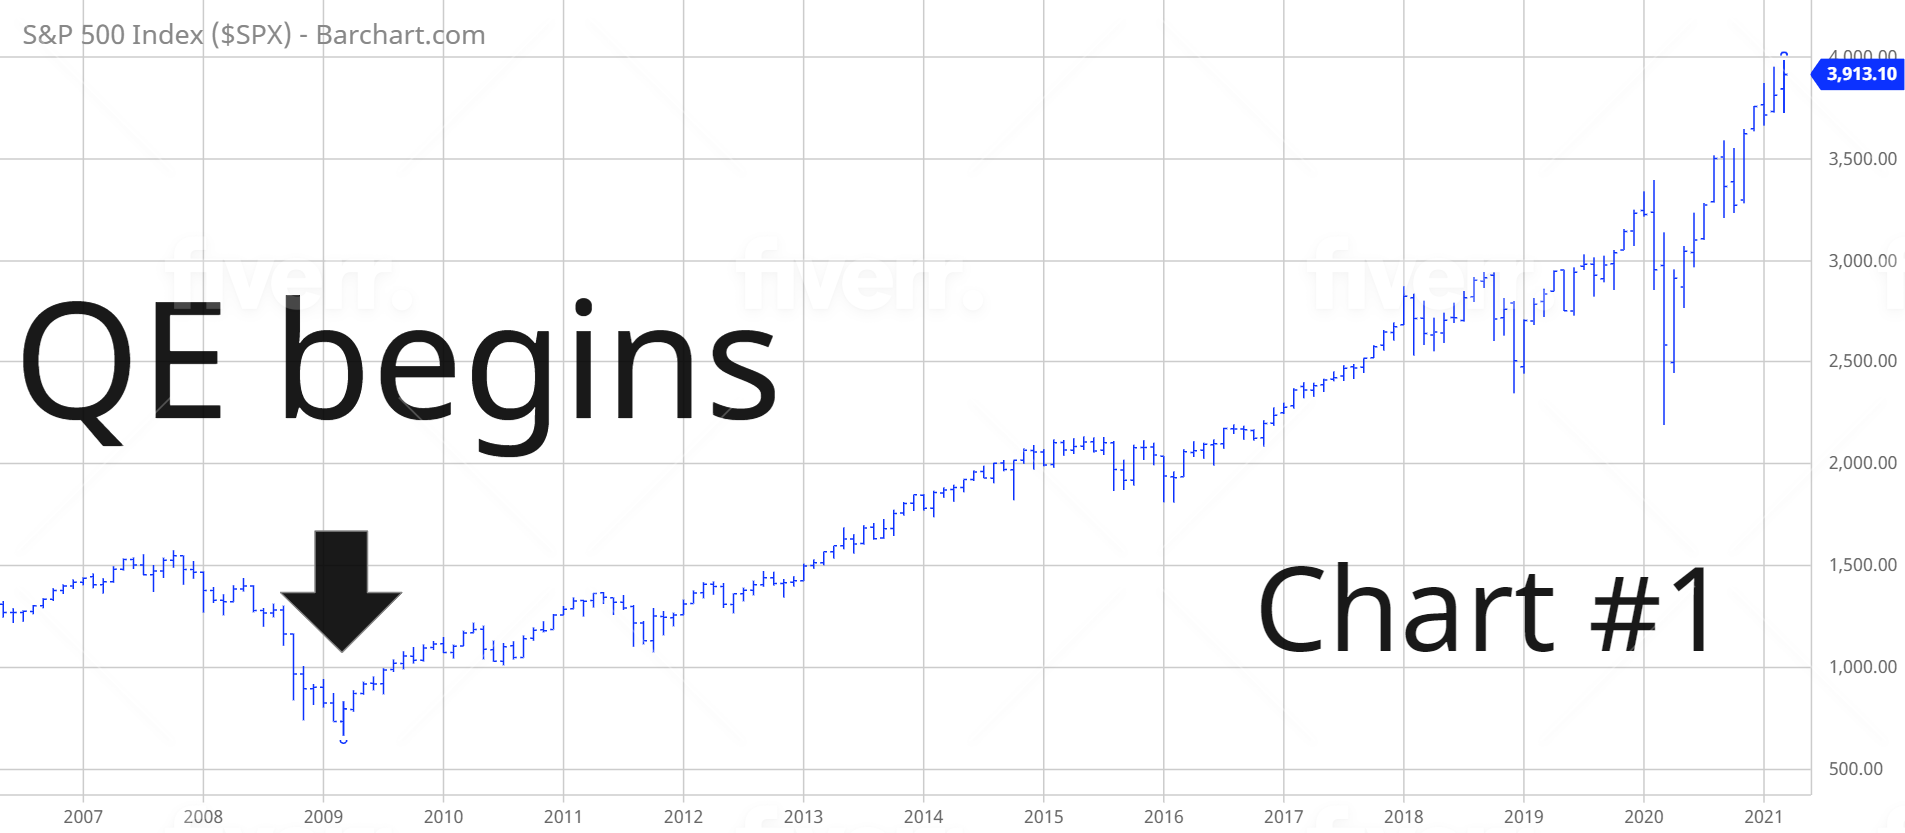
The Federal Reserve began aggressively pursuing money printing and quantitative easing following the 2008 global financial crisis. With the brief exception of March 2020, stock prices have been moving continuously higher for the past 13 years (Chart #1). Most likely, this trend will continue.
In regard to SPY, the long-term view remains extremely bullish. The next resistance level is 414.34. A weekly close below 155.73 is needed in order to reverse the momentum. It’s highly unlikely that the long-term momentum will turn bearish any time in the near future.
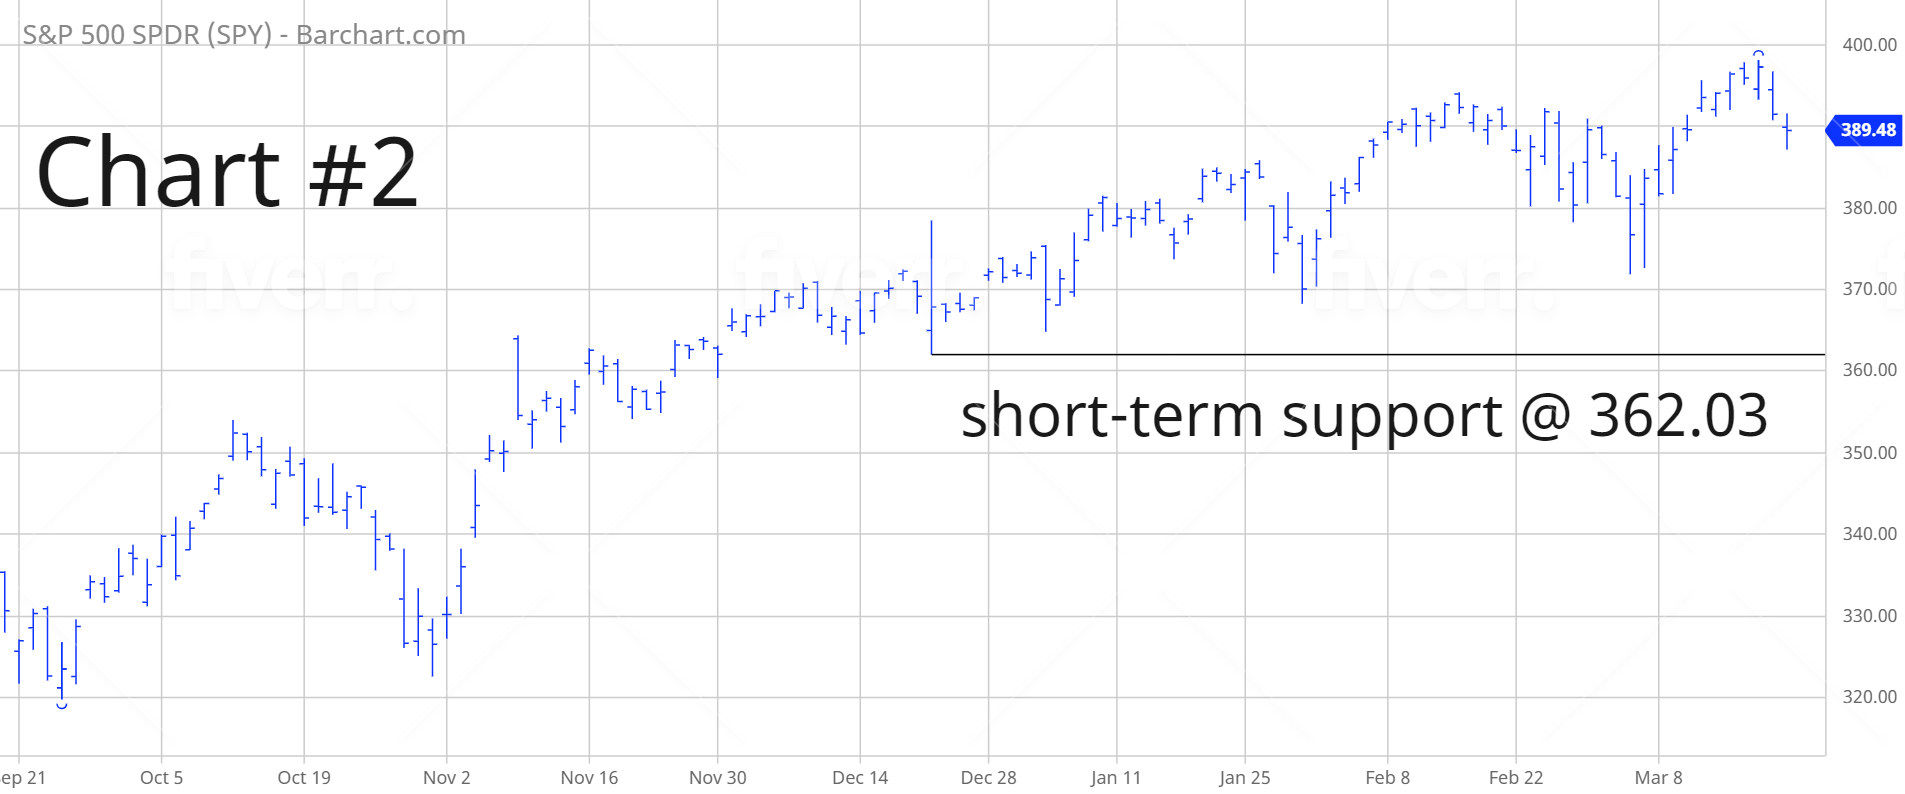
SHORT-TERM TREND
Please review the 6-month chart of SPY (Chart #2). The ETF recently recorded a new all-time high on 17 March. The short-term trend has been incredibly bullish for the past 12 months following the pandemic low in March 2020. The next level of resistance is 398.12. The chart pattern will turn bearish on a weekly close below 362.03. The most likely scenario is a continuation of higher prices.
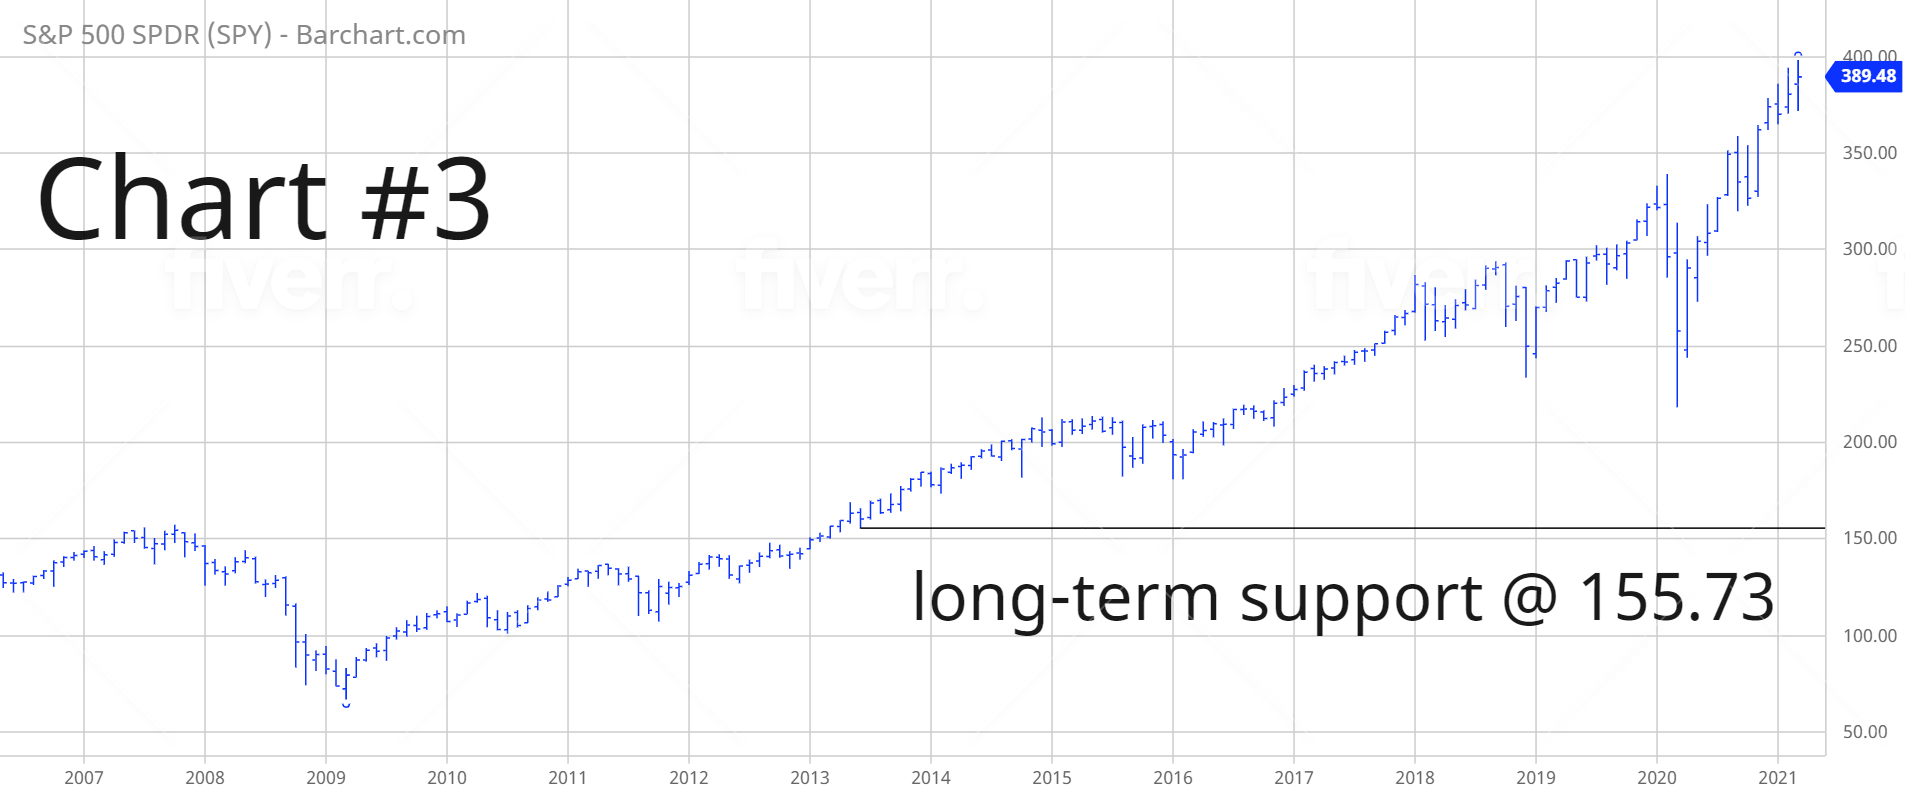
LONG-TERM TREND
Please review the 15-year chart of SPY (Chart #3). The long-term trend remains extremely bullish. In order to create a bearish chart pattern, SPY must fall below 155.73 on a weekly closing basis. Highly unlikely.