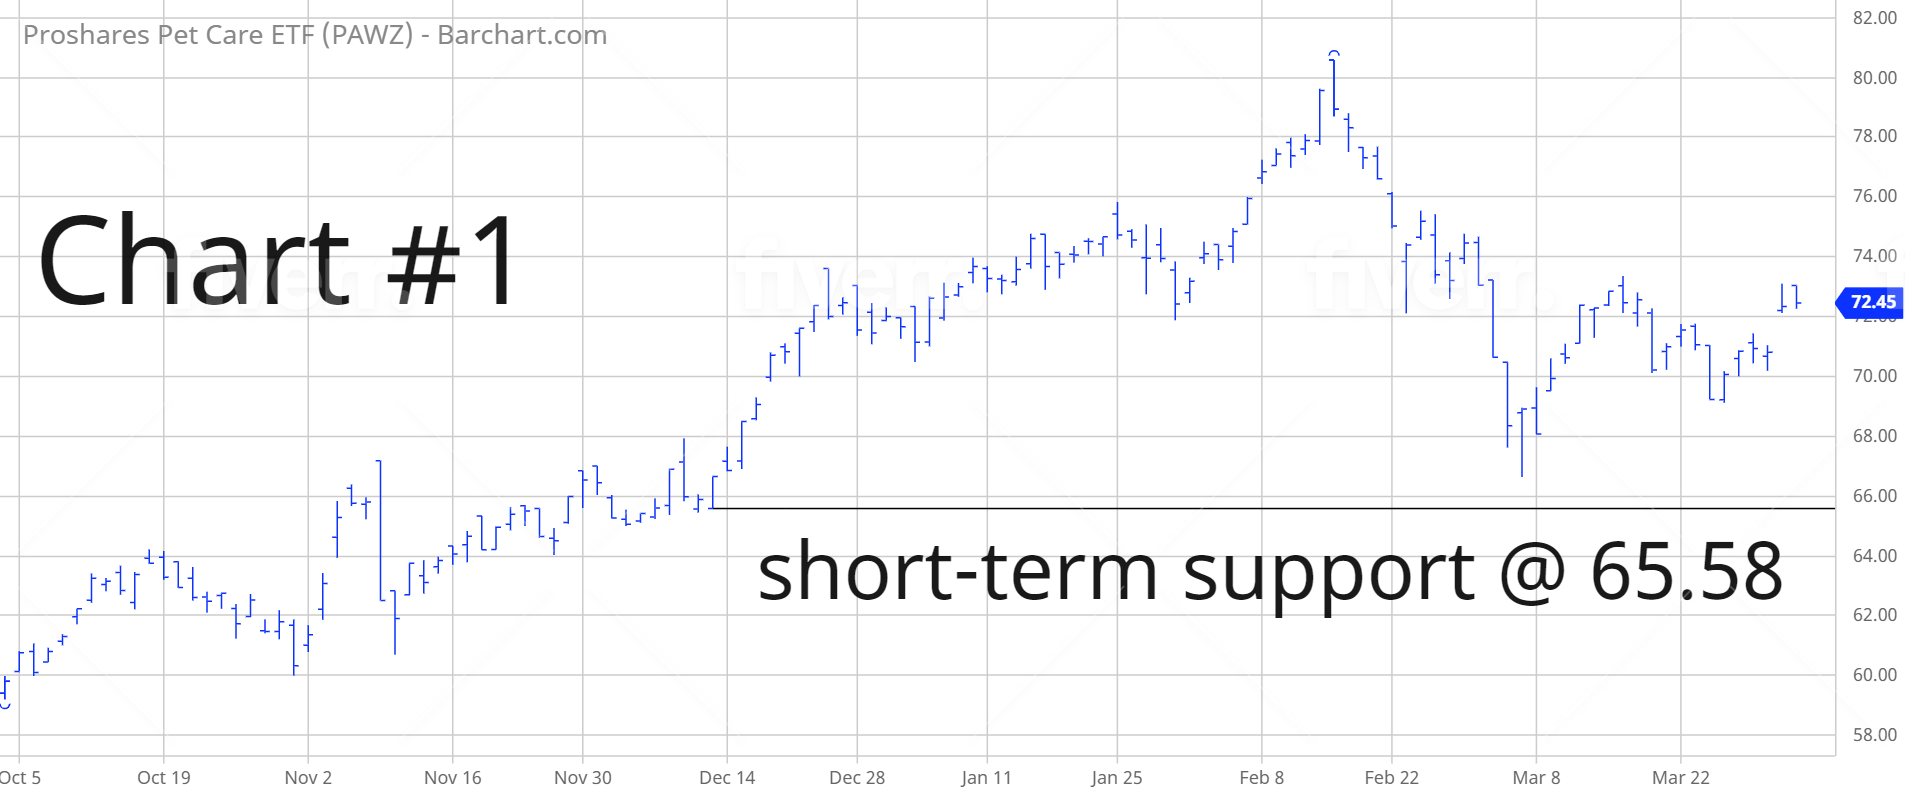
ProShares Pet Care ETF (PAWZ)
Key Statistics
Thank you for reading this post, don't forget to subscribe!
Minor Support Level 65.58 Minor Resistance Level 77.68
Major Support Level 43.01 Major Resistance Level 89.28
Minor Buy Signal 80.58 Minor Sell Signal 62.74
Major Buy Signal 94.66 Major Sell Signal 38.17
SHORT-TERM VIEW – PAWZ
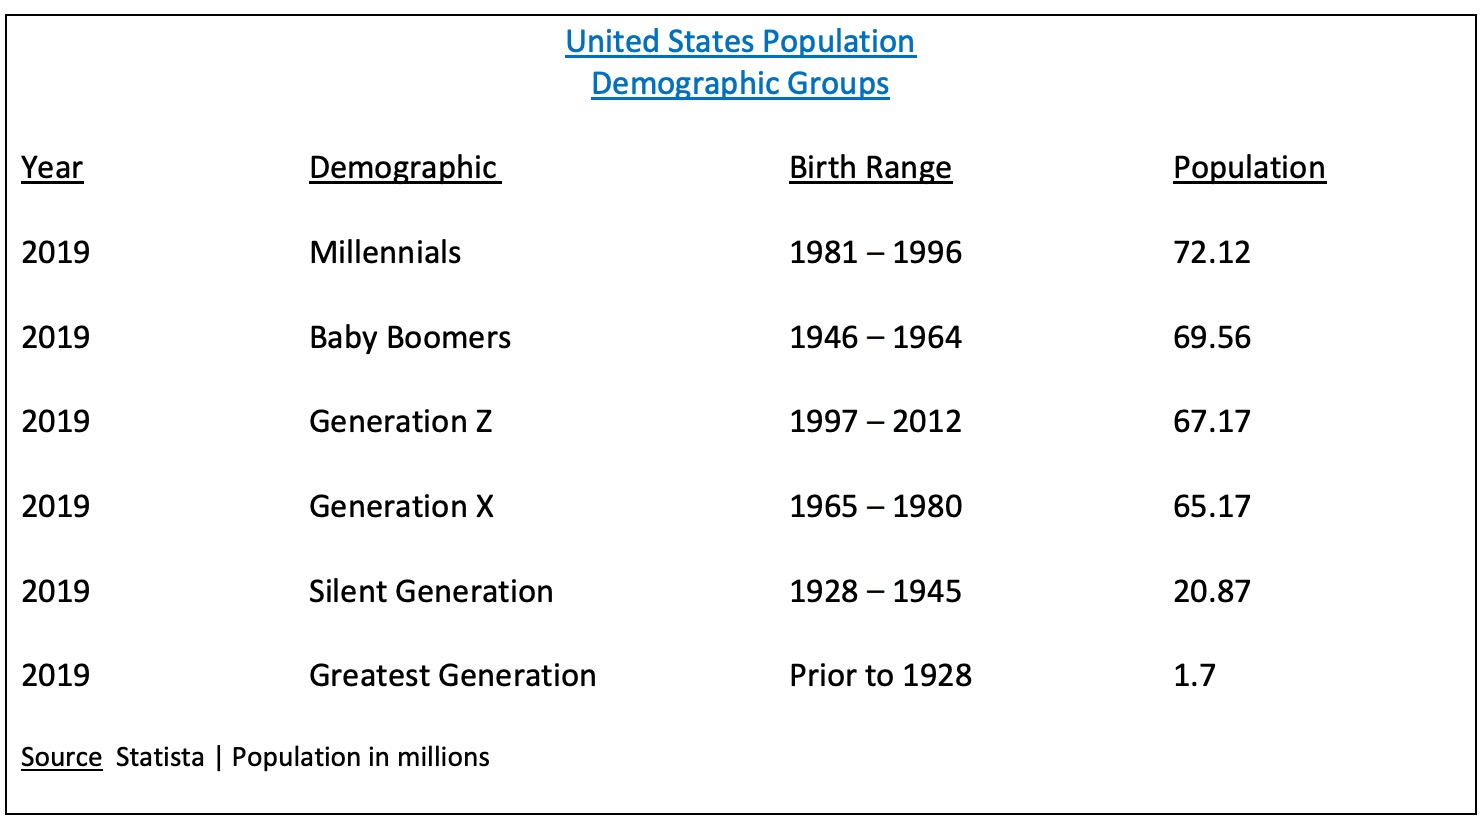
On 1 July 2019, a monumental shift occurred in our nation’s population. For the first time since 1999, the Baby Boomer generation lost the title as the largest demographic group in the United States. They were surpassed by the Millennial generation, with a population of 72.12 million in July 2019. Baby Boomers peaked in 1999, with a population of 78.8 million. Based on data provided by Pew Research Center, Millennials will peak in 2033, with a population of 74.9 million. Unlike previous demographic groups, the death rate of Millennials during the next two decades will have very little impact on the overall population. For example, the projected Millennial population in 2050 will be 72.2 million. Over the course of the next 20 years, the population will decline by only 2.7 million. How is it possible for the Millennial demographic group to remain so strong? The answer can be found in our nation’s immigration policy. According to Pew Research, immigration will add more numbers to Millennials during the next two decades than any other demographic group. Therefore, Millennials will play a major role in shaping the US economic environment for the next several years.
In addition to the Millennial population, Generation Z will also lay the groundwork in determining the economic trends of the United States well into the future. As you can see from the table, the Gen Z population in 2019 was 67.17 million. This particular cohort is growing incredibly fast, recently surpassing Generation X as the third largest demographic group in the United States. Today, Millennials and Generation Z comprise over 50% of the US population. Going forward, these two demographic groups will carry an enormous amount of influence on the spending patterns of the US population for the next few decades.
Without question, one of the most noticeable societal changes during the past decade has been the steady reduction in our nation’s birth rate within the female population. Actually, this is not a new phenomenon. The birth rate in the United States has been declining since 1950. Over the course of the past 70 years, there have been only a small number of times where the annual birth rate actually increased. Please review the following tables.
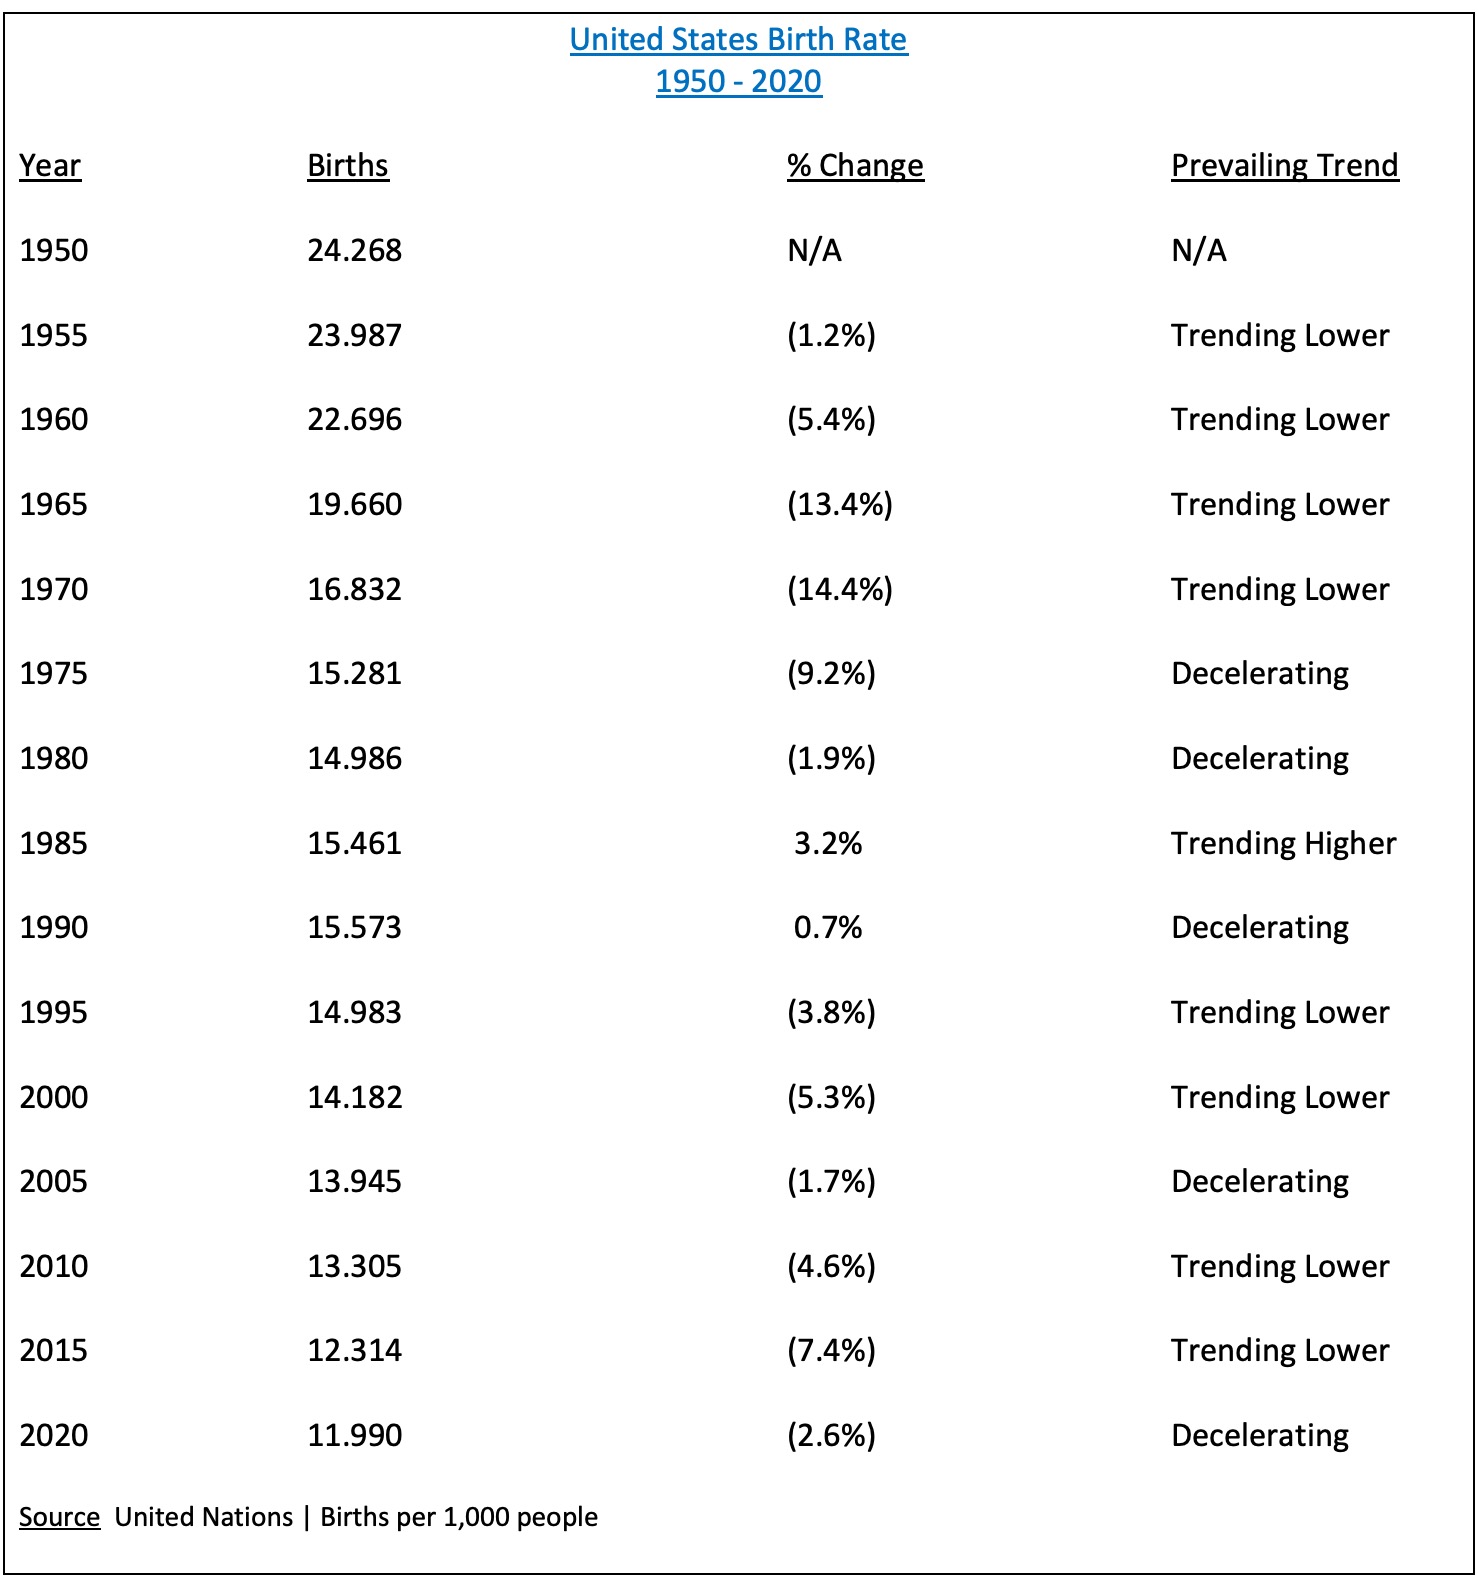
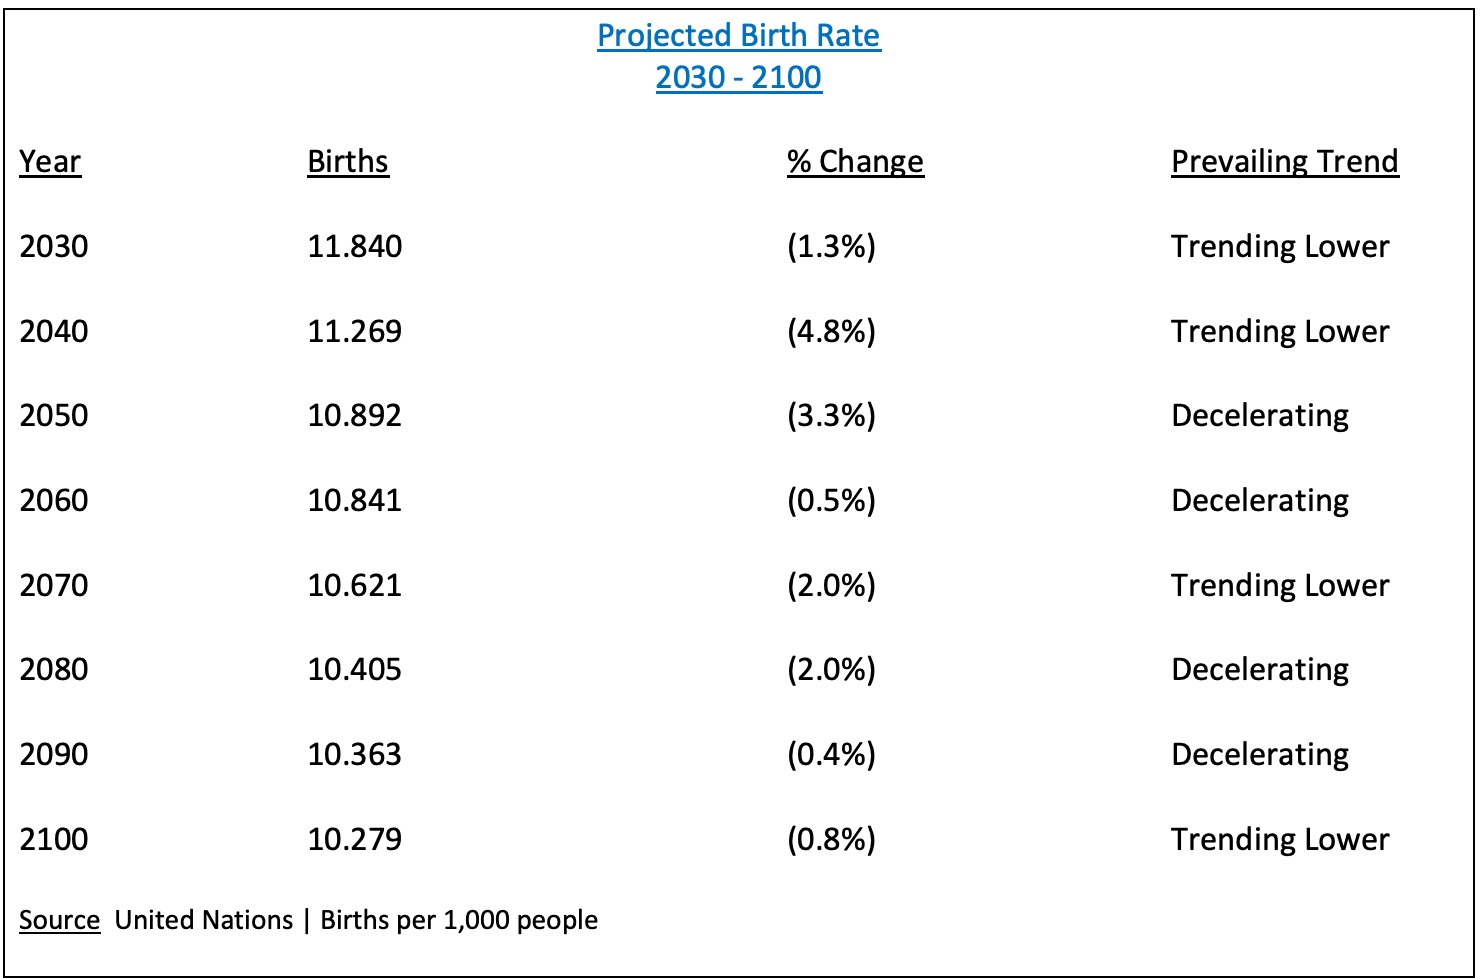
As you can see from the first table, birth rates in the United States have been on a downhill trajectory for the past 70 years. In 1950, the rate of birth was 24.268 per thousand. By 2020, the number had fallen to 11.990. This represents a dramatic decline of 50.6%. According to the United Nations, the birth rate is not expected to improve any time in the near future. Based on internal data gathered by the UN, the rate of birth in the United states will continue to decline for at least the next 70 years. Why are Millennials and the older members of Generation Z planning to continue the trend of having fewer babies? More importantly, what specifically are they doing to replace the experience of having children?
There are several reasons why women in the childbearing age group are postponing (or completely eliminating) the experience of having a family. Let’s examine a few of the reasons.
2008 Global Financial Crisis – Even though GFC occurred 13 years ago, women still consider this event to be one of the main reasons why they have decided to delay staring a family. From a financial perspective, GFC was such a traumatic event that it caused young married couples to rethink parenthood. Based on data provided by the Urban Institute, the number of births plummeted in 2007 by over 500K from the previous year, as GFC was spreading across the domestic economy. The birth numbers continued to remain weak for the next few years in response to GFC.
Having babies is expensive – According to data provided by the US Department of Agriculture (USDA), the annual cost to raise a child is $12,980. If inflation is factored into the equation, parents can expect to pay $233,610 for the first 17 years of the child’s life. This number does not include the cost of a college education. If we consider the fact that many of today’s Millennials are still in the process of eliminating college debt, the thought of adding a baby to the mix is simply too much to handle from a financial standpoint.
Fewer millennials are tying the knot – Of course, getting married is not a prerequisite for having children. However, many surveys over the years consistently point to the fact that married couples tend to have more babies compared to unmarried couples. Therefore, as long as the millennial population continues to remain unmarried, fewer babies will be born.
Millennials and Gen Z are career-oriented – Although many sociology professionals will argue that stay-at-home moms are making a comeback, a large swath of today’s recent female college graduates are choosing to have a career over starting a family. Based on data collected from various surveys, young women feel the need to start a working career in order to justify the cost of attending college. Therefore, at the very least, starting a family is being postponed.
If today’s twenty-somethings are delaying starting a family, what are they doing to replace the experience of raising children? Many are turning to pets as a way to fill the void. Over the course of the past two decades, pets and the pet care industry has turned into a multi-billion dollar behemoth. This industry is just beginning to enter the “sweet spot” of its product life cycle. Consequently, the growth potential is quite substantial.
In order to provide investors with a vehicle for speculating in the pet care industry, the ProShares (formerly known as PowerShares) family of exchange traded funds launched the ProShares Pet Care ETF, using the ticker symbol is PAWZ. The launch date was 5 November 2018. This is a perfect investment product for speculators who want exposure to the pet care industry. The top five holdings include IDEXX Laboratories Inc, Freshpet Inc, Chewy Inc, Zoetis Inc and Dechra Pharmaceuticals Plc.
SHORT-TERM VIEW
Following the brutal decline from the global pandemic, PAWZ embarked on a dramatic recovery beginning on 18 March 2020. Over the course of the next 11 months, PAWZ advanced 157%. The top occurred on 16 February @ 80.58. The ETF has traded sideways-to-lower during the past six weeks, as it became incredibly overbought. Despite the recent decline, the bulls are still in control of the short-term momentum. A weekly close below 65.58 is needed in order to reverse the momentum in favor of the bears. The next level of resistance is 77.68.
LONG-TERM VIEW
The growth rate of the pet industry has exploded during the past decade. More importantly, the industry is dominated by Millennials and Generation X. Why is this so important? Because both of these demographic groups have entered the phase of their working career that typically delivers the highest earnings potential.
Pet owners in the United States
- Millennials – 35%
- Generation X – 32%
- Baby Boomers – 27%
- Silent Generation – 6%
Based on data provided by Common Thread Collective, Millennials and Generation X comprise approximately 70% of all pet owners in the United States. Given the fact that pet ownership is so highly concentrated, the major pet retail establishments have implemented a hyper-focused marketing campaign in an effort to maximize the spending habits of these pet owners. This type of marketing strategy has been hugely successful, as pet industry expenditures have increased every single year since 1994. Please review the following tables.
As you can see from the tables, the growth rate of the pet industry has been absolutely incredible. The average annual growth rate since 1994 is 7.2%. The industry has enjoyed 26 years of consecutive growth. Pet owners continued to spend money even during the dotcom crash and the global financial crisis. This is a clear indication that the pet industry is “recession proof.” Based on its current trajectory, the pet industry in the United States will be valued at $350 billion by 2027.
Specifically, how are pet owners spending their money within the pet industry? According to the American Pet Products Association, the industry is divided into four main categories.
Spending patterns of pet owners in 2020
- Food and treats – $38.4 billion
- Veterinary – $30.2 billion
- Supplies and animals – $19.8 billion
- Other items – $10.7 billion
In terms of how purchases are made, pet owners prefer online shopping over brick & mortar. In fact, pet owners are one of the largest users of e-commerce. For example, online shopping increased 274.9% from 2013 through 2018. This explains why the largest pet companies in the United States have focused the majority of their marketing budget on e-commerce.
In regard to PAWZ, it’s difficult to provide a long-term forecast because the ETF has only been in existence for 2 ½ years. Following the pandemic low in March 2020, PAWZ has enjoyed a tremendous advance. The momentum is clearly in favor of the bulls.
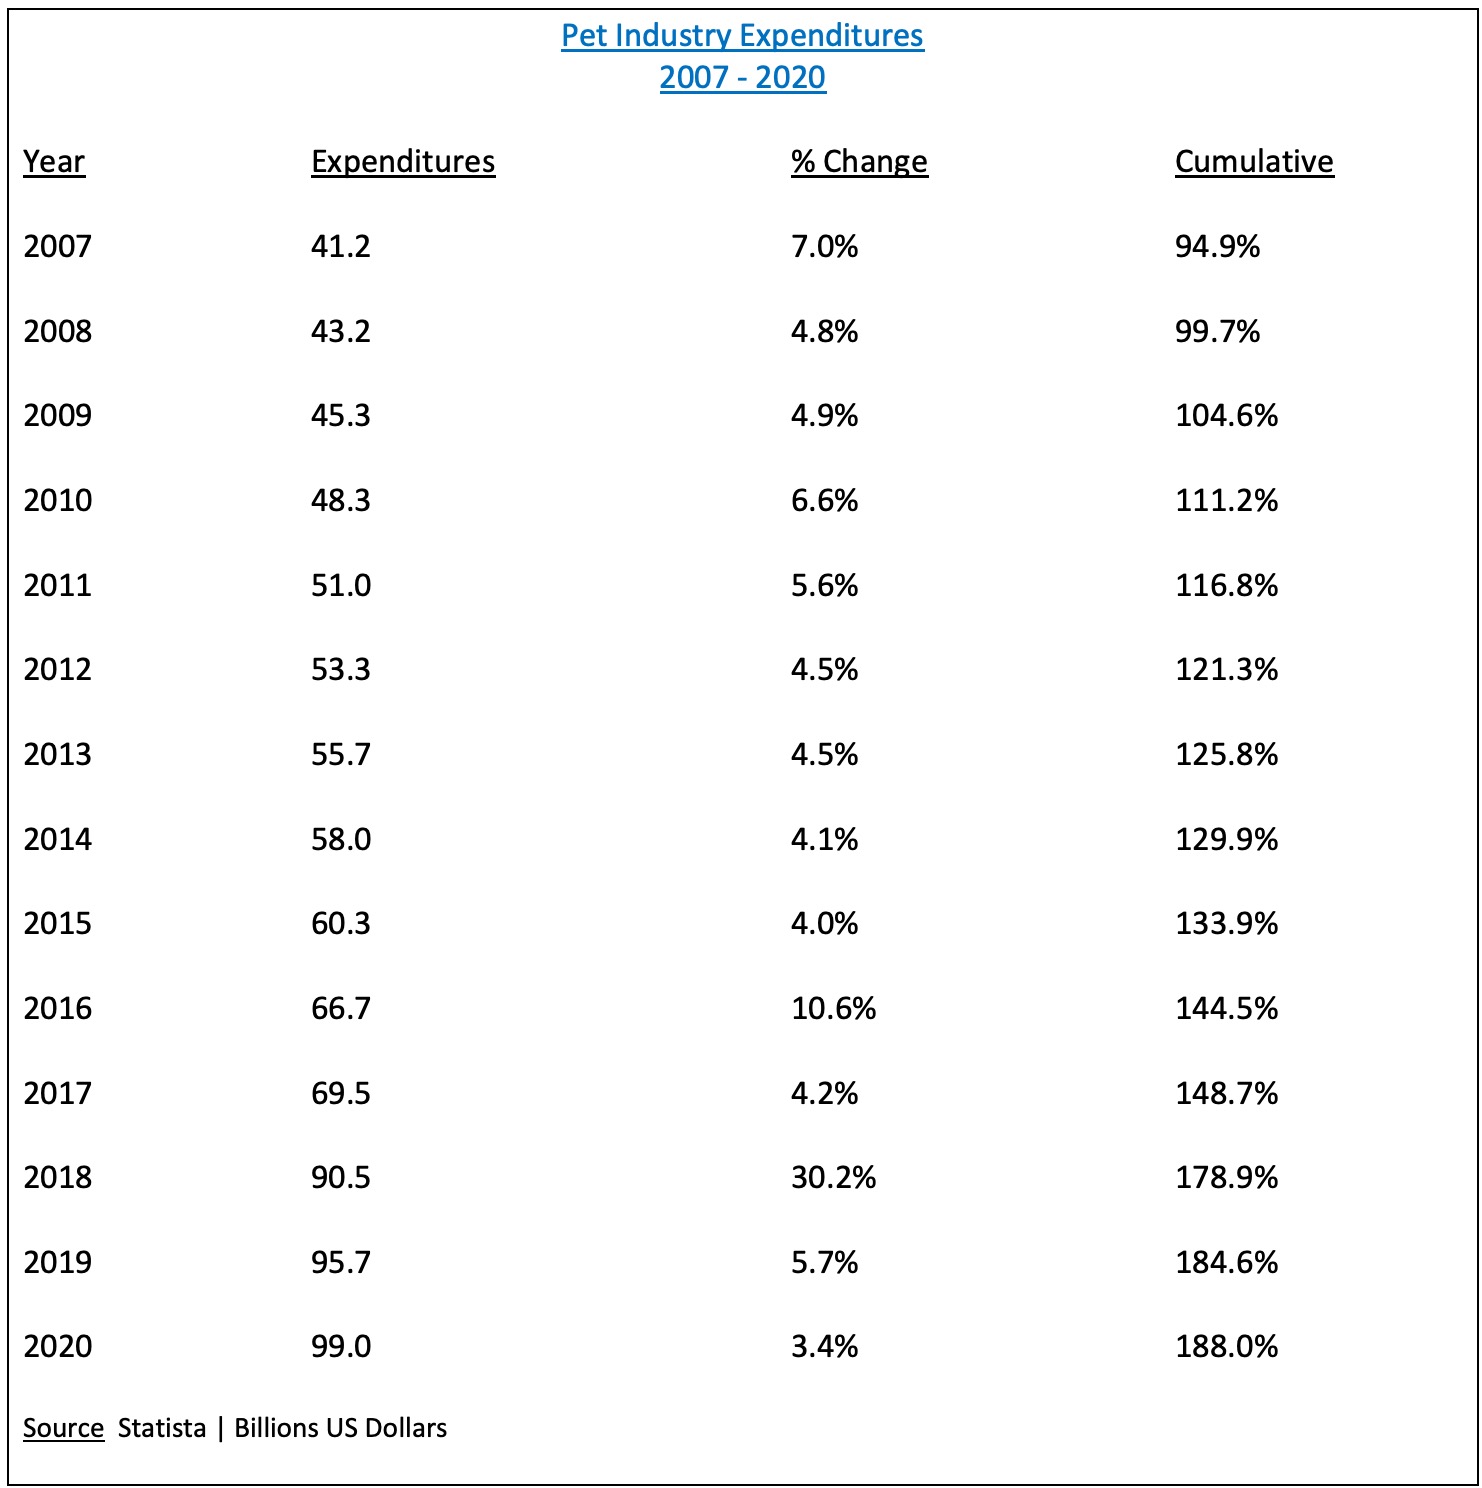
SHORT-TERM CHART – PAWZ
Please review the 6-month chart of PAWZ (Chart #1). Despite the recent decline, the short-term chart pattern remains bullish. A weekly close below 65.58 is needed in order to create a bearish chart pattern. The next level of resistance is 77.68.
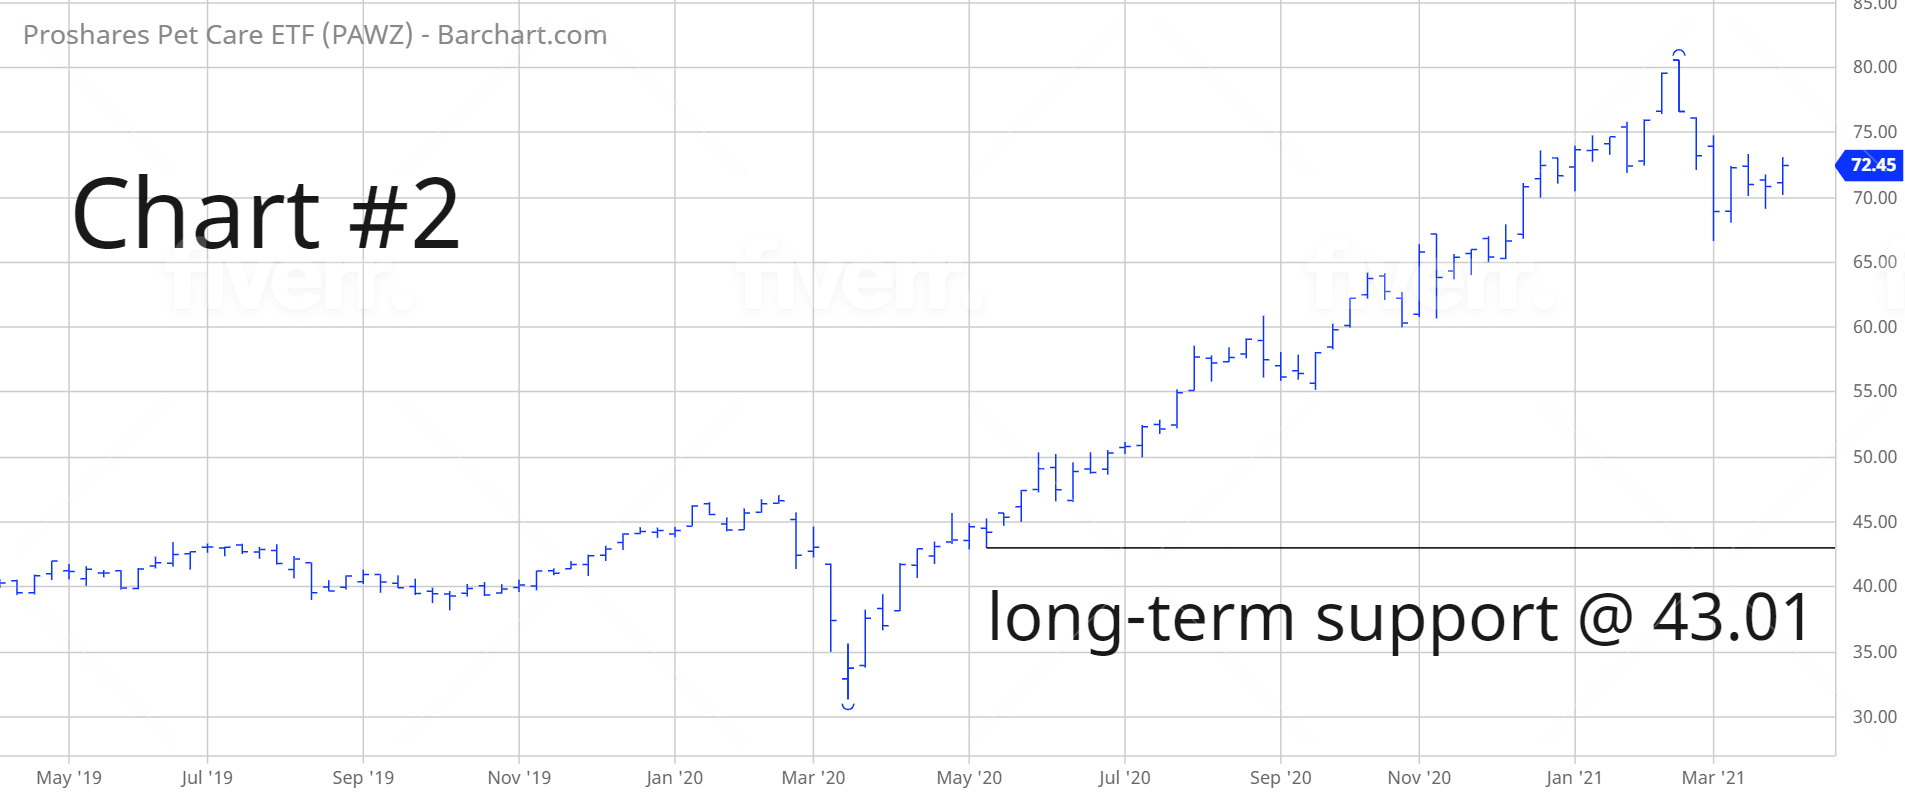
LONG-TERM CHART – PAWZ
Please review the 2-year chart of PAWZ (Chart #2). Based on the fact that PAWZ has only been in existence for 2 ½ years, it’s difficult to provide a long-term forecast. However, PAWZ has generated a substantial recovery following the pandemic low in March 2020. The momentum is clearly in favor of the bulls. A weekly close below 43.01 is needed in order to reverse the bullish chart formation.