Bitcoin Investment Trust (GBTC)
Key Statistics
Thank you for reading this post, don't forget to subscribe!
Minor Support Level 39.00 Minor Resistance Level 58.22
Major Support Level 9.25 Major Resistance Level 76.62
Minor Buy Signal 65.25 Minor Sell Signal 36.15
Major Buy Signal 88.00 Major Sell Signal 5.01
SHORT-TERM VIEW – GBTC
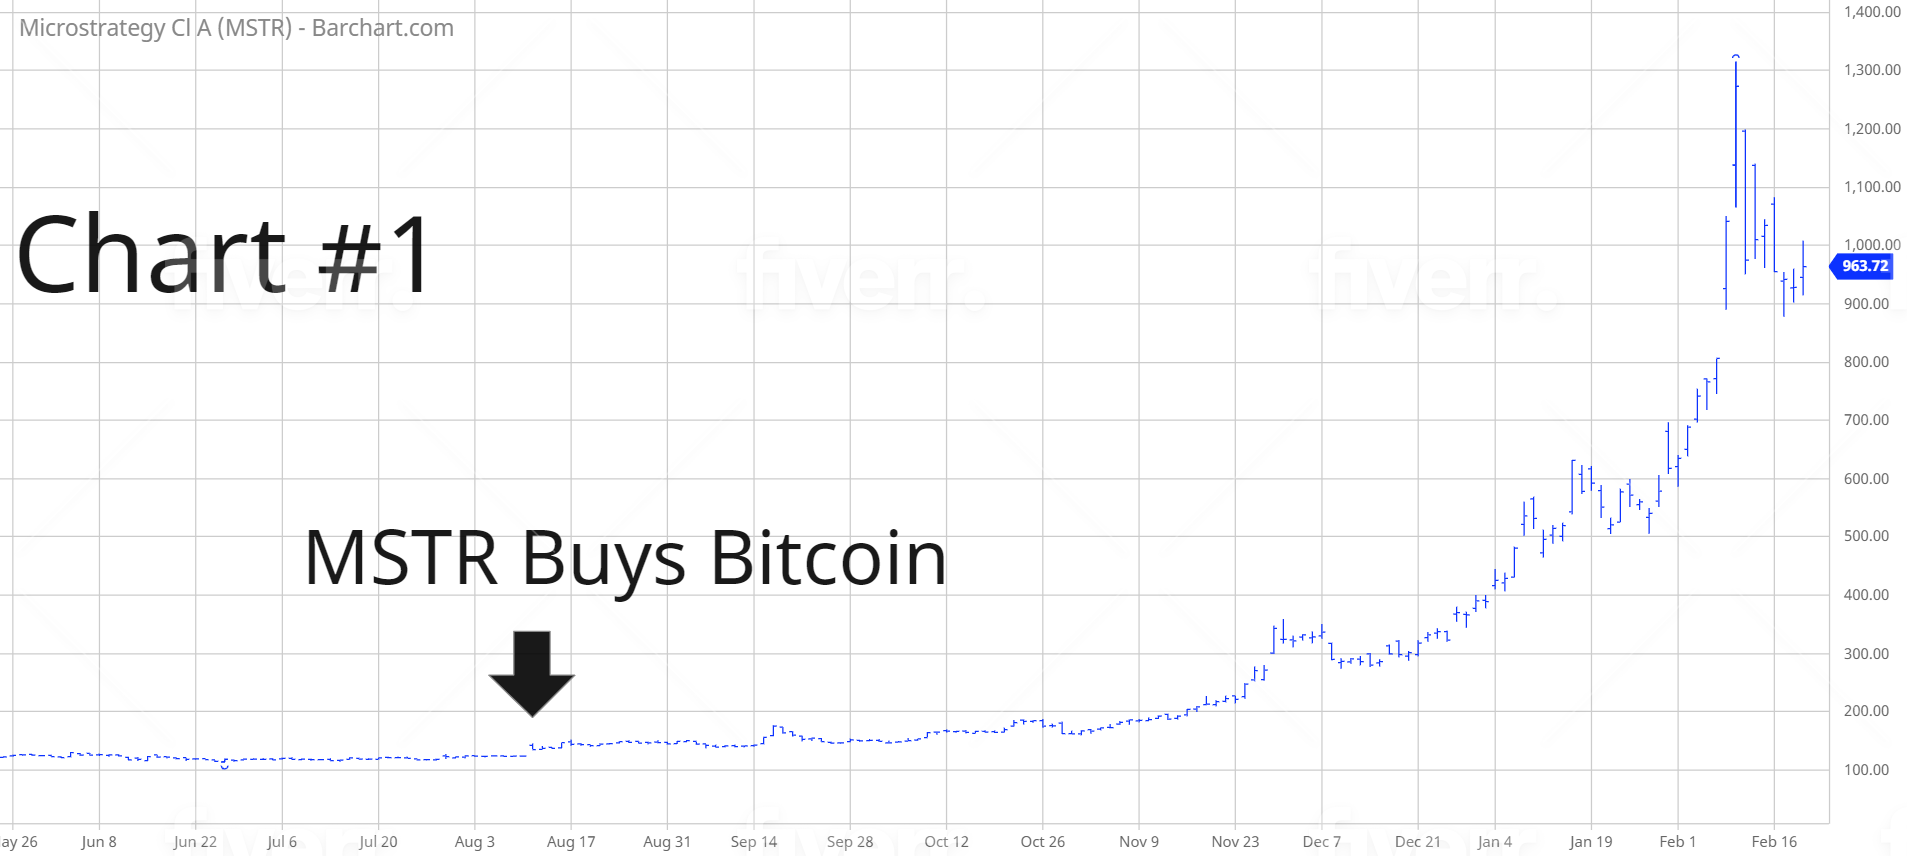
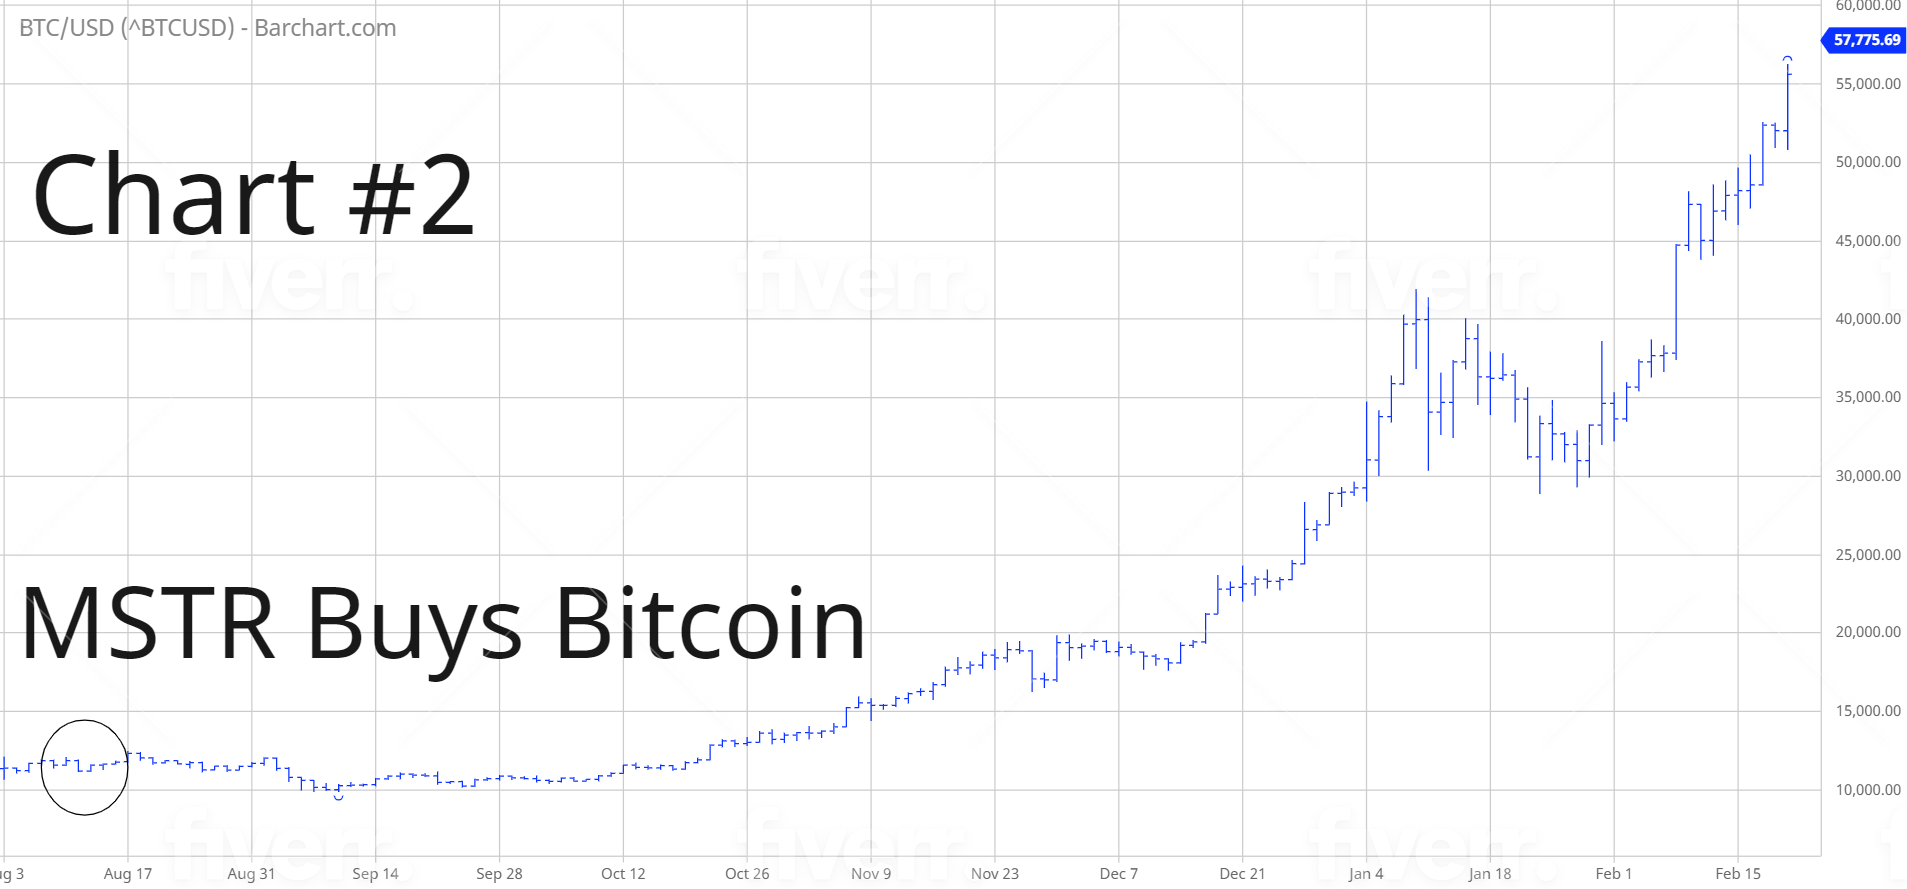
Fifty years from now, when financial scholars attempt to place Bitcoin (BTC) in its proper historical context, they will most likely reference 2020-2021 as a critical turning point in Bitcoin’s journey to becoming a major asset class within the global financial community. Beginning in August 2020, a steady stream of publicly traded corporations began investing a portion of their corporate balance sheets in BTC. Specifically, on 11 August 2020, MicroStrategy (MSTR) became the first company to add the cryptocurrency to its balance sheet by purchasing 21,454 BTC. Going forward, this transaction by MSTR will be regarded as a seminal event in the history of Bitcoin. MSTR opened the floodgates for other corporations to hold BTC on their balance sheets.
By examining the charts of MSTR and Bitcoin (Chart #1 – Chart #2), it’s quite evident that the global investment community was waiting for this type of transaction to occur. Why? Because it finally placed BTC in the same league as stocks, bonds and commodities. Additionally, it validated Bitcoin as a legitimate store of value. Also, the MSTR purchase provided cover for insurance companies, endowments, state governments and investment advisors to own Bitcoin and other cryptocurrencies. What’s next for BTC? Where do we go from here? More importantly, how long will this current bull market continue? Let’s discuss the details.
During the past several thousand years, civilizations have used various items to represent money.
Please review the following table:
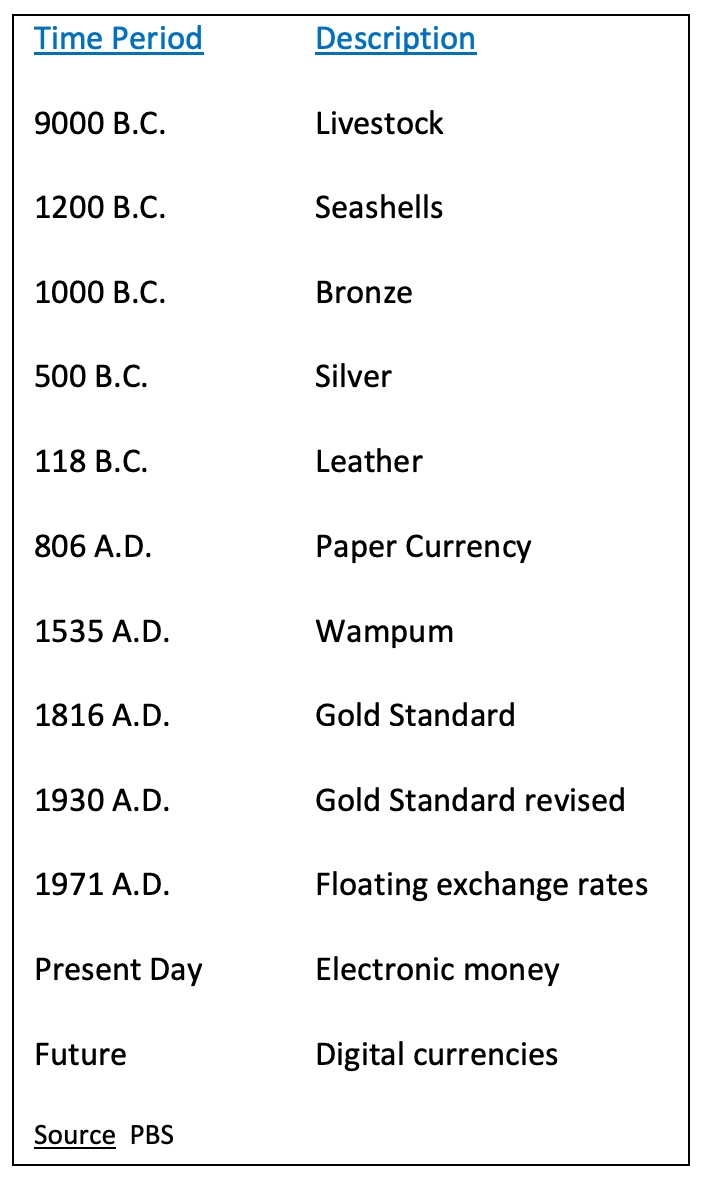
As you can see from the list, money has taken many different forms over the years. Despite the differences in the material format, they all possess the same features, functions and characteristics.
The features of money include:
- Store of value
- Unit of account
- Medium of exchange
- Standard of payment
The functions of money include:
- Durability
- Divisibility
- Transportability
- Uniformity
- Acceptability
- Limited supply
- Unable to be counterfeited
In order to be used and accepted as a form of money, it must contain the features and functions described above. When Bitcoin was launched in January 2009, it was initially viewed as a medium of exchange and standard of payment. When Satoshi Nakamoto released the Bitcoin white paper in October 2008, she/he originally described BTC as a payment mechanism designed to replace fiat currency. Therefore, the main function of Bitcoin (at least initially) was to pay for basic goods and services. In fact, during Bitcoin’s first retail-driven bull market in 2016-2017, the main narrative of the rally focused on BTC eventually replacing Visa and Mastercard as a global payment processor. However, merchants soon discovered that Bitcoin was incredibly slow at converting payments between the customer and the merchant.
In 2019, Visa and Mastercard processed a staggering 802.7 million transactions per day. This means that global consumers swipe their plastic cards 557,400 times every 60 seconds. How do these numbers compare to Bitcoin? Compared to Visa and Mastercard, BTC is light years behind. The length of time to process a single transaction is ten minutes. Obviously, Bitcoin will never be able to compete with the major credit card companies unless transaction speed is exponentially improved.
Many crypto experts agree that Bitcoin’s inability to compete against Visa and Mastercard as a payment processor, was the driving force behind its price collapse in late-2017. From its inception in 2009, Bitcoin was hyped as a decentralized payment network designed to replace credit card companies and other money transmission services. However, this narrative simply didn’t work and eventually the parabolic move collapsed in December 2017.
Following the massive price decline, the BTC community began to develop a new narrative for the cryptocurrency. Their objective was to separate Bitcoin from the Federal Reserve’s unlimited money printing of the US Dollar. In 2018, global central banks were in the middle of the greatest fiat monetary expansion of all-time. Central banks around the world were pursuing an aggressive interest rate policy of 0% in an effort to stimulate their respective economies. Why were central banks attempting to create economic activity? Because they were still trying to return global GDP to its growth rate prior to the 2008 financial crisis. Consequently, this pro-growth agenda forced central banks to create massive amounts of fiat currency units. Of course, this aggressive money printing agenda was a perfect backdrop for the BTC community as it rolled out its new narrative.
What was the new Bitcoin narrative? As we discussed, the objective within the community was to separate BTC from the Federal Reserve’s unlimited money printing of the US Dollar. Bitcoin offered a perfect alternative to the central bank’s debasement of the Dollar. When Satoshi Nakamoto released the Bitcoin white paper in October 2008, readers soon discovered that Nakamoto had placed a strict limit on the number of BTC in circulation. The total supply was limited to 21 million. Obviously, the limited supply of BTC is in stark contrast to the unlimited supply of fiat money. The Bitcoin community utilized this to their advantage by promoting BTC as a store of value.
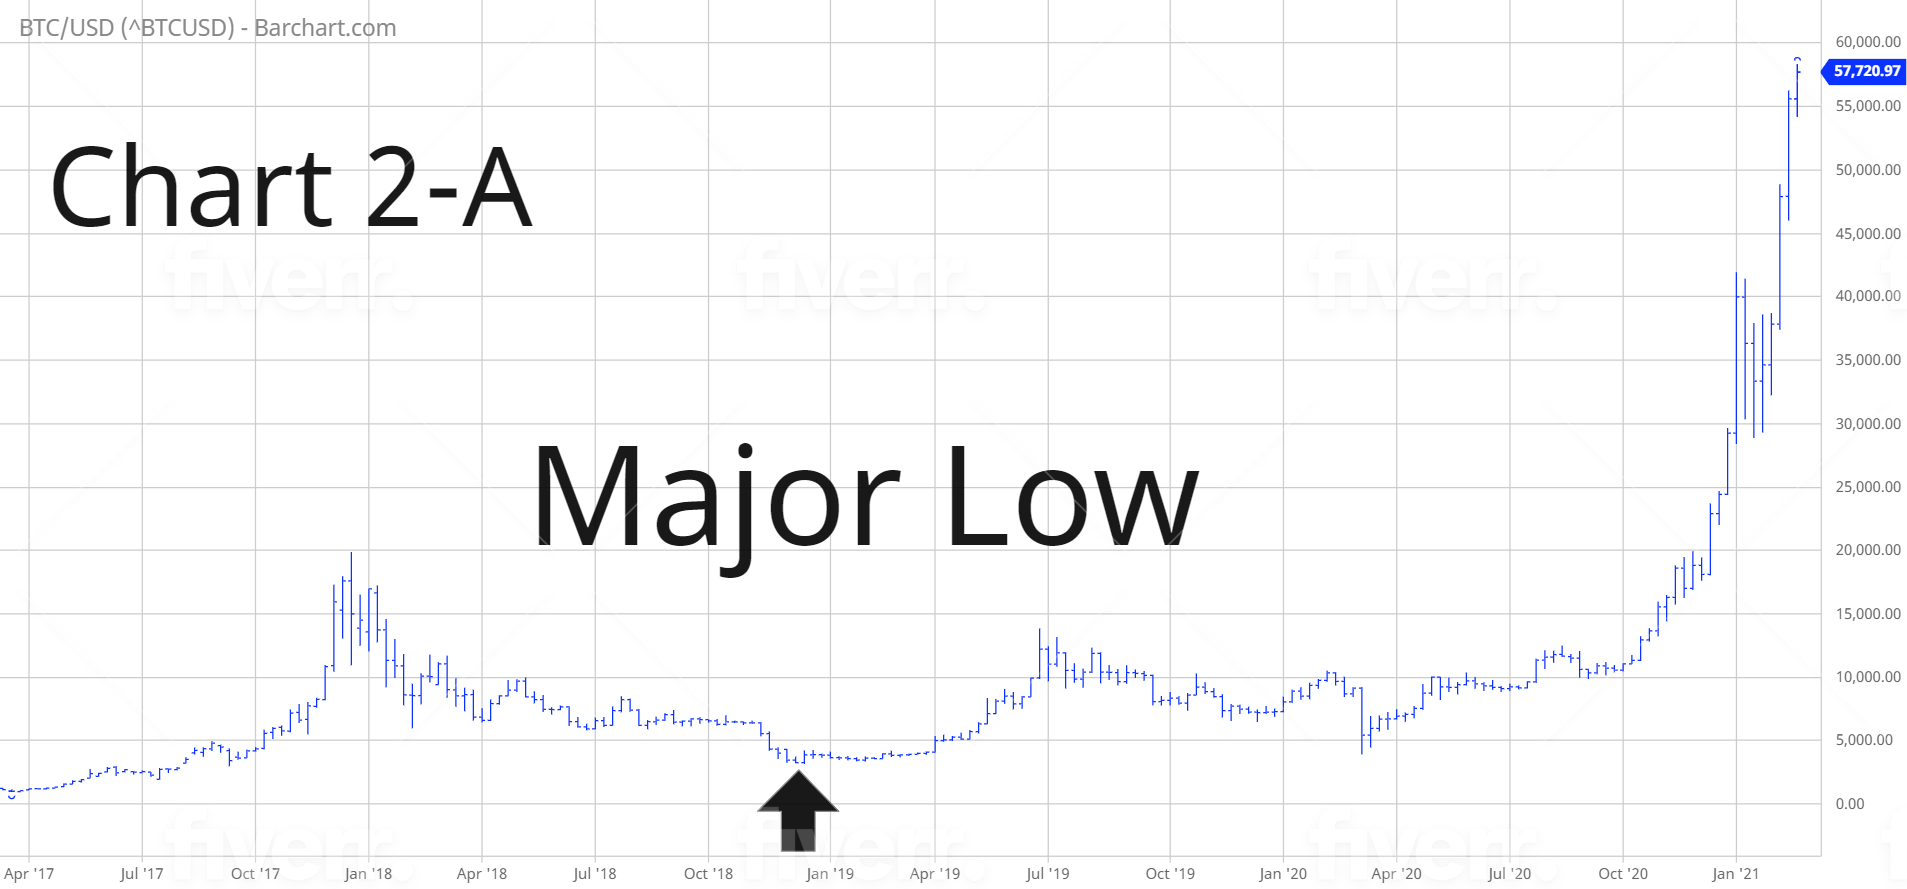
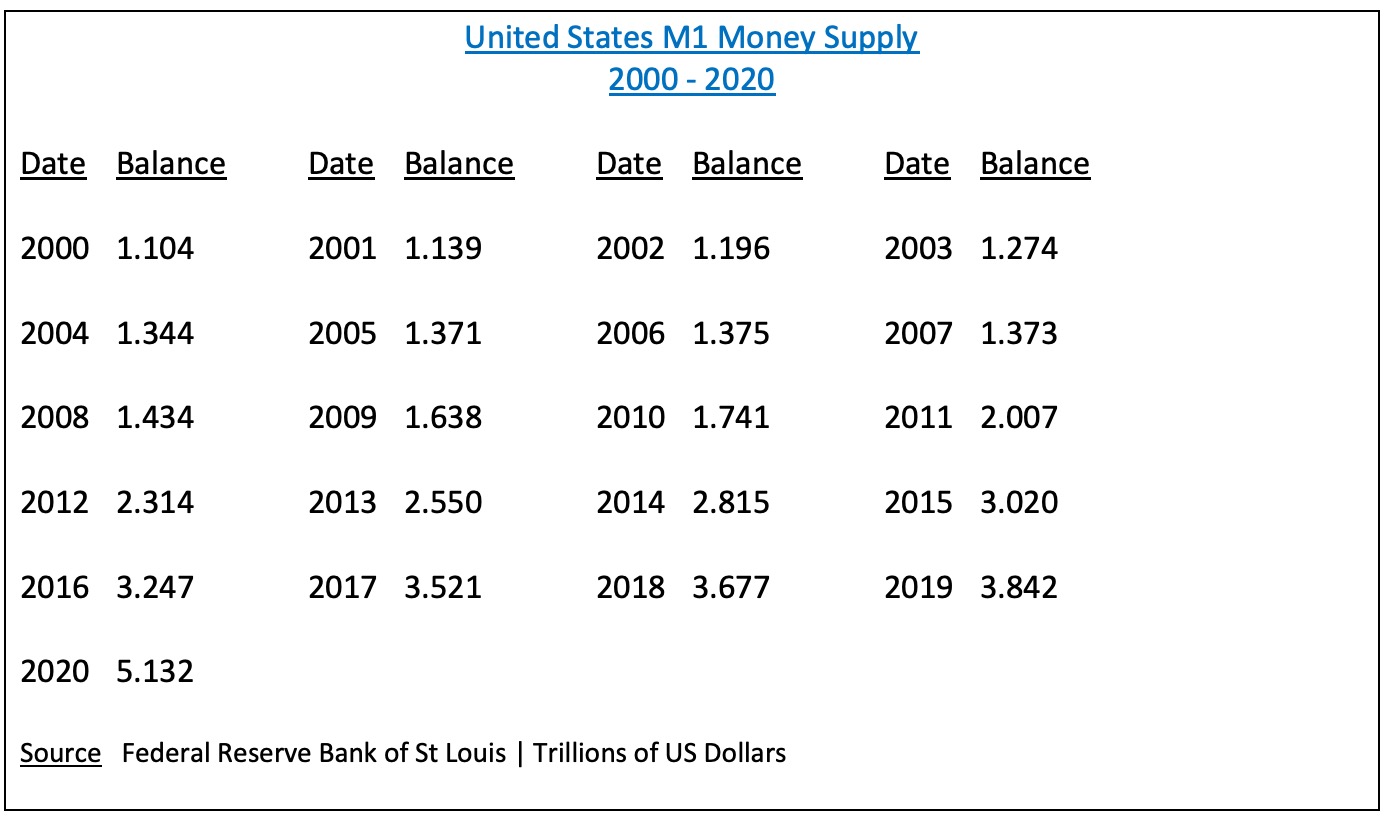
The idea of advocating Bitcoin as a store of value turned out to be “grand slam” for the entire crypto ecosystem. By 2018, investors were desperately searching for an alternative asset to be used as a hedge against the Fed’s attempt to debase the US Dollar. As you can see from the attached table, the Federal Reserve embarked on an unprecedented campaign of monetary expansion beginning in 2008. Over the course next decade (2008 – 2017), the M1 money supply exploded by 145.5%. It’s certainly no coincidence that the price of BTC formed an important bottom in 2018, following the speculative blow-off top in late-2017 (Chart #2-A). Most crypto experts agree that Bitcoin has finally found its “niche” as a store of value.
United States M1 Money Supply
In an effort to provide investors with exposure to Bitcoin, Grayscale Investments LLC introduced the Bitcoin Investment Trust. This Grayscale product is not an exchange traded fund (ETF). Instead, the trust is considered a private investment vehicle, not registered with the Securities and Exchange Commission (SEC) under the Investment Company Act of 1940. Despite its unique registration status, shares of the Bitcoin Investment Trust are freely traded on the OTC market. The product was launched on 4 May 2015, using the ticker symbol GBTC. The first trade occurred @ .4615 per share (less than 50 cents per share). GBTC has become incredibly popular during the past few years. It’s not uncommon for daily volume to exceed 15 million shares.
LONG-TERM VIEW
Even though BTC has only been in existence for 12 years, it has carved out a fairly predictable price pattern. The pattern is derived from an event that occurs in Bitcoin approximately once every four years. This event is known as a “halving.” Without going into great detail, a halving reduces Bitcoin mining rewards by 50%. Essentially, this event dramatically reduces the number of BTC entered into circulation. Consequently, it generates a substantial Bitcoin rally for approximately 18 months following the halving date.
Please review the list of halving dates:
- 9 January 2009
- 28 November 2012
- 9 July 2016
- 11 May 2020
- 13 May 2024
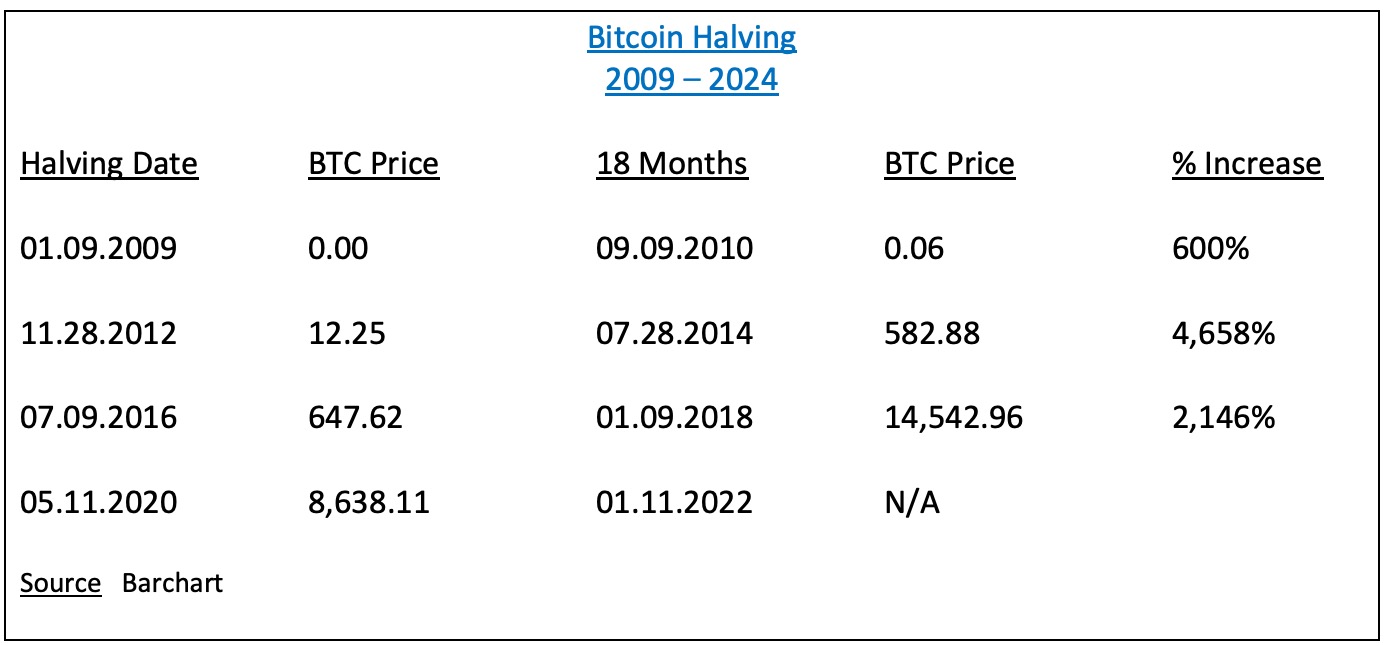
As you can see from the table, the most recent halving date occurred on 11 May 2020. The average price advance following the halving is 2,468%. Based on this information, we can expect the price of Bitcoin to approach $213,188 by 11 January 2022. However, the sample size is very small. Until there is a much larger sample size, we can’t place too much confidence in these price forecasts.
During the past few years, many financial experts have predicted that Bitcoin will eventually replace gold as the preferred choice among investors as the ultimate store of value. For the past 4,000 years, gold has served as an incredibly reliable store of value. It has held its purchasing power extremely well during the past 50 years. Please review the following table.
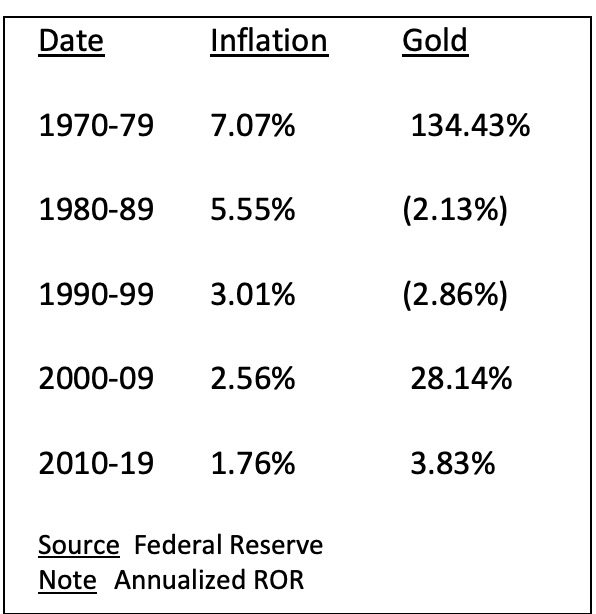
| Since 1970, the average annual rate of inflation has been 3.99%. During the same period of time, the average annual rate of return for gold has been 32.28%. Gold has substantially outperformed inflation over the course of the past 50 years. More importantly, Bitcoin has easily outperformed gold since its inception in 2009. Therefore, going forward, BTC will eventually replace gold as the ultimate store of value and inflation hedge. |
What is the long-term value of Bitcoin? That’s a very difficult question to answer. However, let’s assume that BTC eventually replaces gold as the preferred choice among investors as a hedge against inflation. The current market capitalization of gold is approximately $10 trillion. The current market capitalization of Bitcoin is approximately $1 trillion. Therefore, the price of BTC must increase 10x from its current price of $55K. Based on this scenario, the “true value” of Bitcoin is probably $550,000 per BTC.
In regard to GBTC, the long-term trend is extremely bullish. GBTC recorded a new all-time high on 19 February. The next level of resistance is 76.62. In order to reverse the momentum, the bears need a weekly close below 9.25. This type of price collapse is next to impossible based on the amount of money that is currently flowing into GBTC.
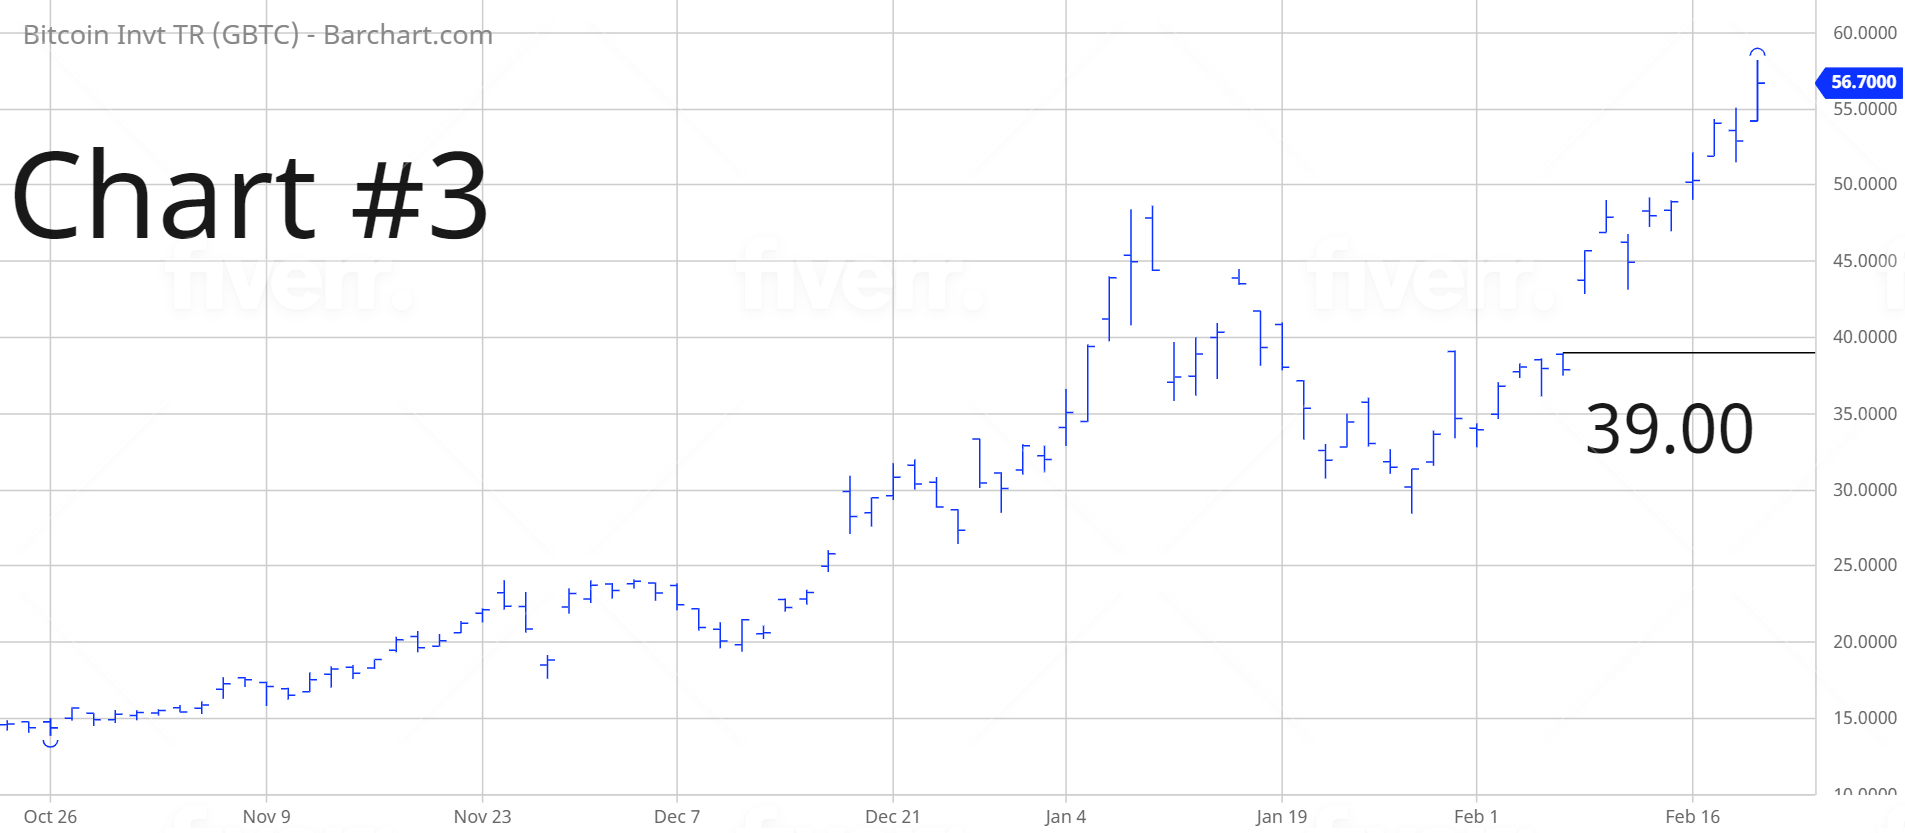
SHORT-TERM TREND – GBTC
Please review the 4-month chart of GBTC (Chart #3). Essentially, this investment vehicle has been rising parabolically for the past eight weeks. The short-term trend is clearly in favor of the bulls. The next resistance level is 58.22. A weekly close below 39.00 is needed in order to flip the chart pattern in favor of the bears. Possible but not likely.
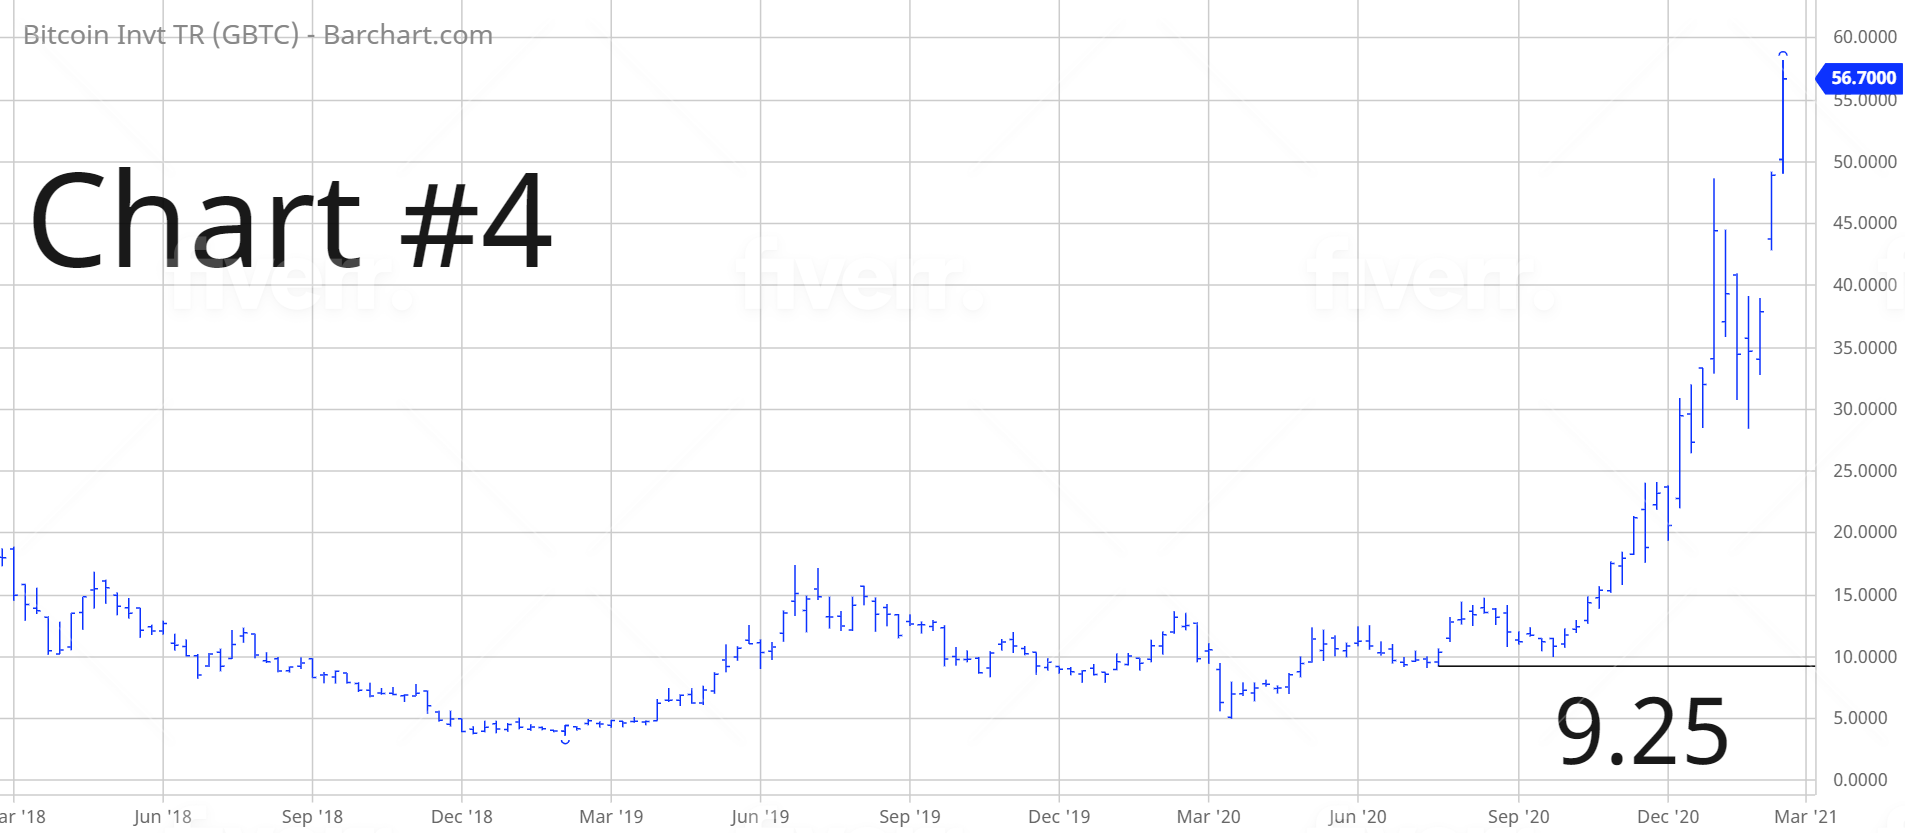
LONG-TERM TREND
Please review the 3-year chart of GBTC (Chart #4). An argument could be made that GBTC has been in a secular bull market since the first trade was initiated on 4 May 2015. Despite the brutal decline in Q1 2019 and Q1 2020, GBTC never penetrated the lows from 2015. Therefore, the chart pattern continues to remain bullish. The next level of resistance is 76.62. The bears need a weekly close below 9.25 in order to capture the momentum. This type of decline is extremely remote. Bitcoin must drop below $9,100 to push GBTC into a long-term bear market. Of course, anything is possible.