SPDR Dow Jones Industrial Average ETF (DIA)
Key Statistics
Thank you for reading this post, don't forget to subscribe!
Minor Support Level 289.19 Minor Resistance Level 342.43
Major Support Level 112.14 Major Resistance Level 353.34
Minor Buy Signal 347.58 Minor Sell Signal 284.96
Major Buy Signal 364.24 Major Sell Signal 101.33
BRIEF OVERVIEW – DIA
Arguably, the most common universally accepted belief on Wall Street is that rising interest rates are bearish for the stock market. The overwhelming majority of money managers, professional economists, financial journalists and educators cling to the narrative that stocks will decline in the face of higher interest rates. This widely held assumption has existed for the better part of the past century. However, it really began to gather momentum beginning in January 1973, when Federal Reserve Chairman, Arthur Burns was forced to substantially raise interest rates in an effort to prevent rising levels of inflation. Thanks to the OPEC oil embargo in August of the same year, the United States quickly found itself in a full blown crisis of rising interest rates, high levels of inflation, soaring energy prices, economic contraction and a declining stock market. The inflation of the early-1970s quickly morphed into a nasty bout of stagflation, which continued for the better part of the next decade.
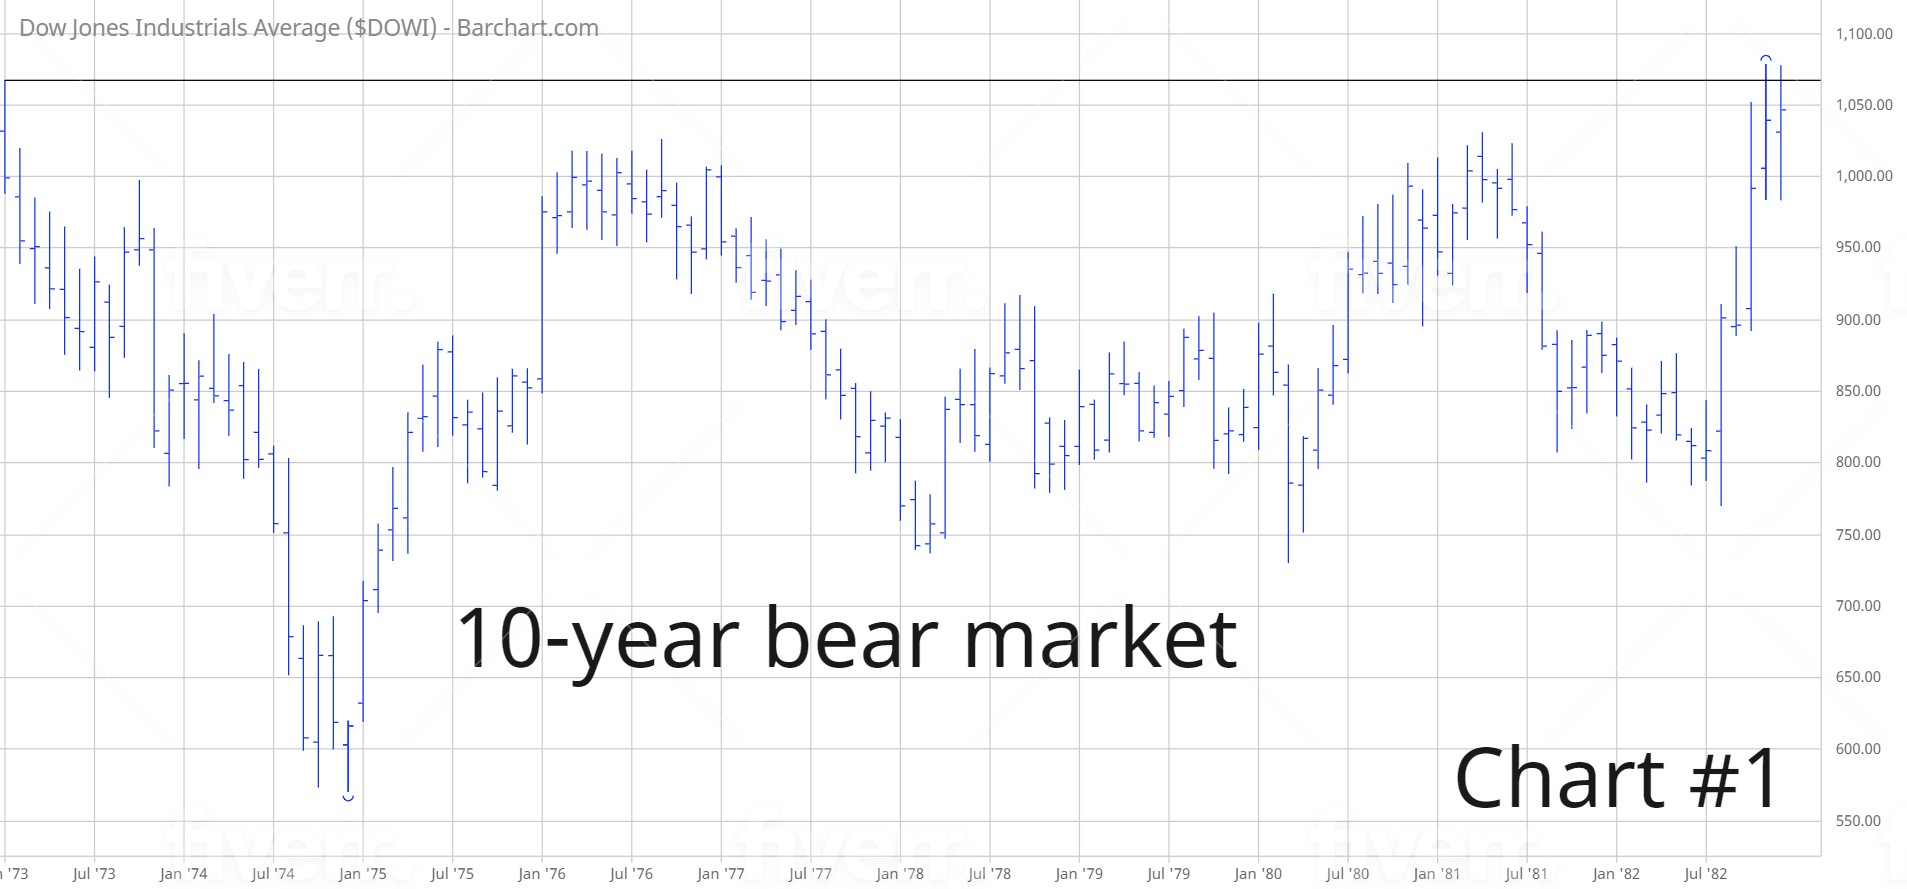
Please review Chart #1, which displays ten years of stock market performance from 1973 through 1983, based on the Dow Jones Industrial Average. As you can see from the chart, DJIA was trading @ 1,062 in January 1973. The market traded sideways-to-lower for the next nine years. Finally, in November 1982, DJIA penetrated the old high from 1973. For the vast majority of this period, interest rates were rising. This explains why most investors believe rising interest rates are bearish for the stock market.
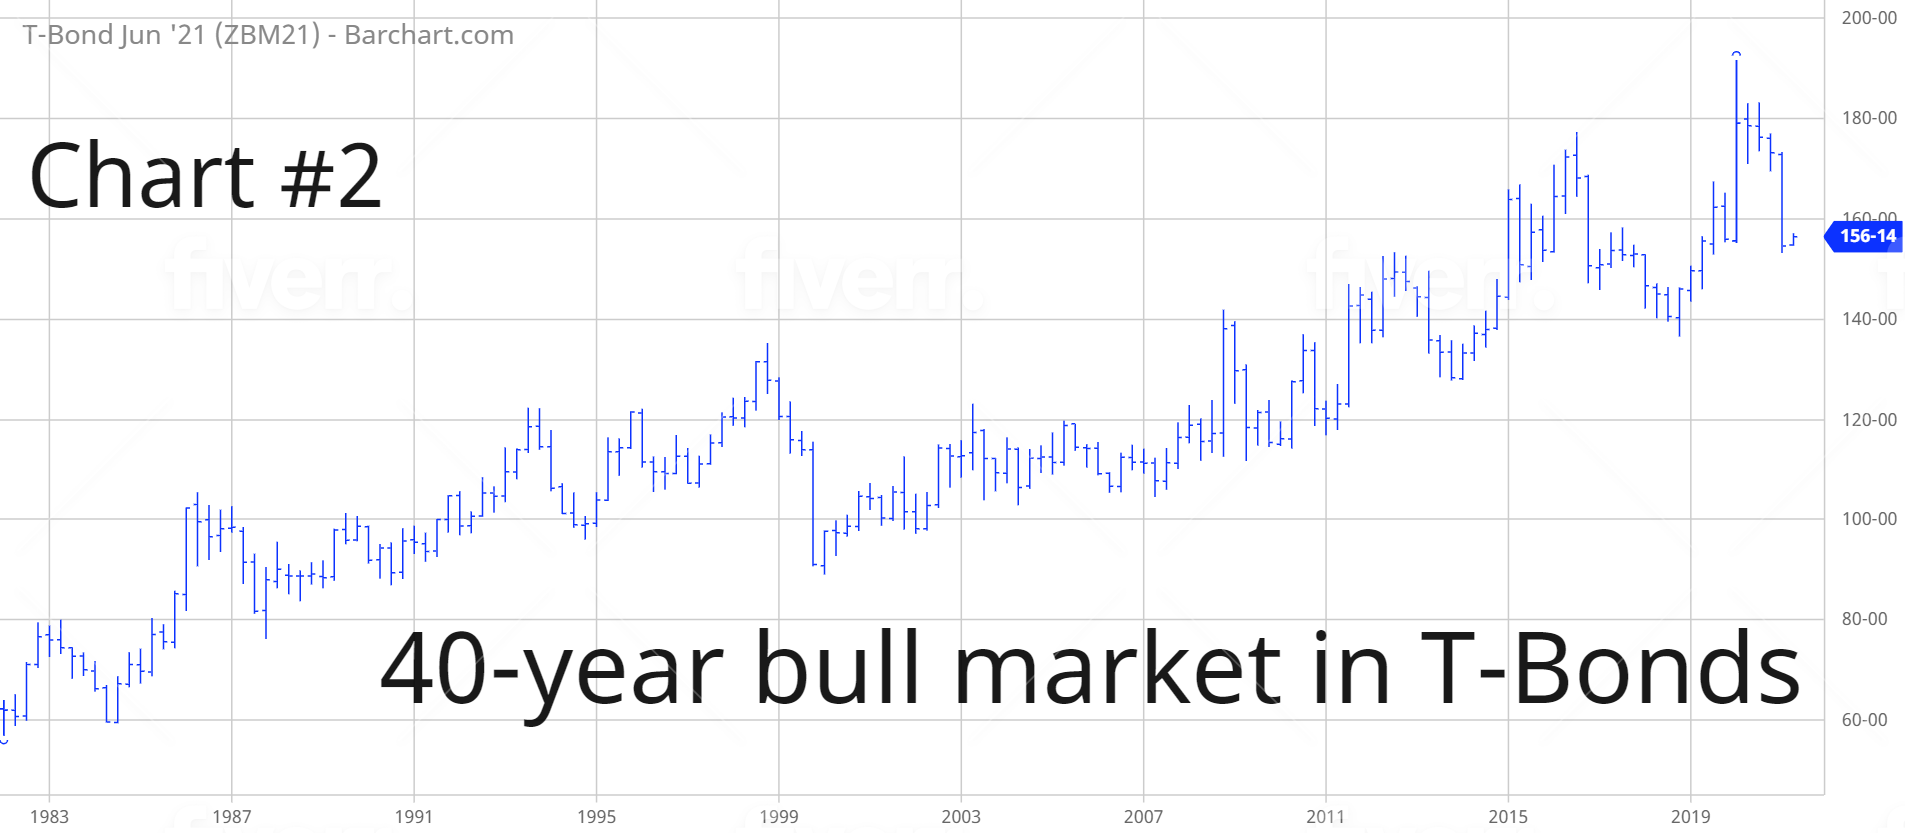
Since 1982, rising interest rates have been practically non-existent. The United States has found itself in a declining interest rate environment for the past four decades. Therefore, the interest rate narrative has rarely been tested since 1982. Please review Chart #2. As you can see from the chart, bond prices have been rising for the past 40 years. Please note: There is an inverse relationship between bond prices and interest rates. As bond prices rise, interest rates decline.
Are rising interest rates bearish for the stock market? As we discussed, most investment professionals believe that stock prices will decline if interest rates move higher. In order to discover the truth, let’s examine the data. The numbers never lie.
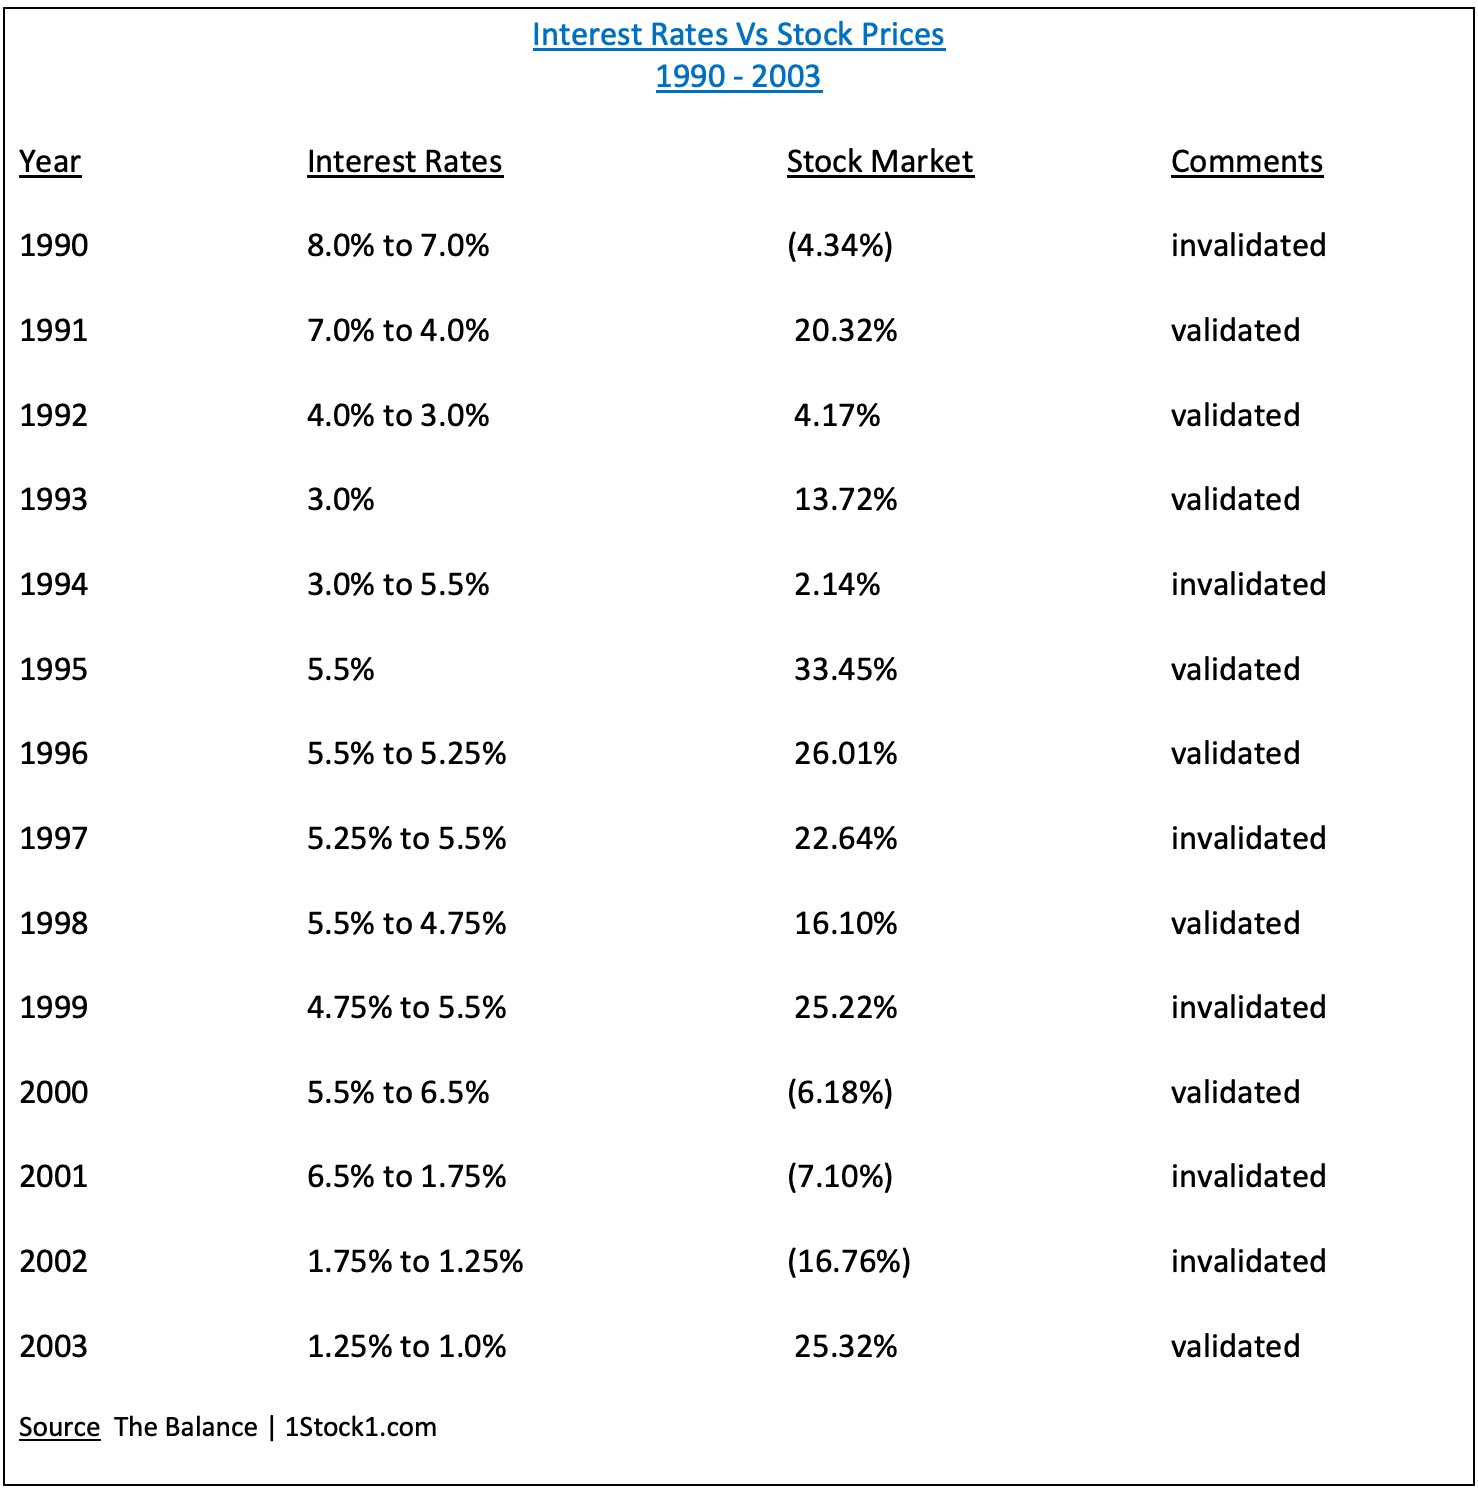
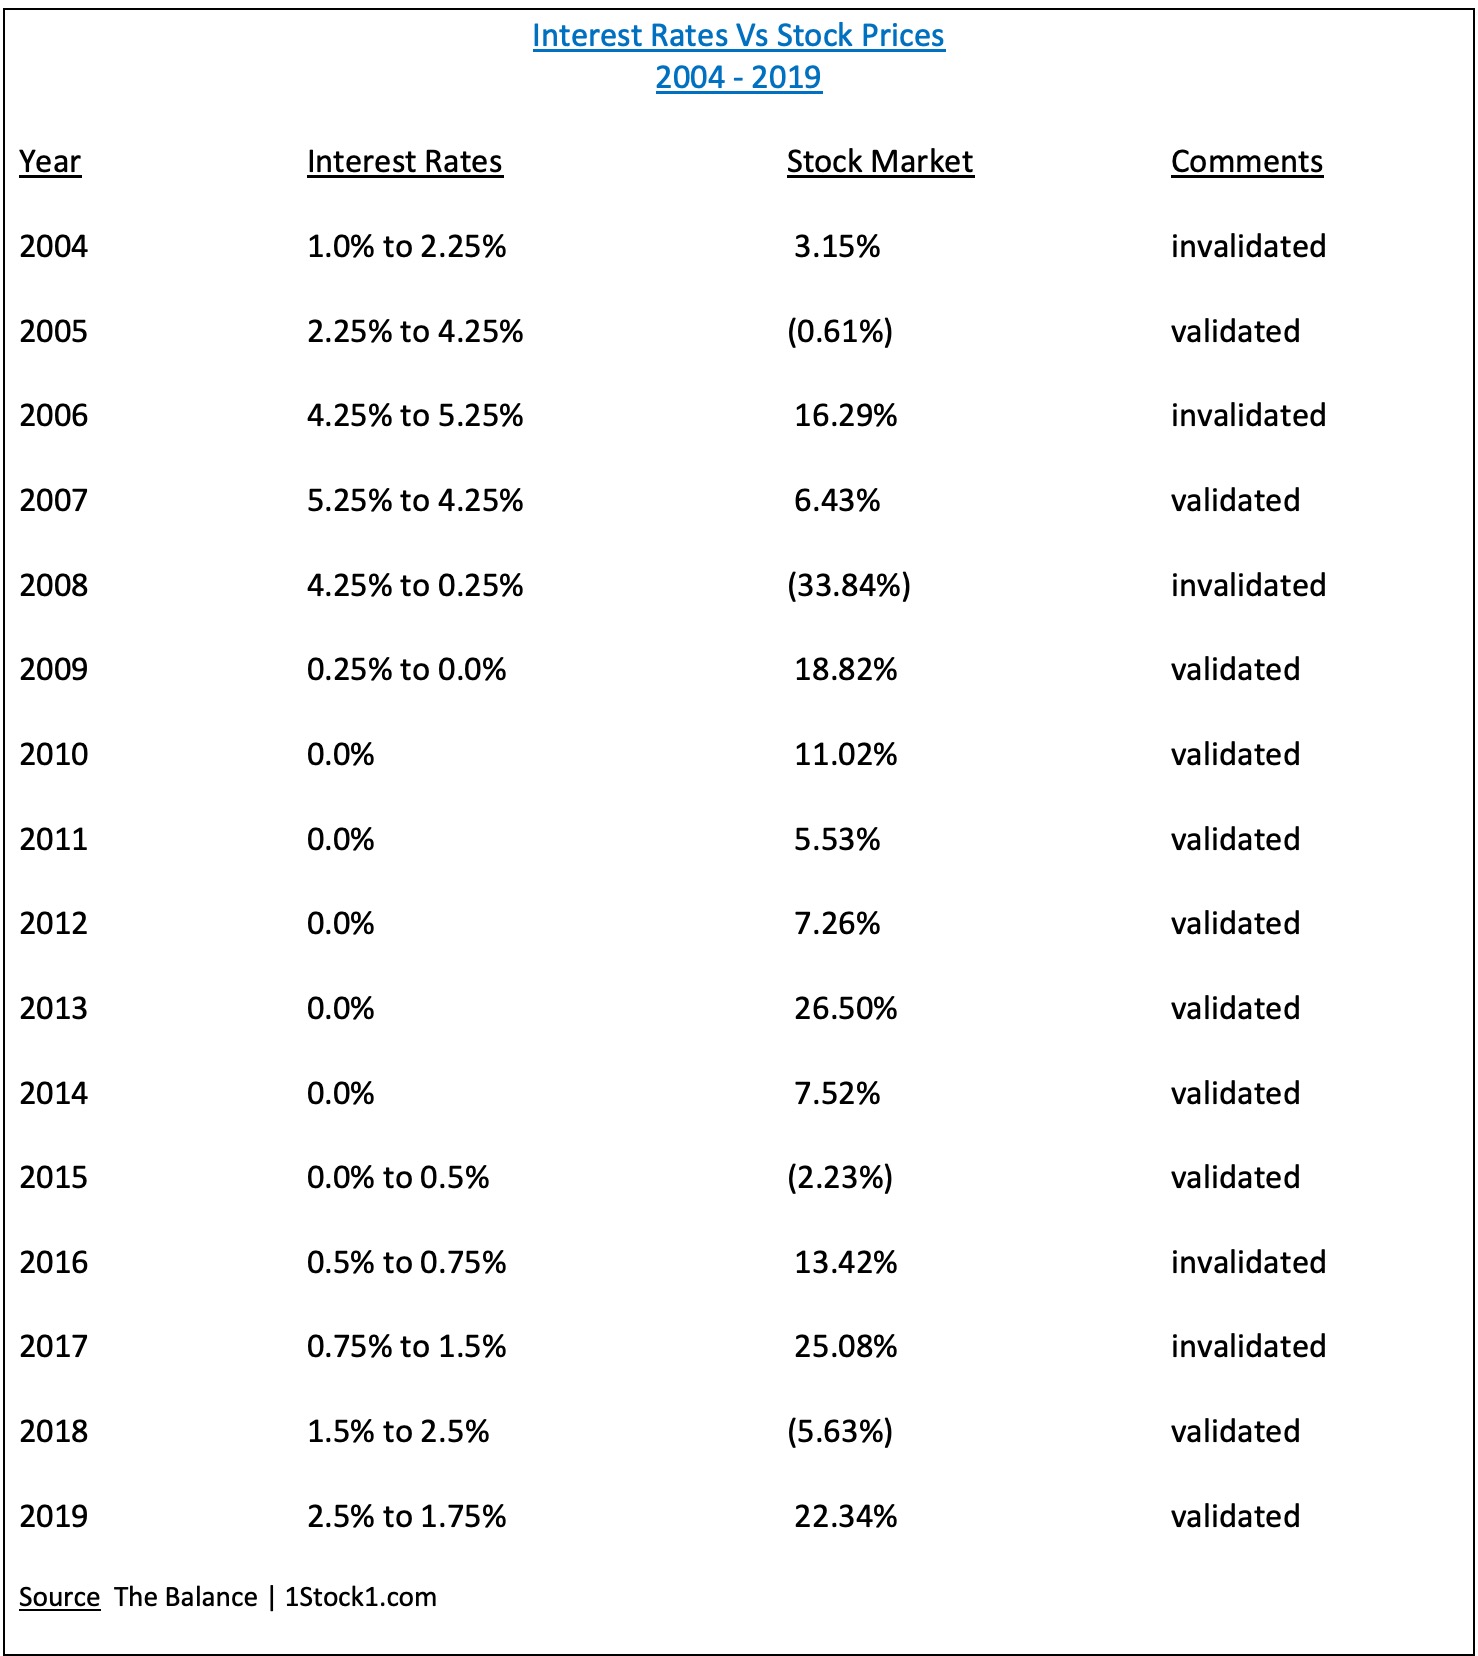
The above tables contain 30 years of data. Are rising interest rates bearish for the stock market? Based on the past 30 years, the answer is “Yes.” Generally speaking, stock prices decline when interest rates are rising. Conversely, stocks rise when interest rates are falling. You will notice in the “comments” section that the data were either validated or invalidated based on the results for each year. During the past 30 years, the interest rate – stock market relationship was validated 19 out of 30 times, or 63% of the time. Of course, this means that the relationship between interest rates and the stock market was invalidated 37% of the time.
We can conclude that there is a correlation between interest rates and the stock market. However, the correlation is not as powerful as many investors believe. Although the relationship may not be as strong as previously assumed, stock market investors should definitely pay attention to the direction of interest rates.
The SPDR family of exchange traded funds (managed by State Street Global Advisors) introduced the Dow Jones Industrial Average ETF on 14 January 1998. The ticker symbol is DIA. This ETF is a perfect vehicle for investors who wish to participate in the performance of DJIA. DIA is an extremely popular ETF, with an average daily volume of nearly six million shares. The ETF is commonly referred to as “Diamonds.”
SHORT-TERM VIEW – DIA
The short-term view of DIA remains incredibly bullish. The next level of resistance is 342.43. In order to recapture the momentum, the bears need a weekly close below 289.19. The most likely scenario is a continuation of higher prices.
LONG-TERM VIEW – DIA
Despite the fact that historical results clearly validate the relationship between interest rates and stock prices, there are still many skeptics who point to the fact that stocks and bonds were in a roaring bull market during the past three decades. Therefore, the results do not accurately portray the correlation between interest rates and stocks. The skeptics do have a valid argument. Without question, the past 30 years have certainly been quite bullish for both of these major asset classes.
In an effort to validate the results from 1990 through 2020, let’s review the data from a time period in our nation’s history when inflation was rising and bonds were in a bear market. Specifically, we will examine the time period from 1955 to 1969, which encapsulated the post-World War II economic recovery. In terms of economic growth, this was a very prosperous time in our nation’s history which was highlighted by the dramatic expansion of suburban development. Against this economic backdrop, let’s examine the relationship between interest rates and stock prices. Please review the following table.
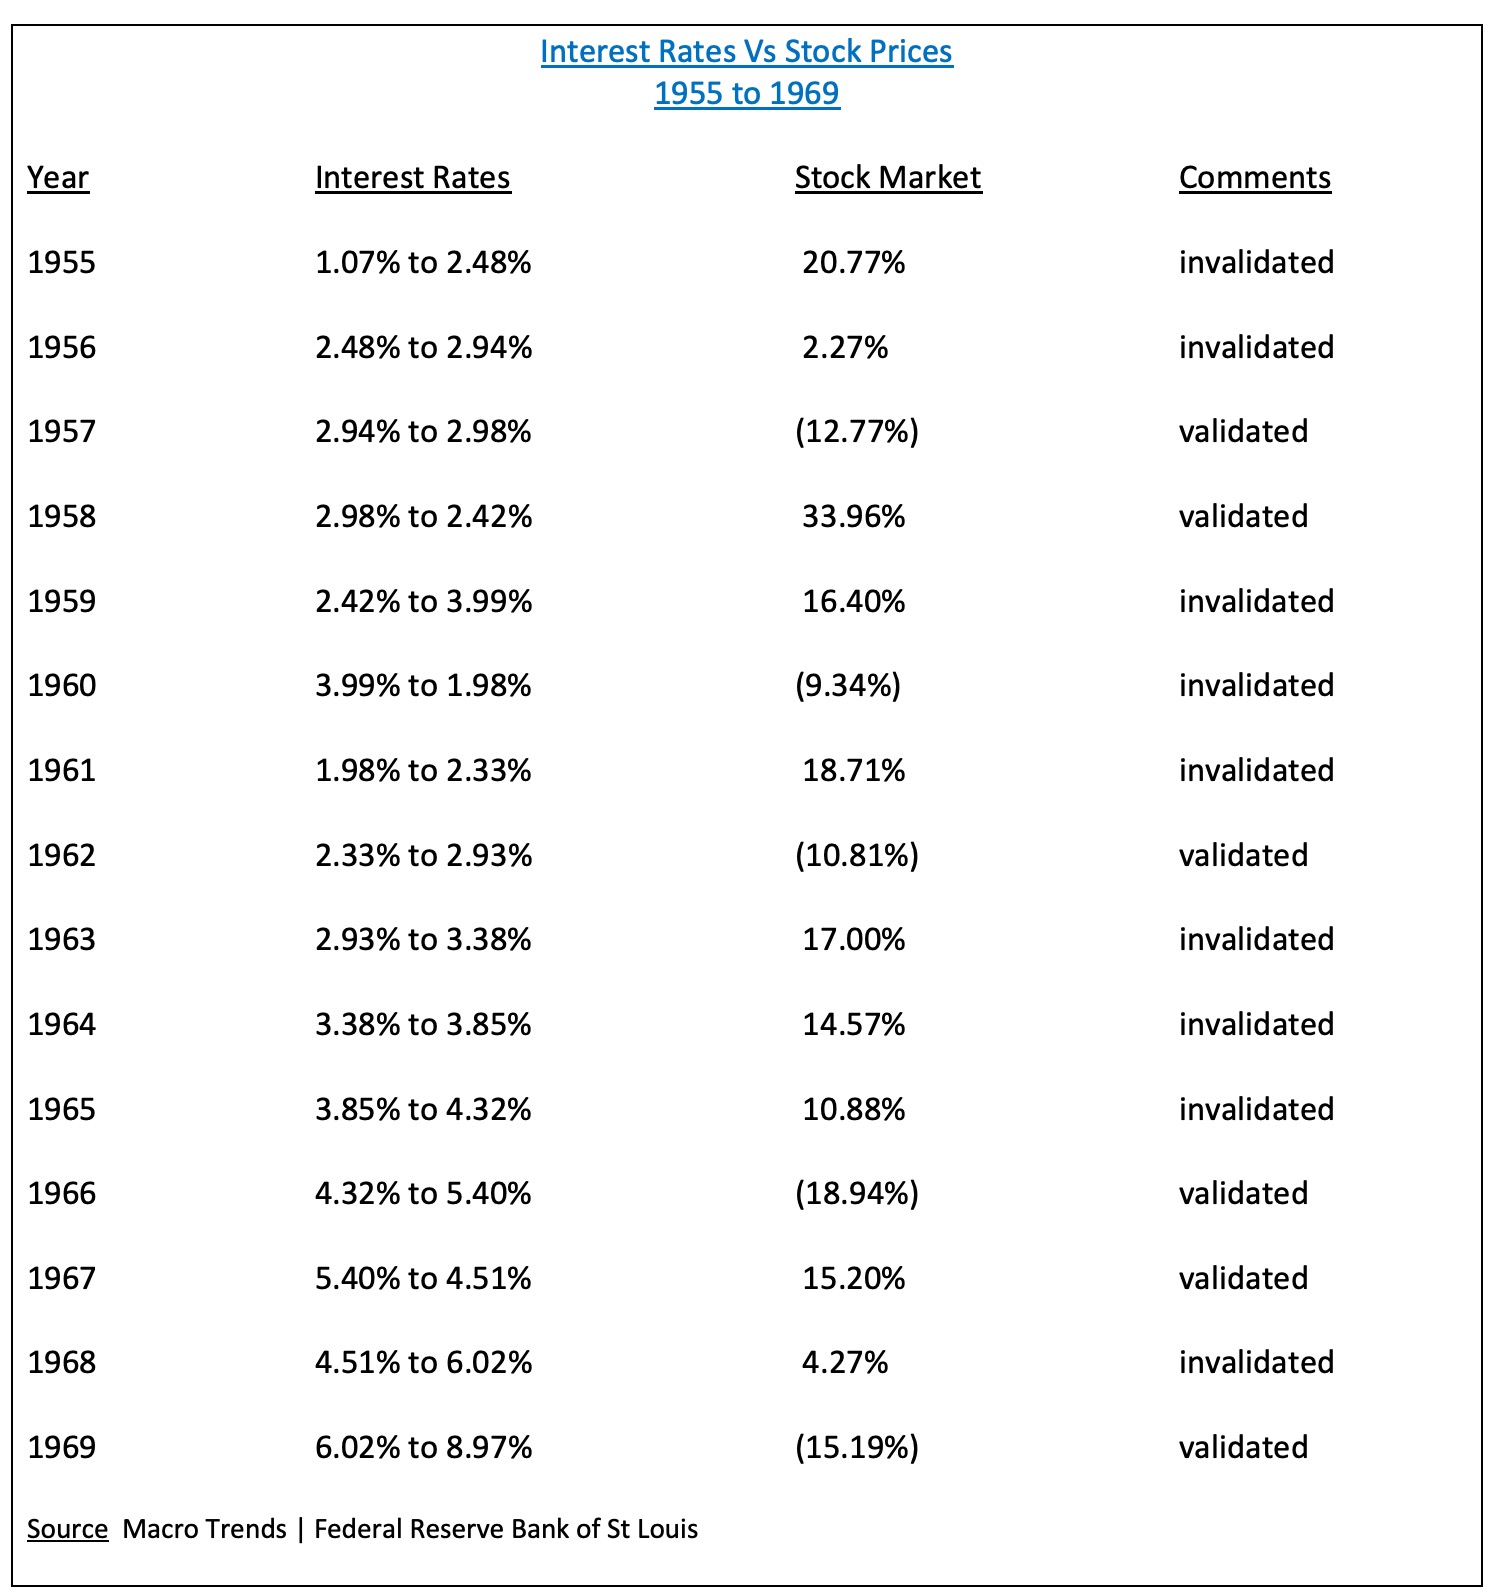
As you can see from the table, the relationship between interest rates and the stock market begins to unravel. From 1955 to 1969, the interest rate – stock market relationship was validated only 40% of the time, or 6 out of 15 times. During this particular time period, we can conclude that the correlation between rising interest rates and declining stock prices is weak, at best. Sixty percent of the time, the interaction between rates and equities completely fell apart.
What can we learn from this time period concerning interest rates and stock prices? We can conclude that there is no highly correlated relationship between these two asset classes. The relationship only exists when certain economic conditions are present. For example, from 1955 to 1969, interest rates increased substantially. Therefore, based on the perceived relationship between interest rates and stock prices, we should expect a bear market during this time period. However, stocks enjoyed a roaring bull market between 1955 and 1969.
What happened? Why did the correlation between interest rates and equity prices fall apart from 1955 to 1969? Because interest rates were rising in response to a massive economic boom following World War II. As we previously discussed, suburban living first began to appear in the US during this time period. Consequently, this created a perfect environment increased economic activity. As the economy continued to grow, corporate profits exploded along with stock prices. Wall Street was not the least bit concerned about rising interest rates during this period of time. Instead, they were more focused on economic expansion and increased business activity.
Based on the data that we analyzed, is there any type of predictable relationship between interest rates and the stock market? The short answer is, “Yes.” However, other factors must be taken into consideration. The most important factor involves determining the catalyst for rising interest rates. If rates are rising because of a booming economy, the correlation between interest rates and stock prices basically disappears. However, if interest rates are rising because of inflationary pressures (e.g. 1973 – 1982), there is a very strong relationship between rates and equities.
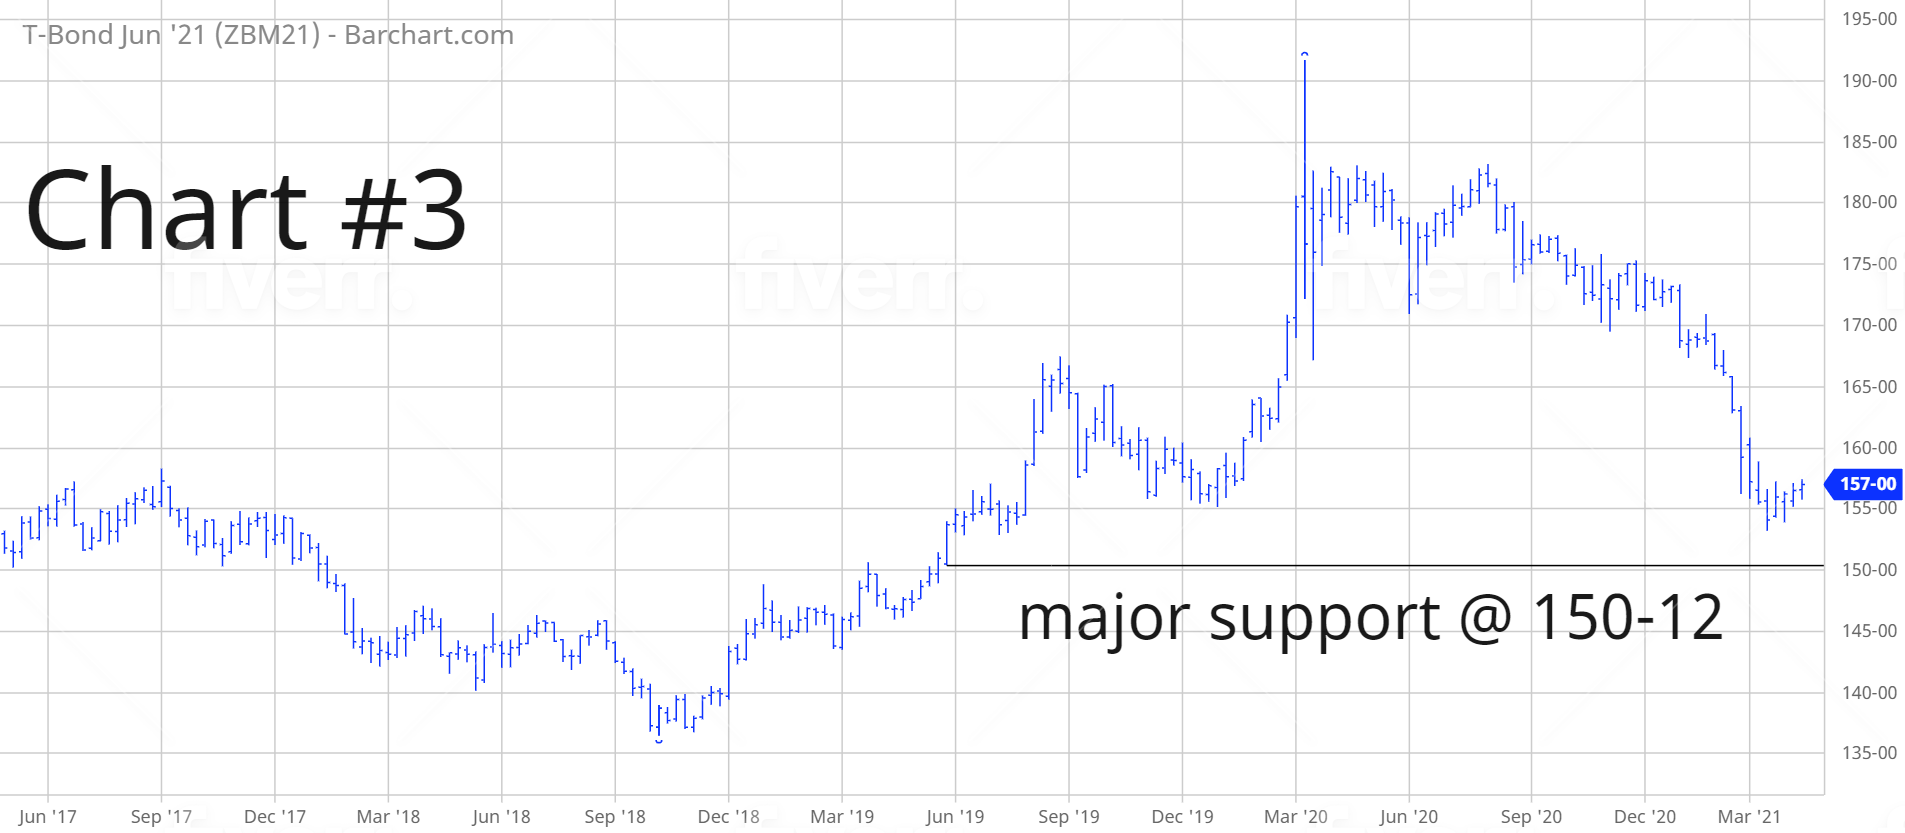
Going forward, can we expect interest rates to influence stock prices throughout the remainder of this decade? It certainly appears as though inflation could become a major problem during the next several years. Therefore, a very strong likelihood exists that stocks could struggle in the 2020s if inflation heats up. Many investment analysts are watching T-Bonds for a clue that inflation could force interest rates to rise. The critical level is 150-12 basis 30-year T-Bonds (Chart #3). There is a very strong probability that interest rates and stock prices will rekindle their relationship in precisely the same manner that we experienced between 1973 and 1982.
In regard to DIA, the long-term view remains extremely bullish. The next resistance level is 353.34. A weekly close below 112.14 is needed in order to reverse the momentum. It’s highly unlikely that the long-term momentum will turn bearish any time in the near future. However, if global central banks begin to lose control of their money printing apparatus, the bull market could begin to unravel very quickly.
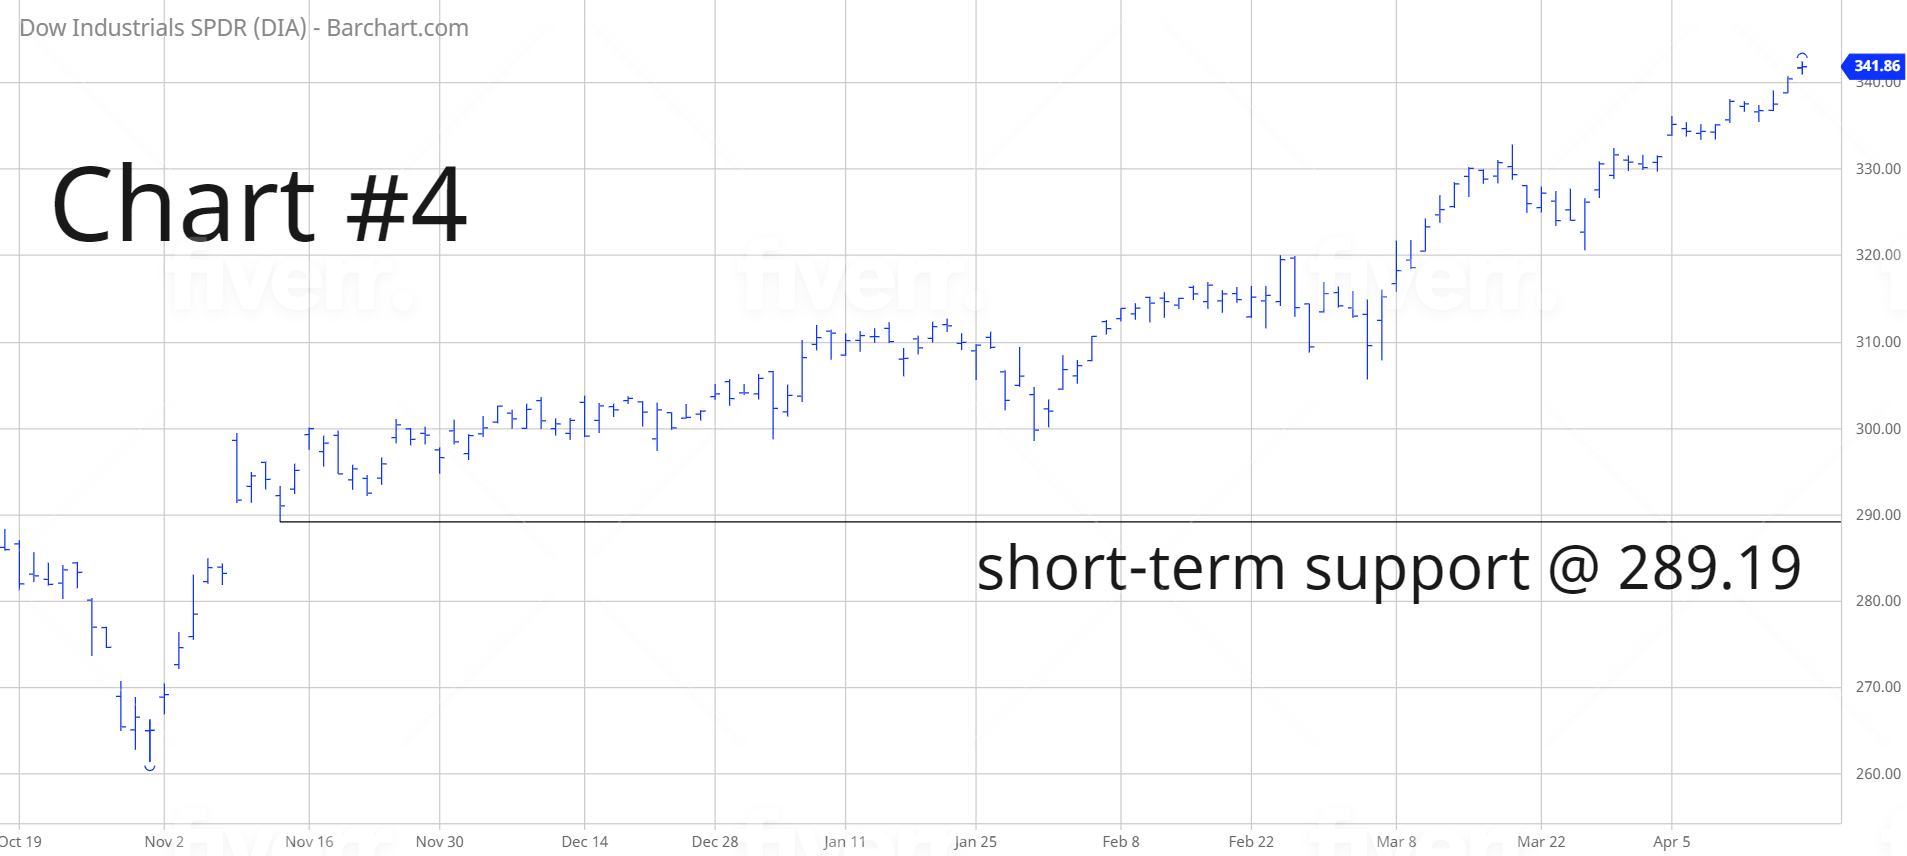
SHORT-TERM TREND
Please review the 6-month chart of DIA (Chart #4). DIA remains in bullish territory on a short-term basis. The next level of resistance is 342.43. The chart pattern will remain bullish as long as DIA stays above 289.19 on a weekly closing basis. The most likely scenario is a continuation of higher prices.
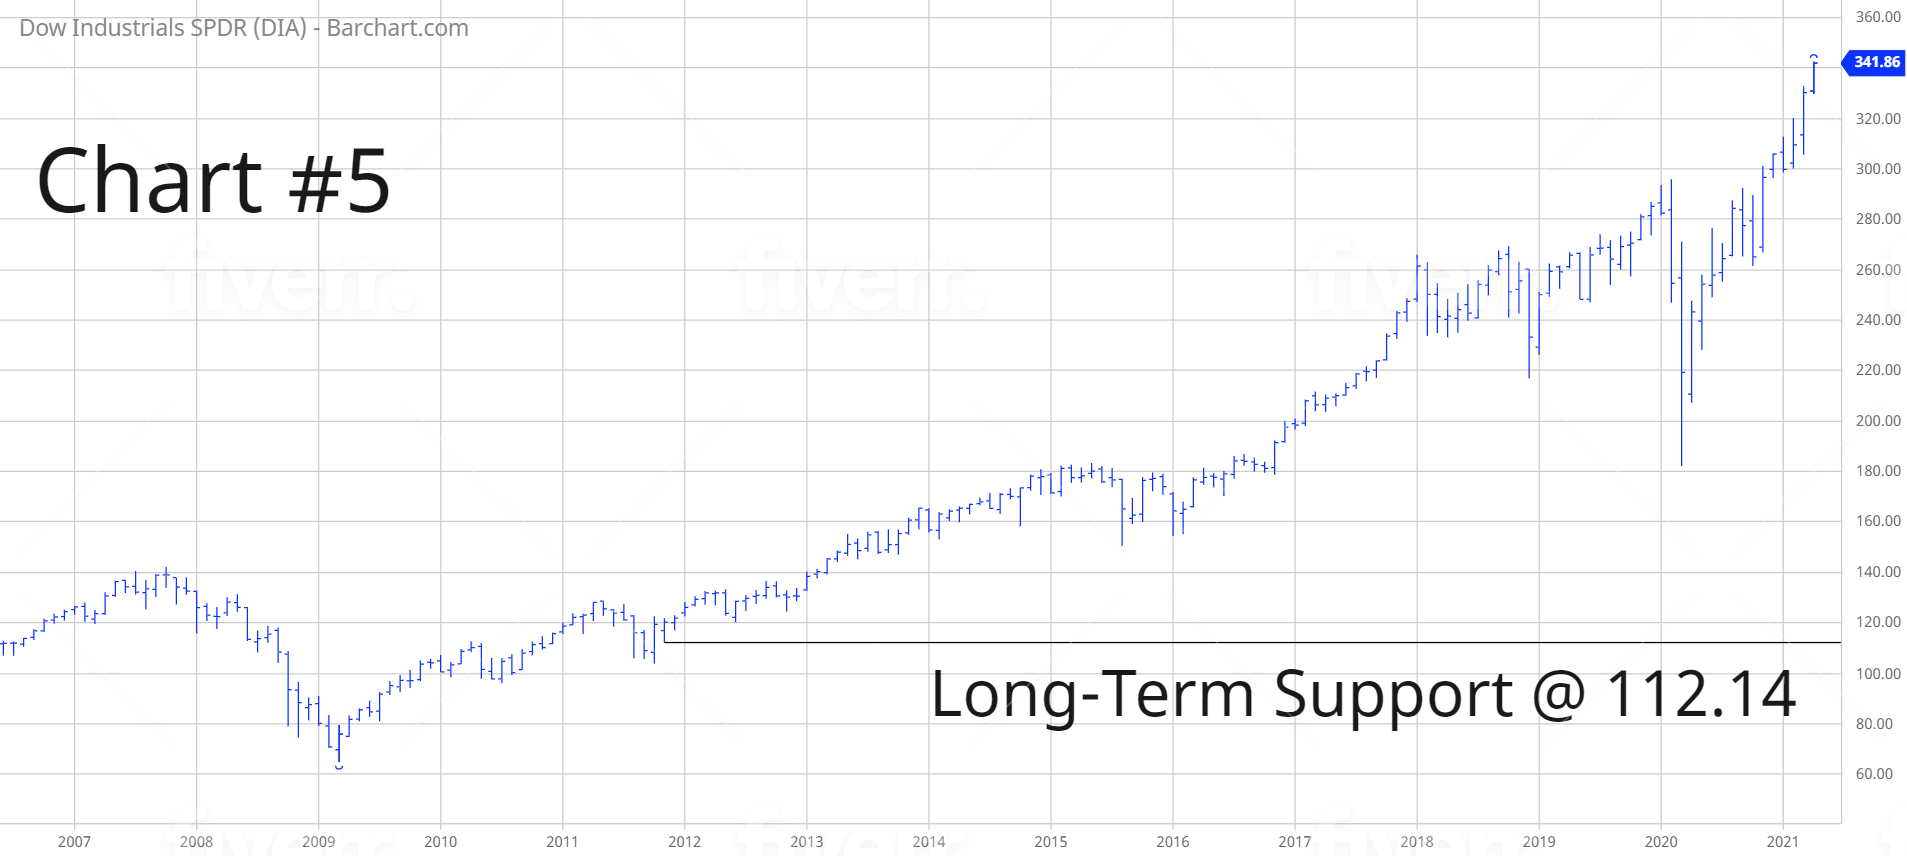
LONG-TERM TREND
Please review the 15-year chart of DIA (Chart #5). The long-term chart pattern continues to remain extremely bullish. The next level of resistance is 353.34. A weekly close below 112.14 is needed to flip the chart into a bearish formation.