SPDR Dow Jones Industrial Average ETF (DIA)
Key Statistics – DIA
Thank you for reading this post, don't forget to subscribe!
Minor Support Level 259.94 Minor Resistance Level 299.49
Major Support Level 112.14 Major Resistance Level 314.04
Minor Buy Signal 308.48 Minor Sell Signal 255.35
Major Buy Signal 323.02 Major Sell Signal 101.33
BRIEF OVERVIEW – DIA
On 9 November, Pfizer shocked the world by announcing a vaccine for COVID-19. The effective rate of the vaccine is 90%. Essentially, Pfizer’s vaccine has ended the global pandemic. This is incredibly bullish news for the global economy. Going forward, how will this news effect the global investment landscape? Which investments will be the big winners as a result of the Pfizer vaccine? Which investments will suffer the greatest losses? Is this the beginning of a multi-year economic boom? Let’s discuss the details.
On 31 December 2019, China officially notified the World Health Organization (WHO) concerning an unknown virus. Two months later, the United States found itself fully engulfed in the coronavirus. The global population has been dealing with the pandemic for the better part of 11 months. For all practical purposes, Pfizer’s announcement concerning its vaccine marks the beginning of the end of COVID-19. Most health experts agree that the majority of the world population will receive the vaccine by Q4 2021.
The majority of professional economists agree that the global economy will experience a dramatic surge in economic activity following the release of the vaccine. In fact, it’s highly likely that consumers will increase their spending habits well before health officials begin administering the vaccine. Why? Because there is an enormous amount of pent-up demand dating back to Q1 2020. Essentially, the global economy has been frozen for the past 11 months. Consequently, consumers have been delaying the purchase of things such as clothing, household goods, non-essential medical care, automobiles, dining out, education, vacations and other forms of entertainment. The list is endless.
If Congress approves a new stimulus package in Q1 2021, it will add fuel to the fire by providing consumers with the necessary funds to make purchases. In fact, a trillion dollar spending bill coupled with a cure for the global pandemic could be the perfect recipe for a multi-year surge of economic growth. Is it possible that we are on the verge of experiencing a repeat of the Roaring Twenties? If the virus is completely eradicated by the end of 2021, the answer appears to be “Yes.”
The SPDR family of exchange traded funds (managed by State Street Global Advisors) introduced the Dow Jones Industrial Average ETF on 14 January 1998. The ticker symbol is DIA. This ETF is a perfect vehicle for investors who wish to participate in the performance of DJIA. DIA is an extremely popular ETF, with an average daily volume of nearly six million shares. The ETF is commonly referred to as “Diamonds.”
SHORT-TERM VIEW – DIA
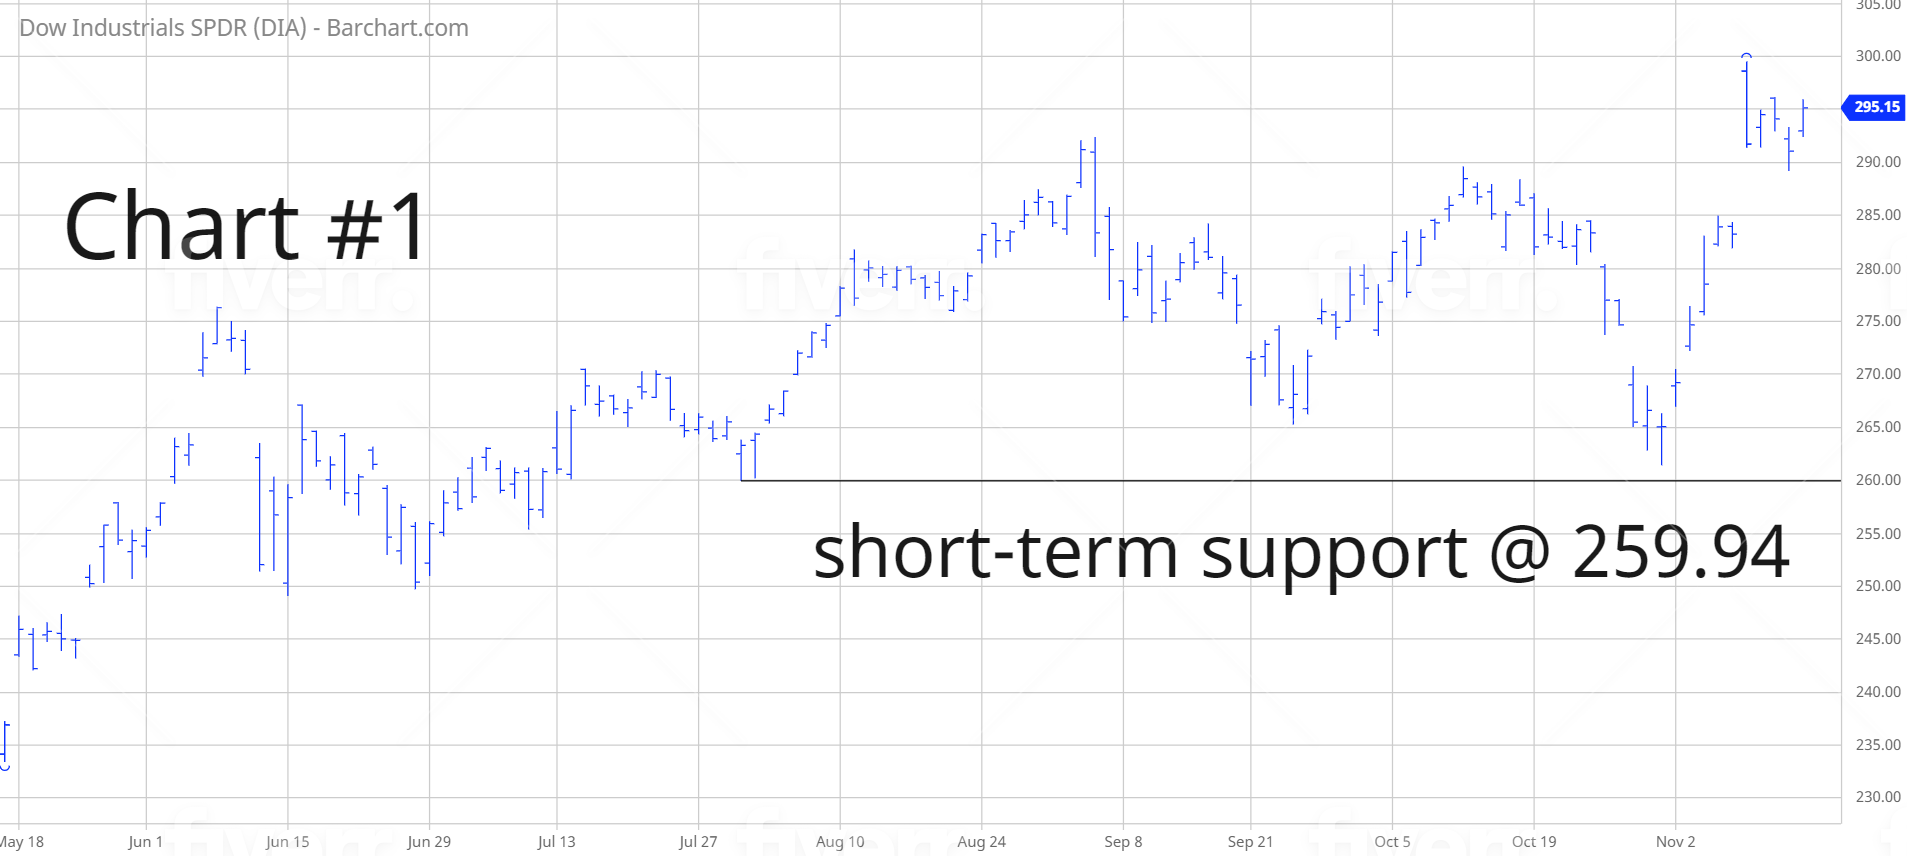
DIA remains in bullish territory on a short-term basis. The next level of resistance is 299.49. In order to recapture the momentum, the bears need a weekly close below 259.94. The most likely scenario is a continuation of higher prices.
Based on the Aroon Oscillator, DIA has a neutral reading of +24. The Aroon Oscillator is programmed differently than most stochastic indicators. The oscillator fluctuates between -100 and +100. A reading of 0 would indicate a neutral position. Therefore, a reading of +24 is considered fairly neutral.
Despite the fact that DIA has generated a sharp rally during the past two weeks, the oscillator remains in neutral territory. The ETF is capable of moving much higher over the course of the next few weeks.
LONG-TERM VIEW – DIA
As we mentioned, it is quite possible that the global economy could generate a massive surge of economic activity very similar to the Roaring Twenties. If we do experience a repeat of the Roaring Twenties, what can we expect in terms of economic growth? How strong was the economy in the 1920s? Before we analyze the data, let’s determine which countries actually participated in the Roaring Twenties. In the 1920s, globalization was in its infancy stage. The technology was simply not available for companies to operate outside the boundaries of their home country. Therefore, the Roaring Twenties was certainly not a global phenomenon. The three major players included North America, Europe and Australia. Thanks to major advances in technology during the past few decades, many more countries will have an opportunity to participate in the “new” Roaring Twenties.
Contrary to popular belief, the Roaring Twenties did not begin until 1921. In fact, in the United States, the domestic economy actually experienced a recession in 1920. However, following the recession, economic activity exploded beginning in 1921. Please review the following table.
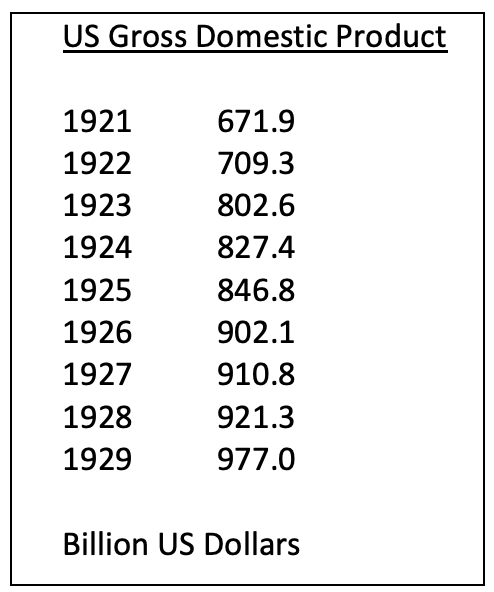
The economic landscape of the early-1920s was eerily similar to today’s economic environment. For example, as we mentioned, the US experienced a severe recession in 1920. The recession was caused by the Spanish flu pandemic, which coincidentally, was the last time the United States experienced a pandemic until COVID-19. Therefore, the recession of 1920 and the recession of 2020 were caused by the exact same thing. Another economic similarity between 1920 and 2020 was deflation. In 1920, the Federal Reserve enacted policies in an effort to stave off fears of deflation. Today, the Federal Reserve is taking similar measures to alleviate deflationary pressures. A third similarity between 1920 and 2020 was the amount of new innovations. The 1920s were filled with major advances in travel, communication, healthcare and entertainment. The 2020s are poised to experience similar new waves of innovation, particularly in the area of finance and technology.Between 1921 and 1929, the US economy grew 45.4%. This represents an average annual growth rate of 5.0%. This number is absolutely incredible. These days, it’s practically unheard of for a developed country to grow its domestic economy by 5% in a single year. For example, the last time the US economy expanded by more than 5% was 36 years ago in 1984. During the past five years, the average annual growth rate for the US economy has been 2.4%. Over the course of the past 90 years, the United States has never been able to match its economic performance of the Roaring Twenties. Not even close.
Of course, we all know what happened following the Roaring Twenties. The United States officially entered the Great Depression on 29 October 1929. For the next decade, the country experienced a dramatic reduction in economic activity.
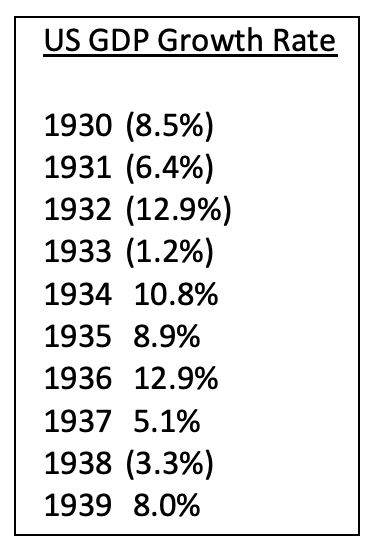
Most historians agree that the Great Depression ended in 1939. Why? Because the US economy produced several consecutive years of economic growth beginning in 1940.As you can see from the table, the US economy recorded four consecutive years of negative growth. In 1934, President Roosevelt launched the New Deal, which was an “alphabet soup” program designed to provide construction jobs to millions of unemployed workers. The New Deal turned out to be one of the most successful programs in the history of the federal government. The US economy enjoyed four consecutive years of economic expansion. In 1938, Roosevelt eliminated a few of the New Deal programs. Immediately, the country slipped back into a depression. Roosevelt reversed course in 1939 by expanding the New Deal. The domestic economy responded by growing 8.0%.
Is it possible that the United States could fall into another depression similar to the 1930s? Of course, anything is possible. However, it’s highly unlikely because our nation’s monetary leaders are much more accommodative compared to the 1930s. These days, the Federal Reserve is more than willing to stimulate the economy by printing large sums of money. In the 1930s, the Fed made the mistake of reducing its balance sheet by selling Treasury securities to member banks. Essentially, the Fed was removing money from the economy. This turned out to be a huge mistake and probably increased the severity of the Great Depression. The Federal Reserve will never repeat this mistake again, which explains why the odds of another depression are rather remote.
In regard to today’s investment environment, Pfizer’s announcement of a vaccine will impact the various asset classes in different ways. The “big winner” will probably be the stock market because the elimination of the global pandemic will substantially improve corporate earnings. The “big loser” will be the gold market because the Federal Reserve will not be required to print excessive amounts of money in order to stimulate the economy. In terms of commodities, the Pfizer news will be slightly bullish. Interest rates will most likely creep higher because economic activity will increase. In regard to the US Dollar, the Pfizer vaccine is neutral-to-bullish.
What about DIA? The long-term view remains incredibly bullish. The next resistance level is 314.04. A weekly close below 112.14 is needed in order to reverse the momentum. It’s highly unlikely that the long-term momentum will turn bearish any time in the near future.
SHORT-TERM TREND – DIA
Please review the 6-month chart of DIA (Chart #1). DIA remains in bullish territory on a short-term basis. The next level of resistance is 299.49. The chart pattern will remain bullish as long as DIA stays above 259.94 on a weekly closing basis. The most likely scenario is a continuation of higher prices.
LONG-TERM TREND – DIA
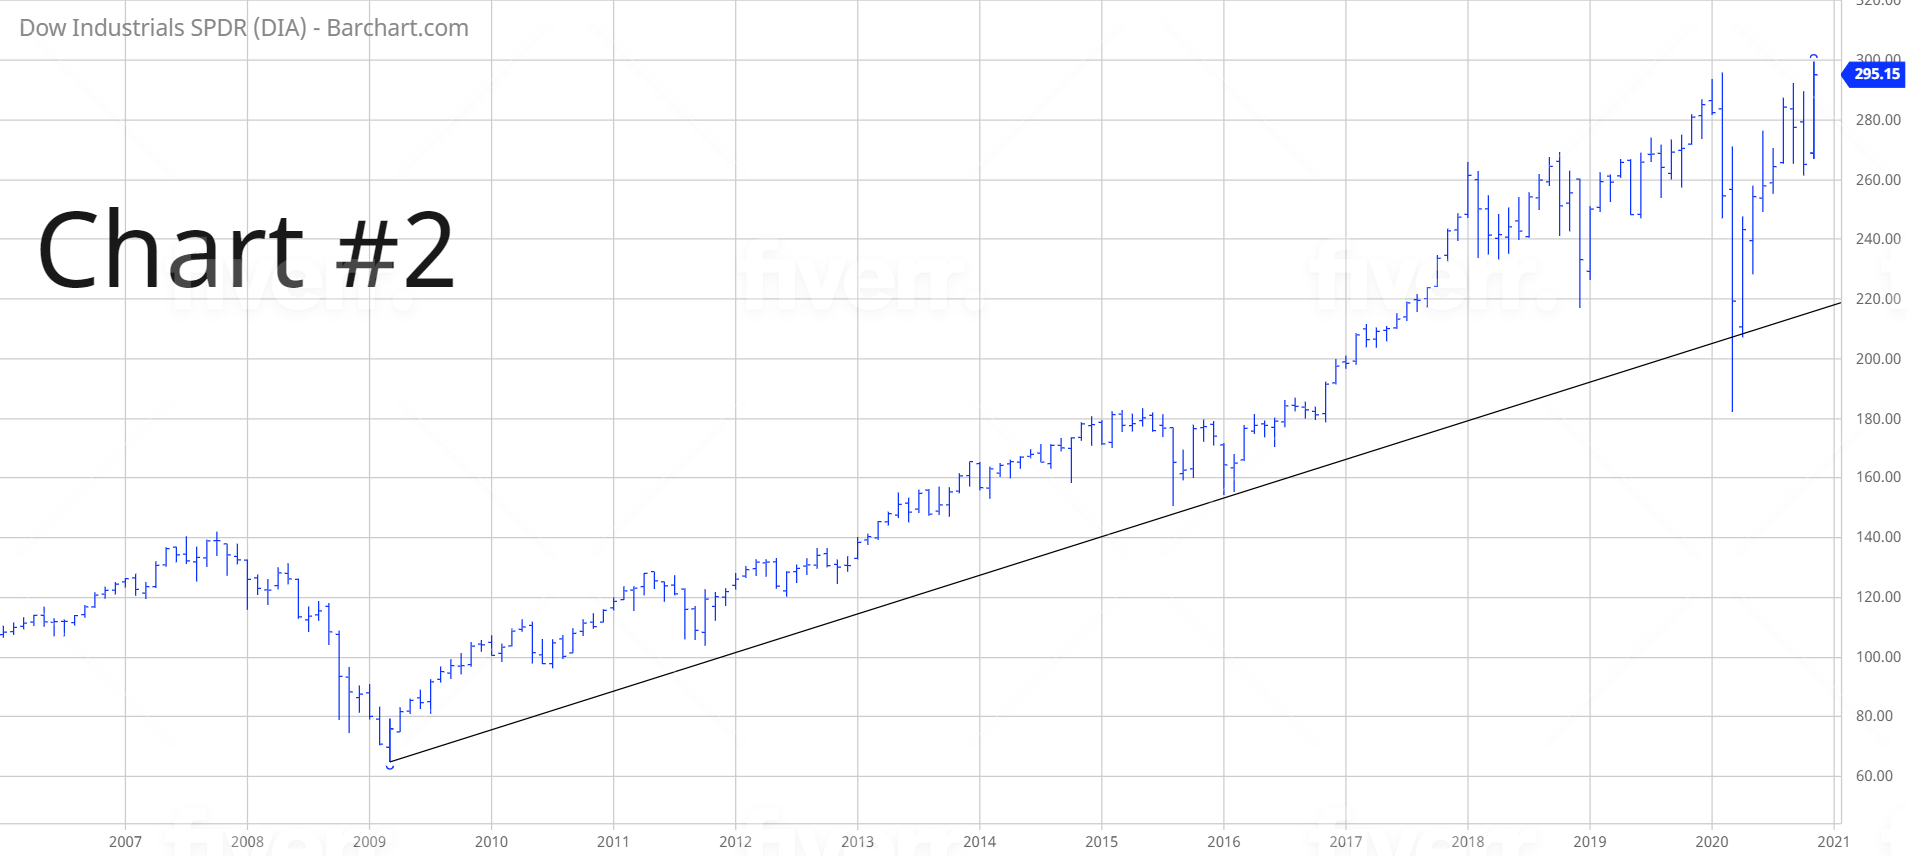
Please review the 15-year chart of DIA (Chart #2). The long-term bullish trendline was broken in March 2020. However, the trend remained bearish for less than 30 days. This is a testament to the incredible bullish nature of the stock market. A weekly close below 112.14 is needed in order to create a bearish chart pattern, which is highly unlikely.