SPDR S&P 500 ETF (SPY)
Key Statistics
Minor Support Level 319.09 Minor Resistance Level 354.02
Thank you for reading this post, don't forget to subscribe!Major Support Level 155.73 Major Resistance Level 377.92
Minor Buy Signal 356.38 Minor Sell Signal 315.56
Major Buy Signal 389.77 Major Sell Signal 139.54
BRIEF OVERVIEW
On 3 November, the United States will elect a new commander-in-chief for the next four years. Our next President will be responsible for overseeing the largest economy on the planet. His decisions and actions could have a major influence on the future path of economic activity. What about the stock market? Does the President of the United States have the ability to impact the direction of equity prices? More importantly, which political party is most preferred by Wall Street investors? Based on historical prices, which party has produced the highest rate of return? Let’s review the details.
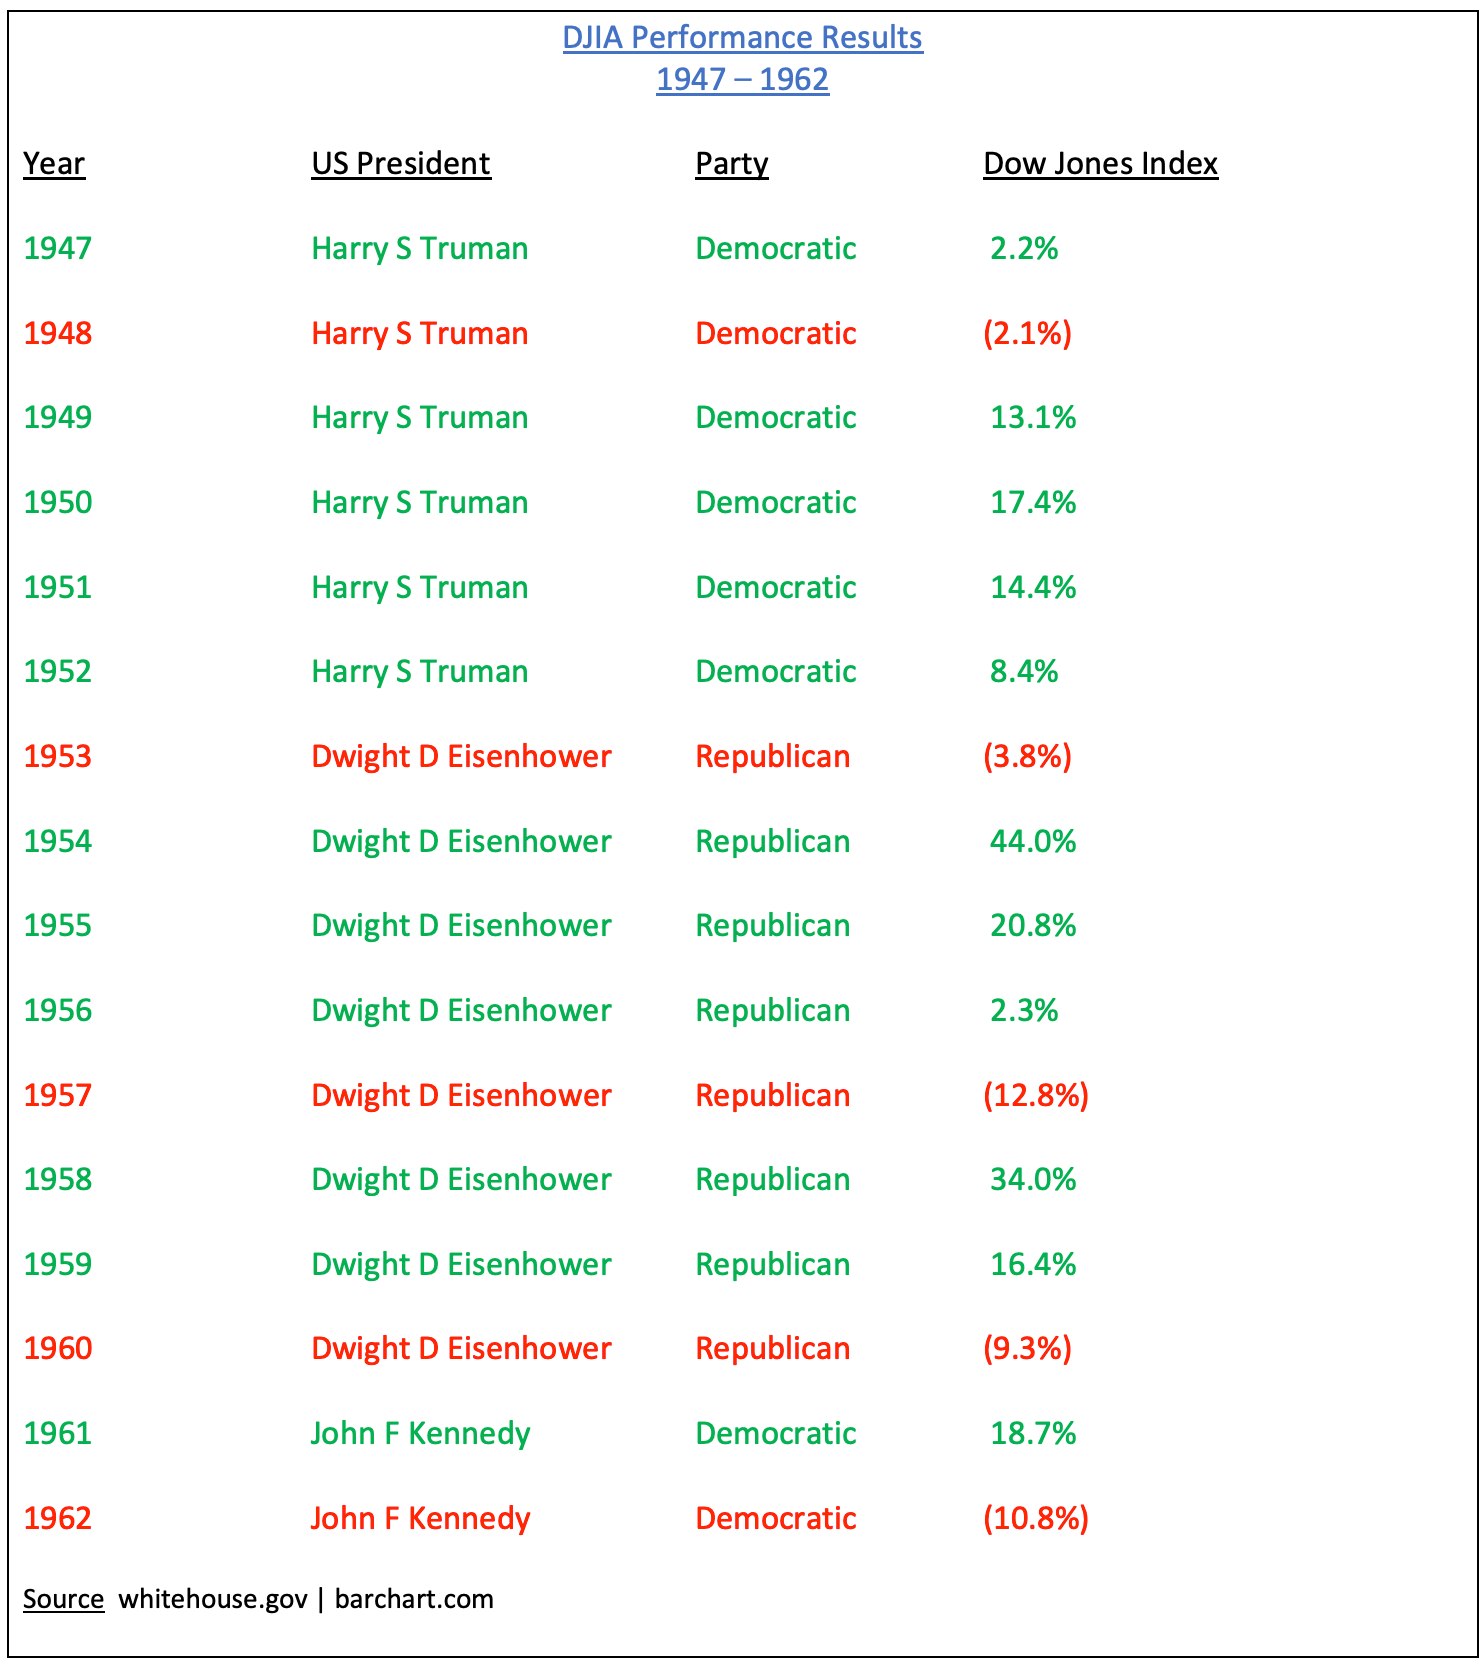
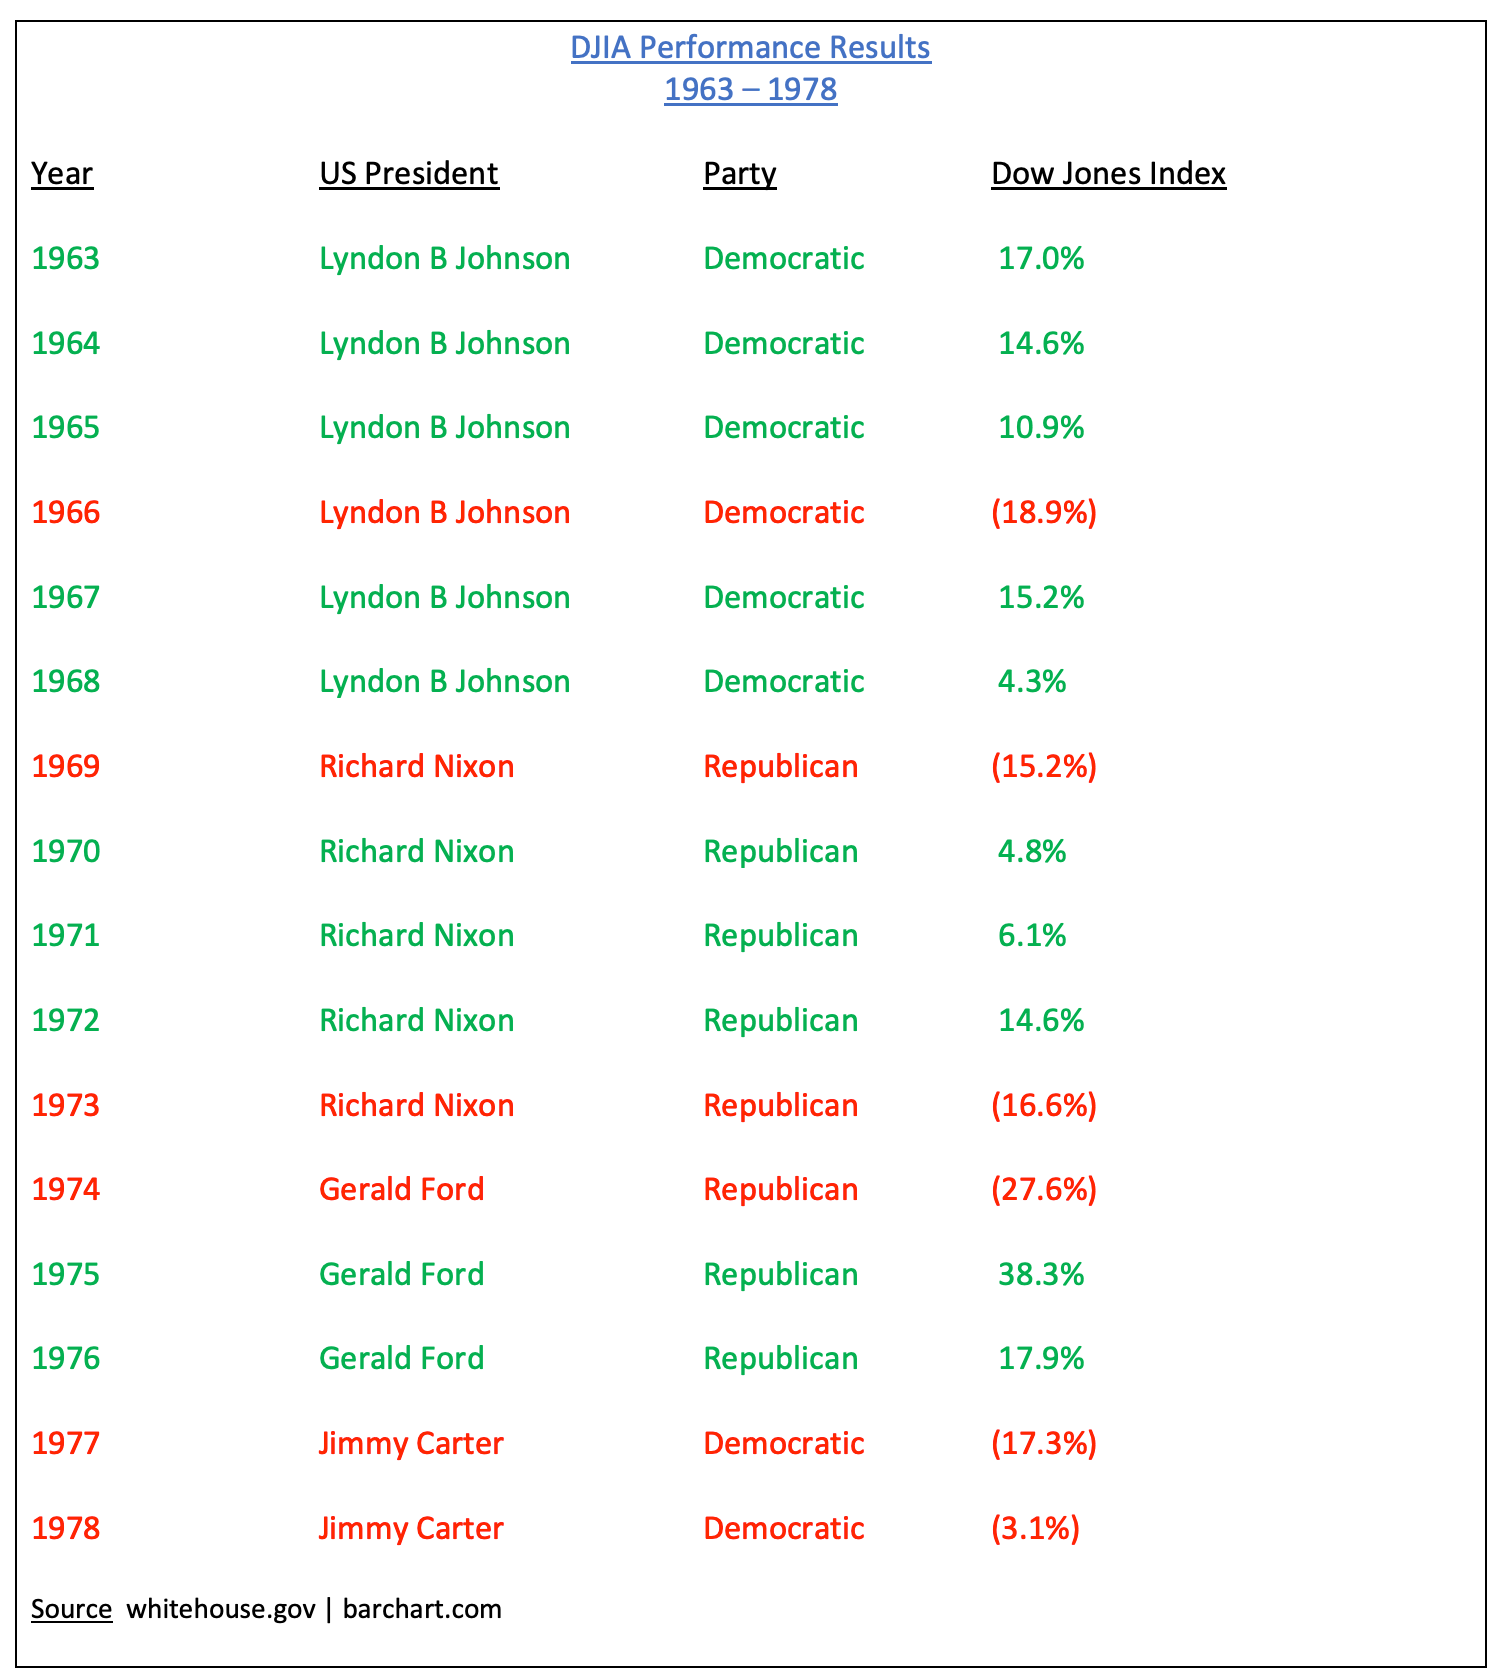
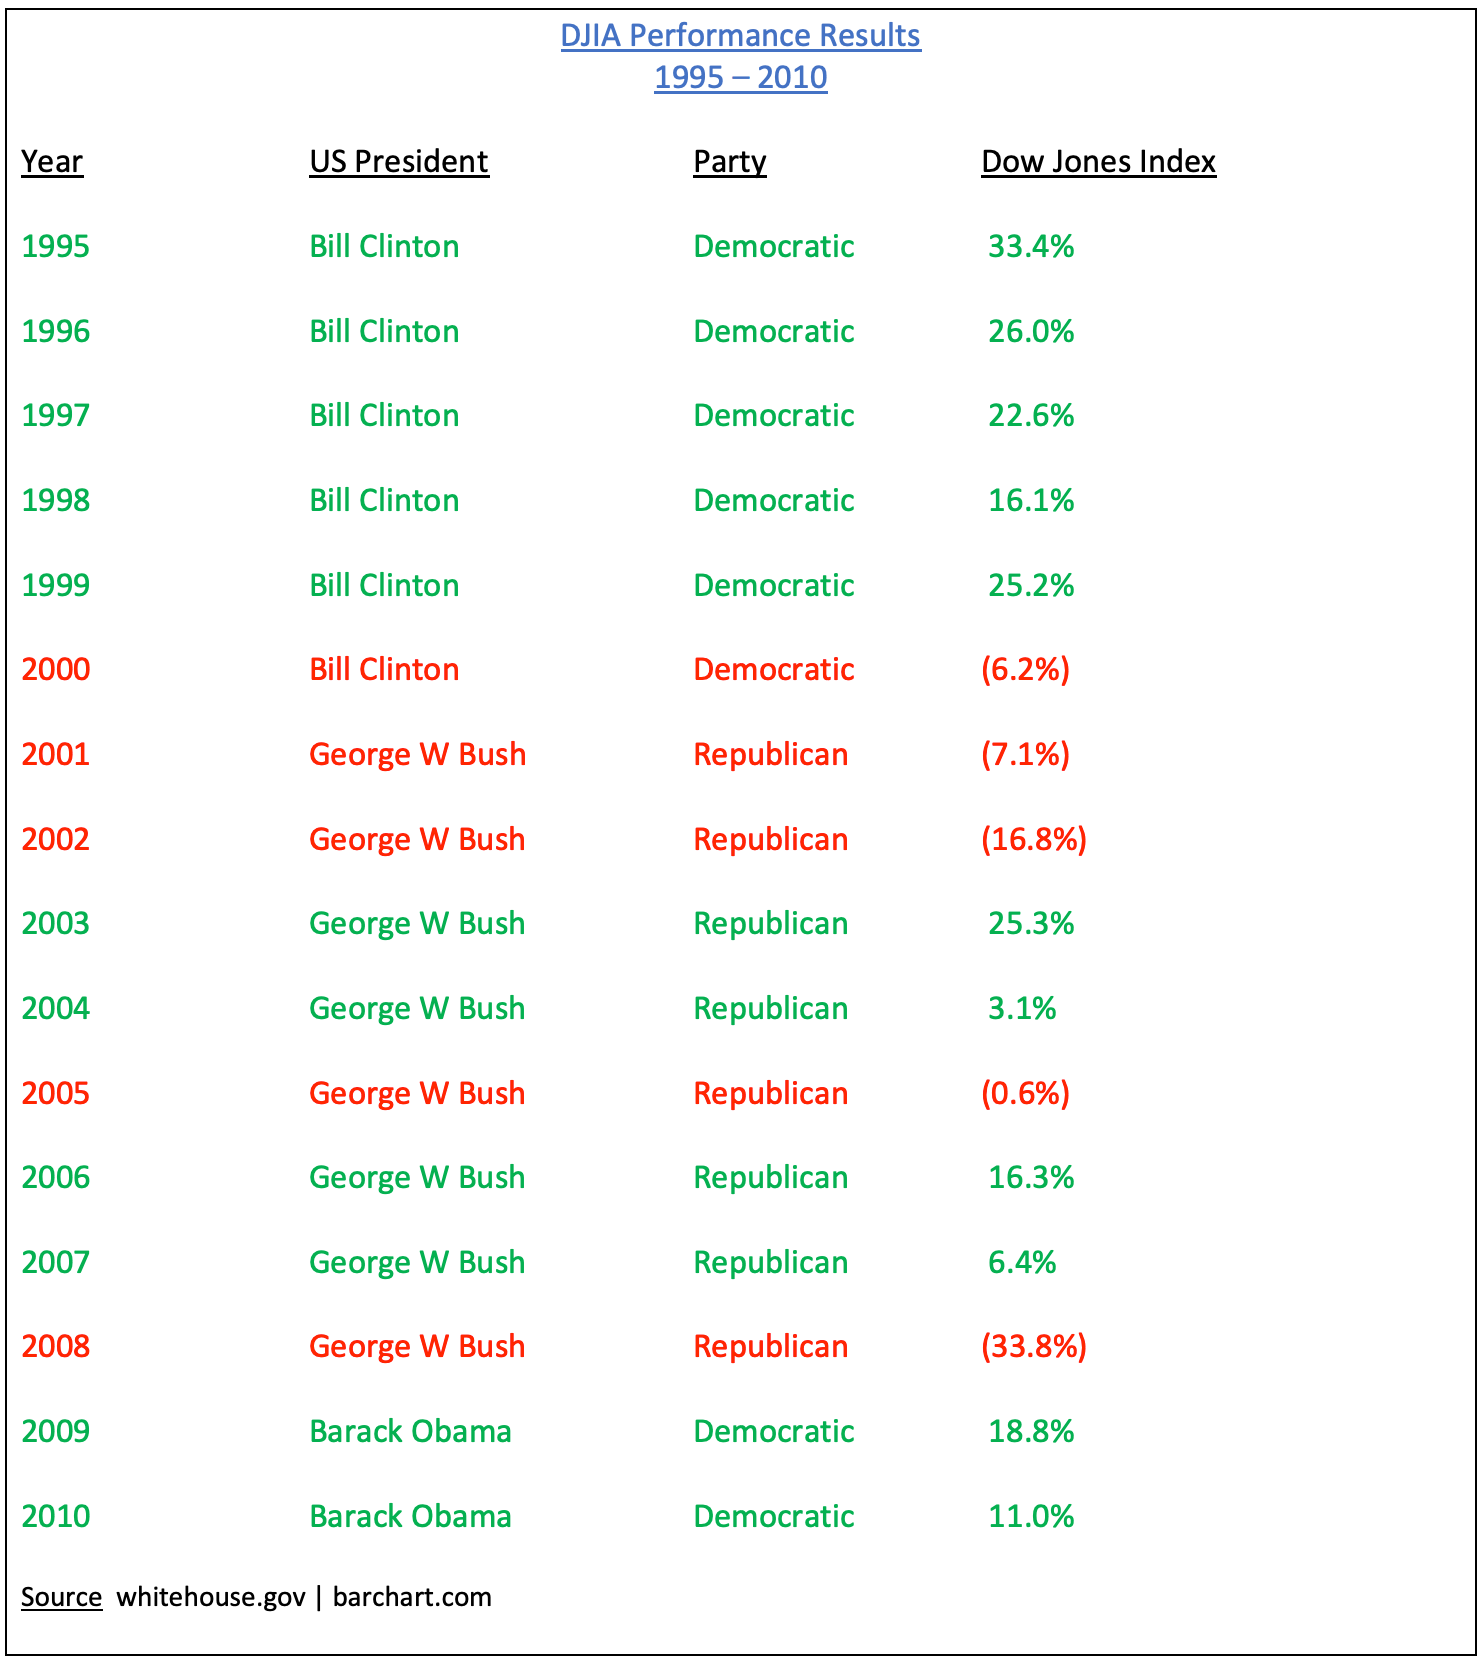
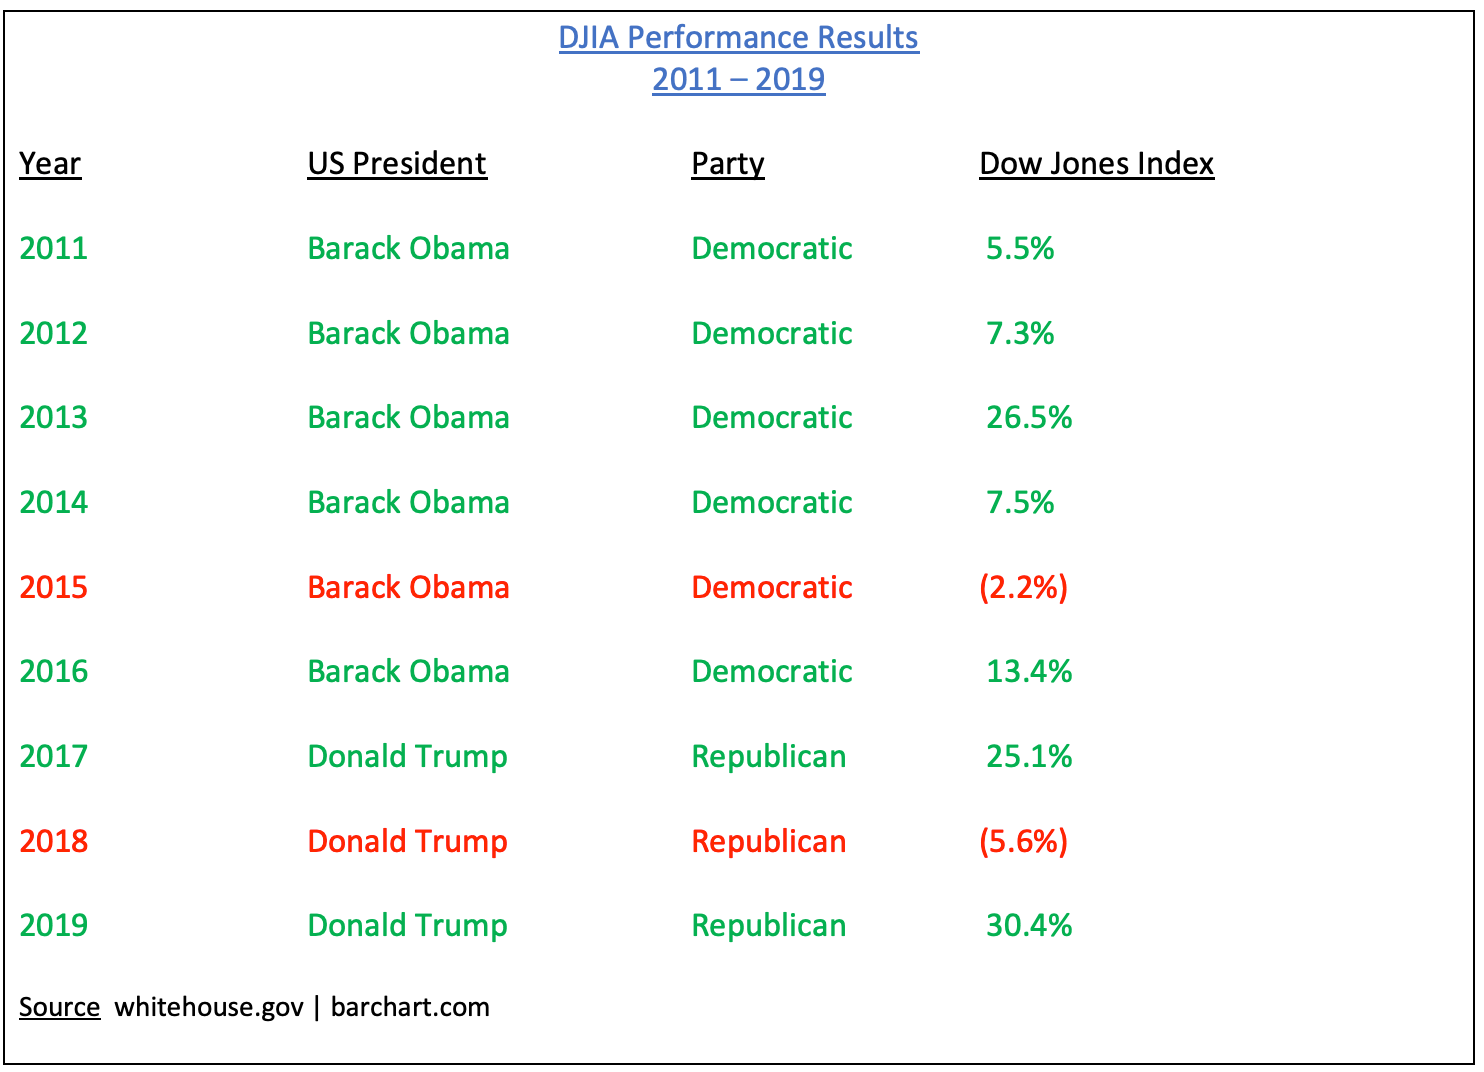
As you can see from the tables, the political data was analyzed from 1947 to 2019. Therefore, 73 years of information was collected. Specifically, what conclusions can we draw from this material? The most important piece of data that can be gleaned from these tables is the fact that Democratic administrations have historically generated higher stock market returns versus their Republican counterparts. Without question, these results fly in the face of conventional wisdom, particularly on Wall Street. The vast majority of Wall Street professionals have always considered Republican administrations to be “pro-business” in comparison to Democrats. Based on 73 years of data, this is simply not true.
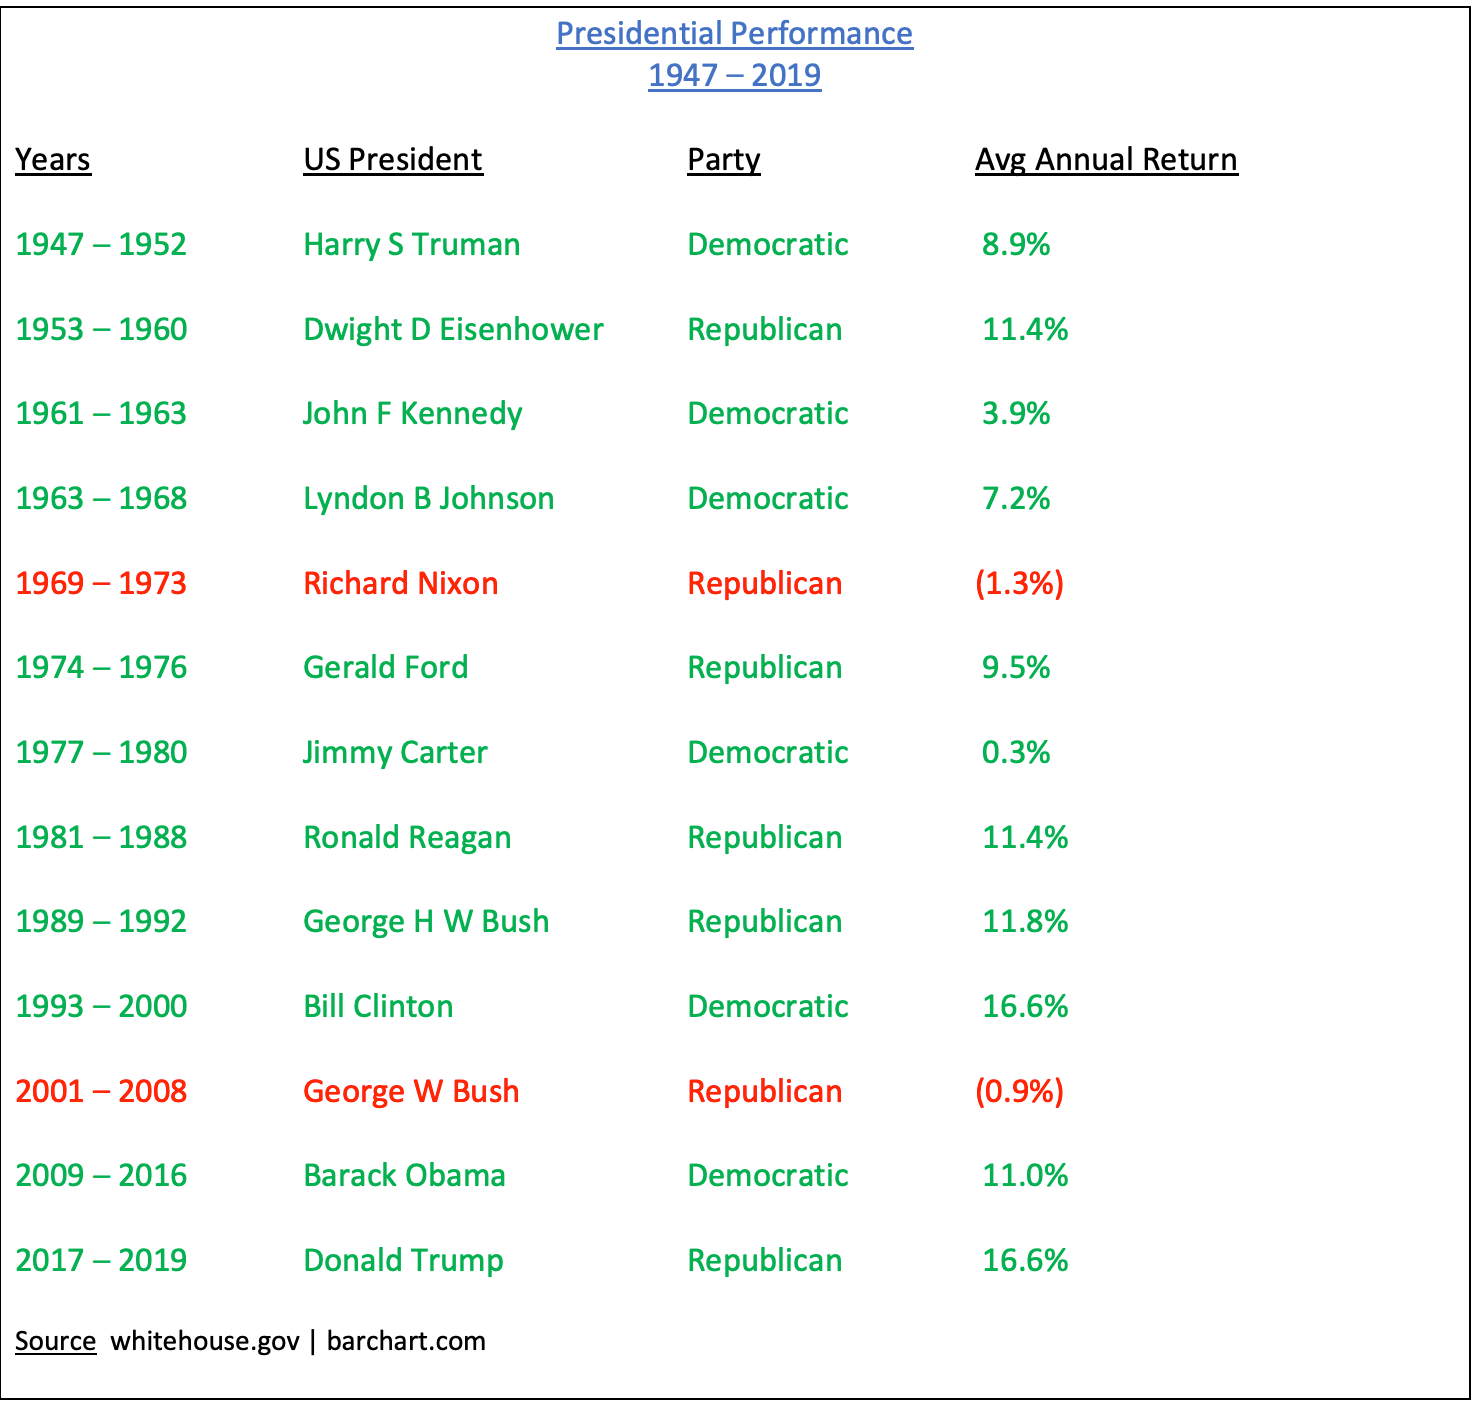
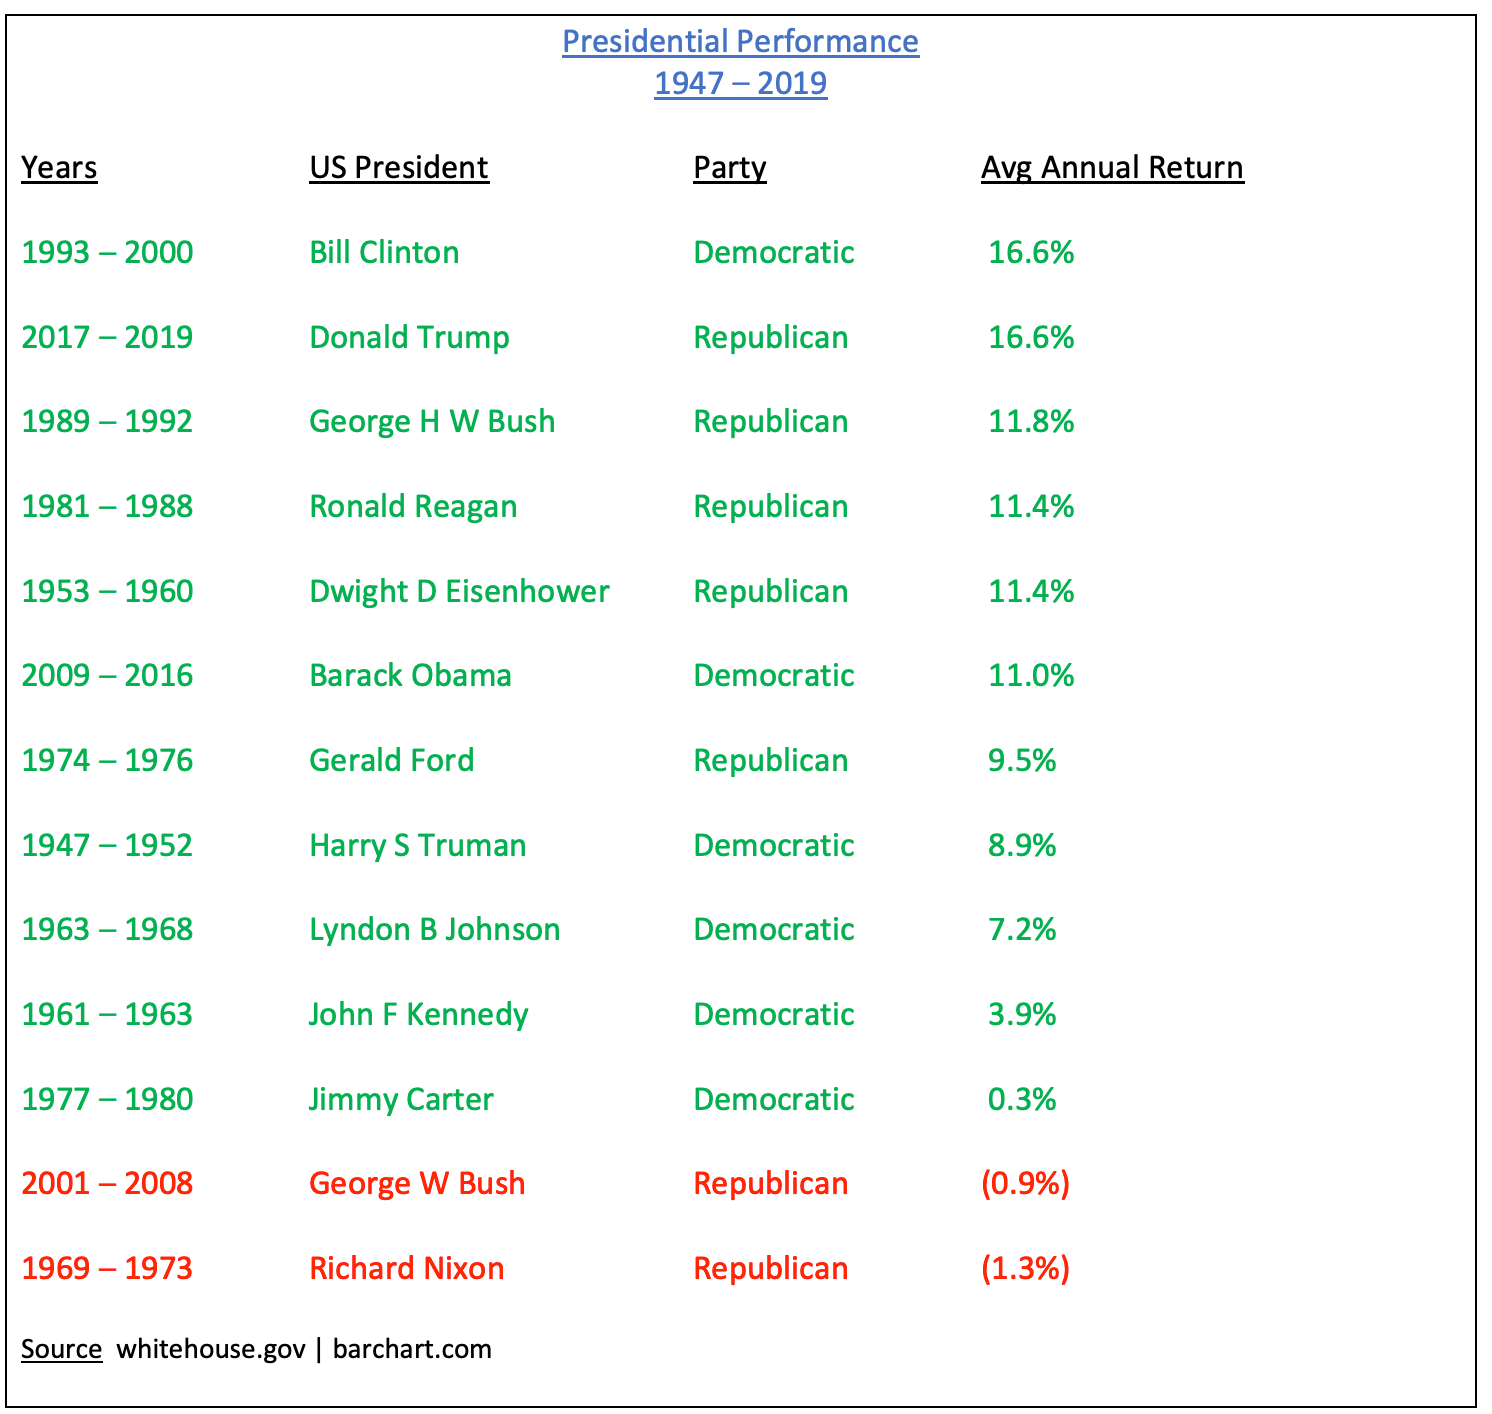
Since 1947, Democratic administrations have produced an average annual return of 9.5%. Republican administrations have yielded an average annual return of 6.8%.* Therefore, Democrats have easily outperformed Republicans. Most professional investors and financial advisors would agree that an average annual increase of 2.7% would dramatically improve the long-term value of an investor’s portfolio. Of course, there is no guarantee that this trend will continue in the future. However, at least for now, the Democrats have the upper hand.
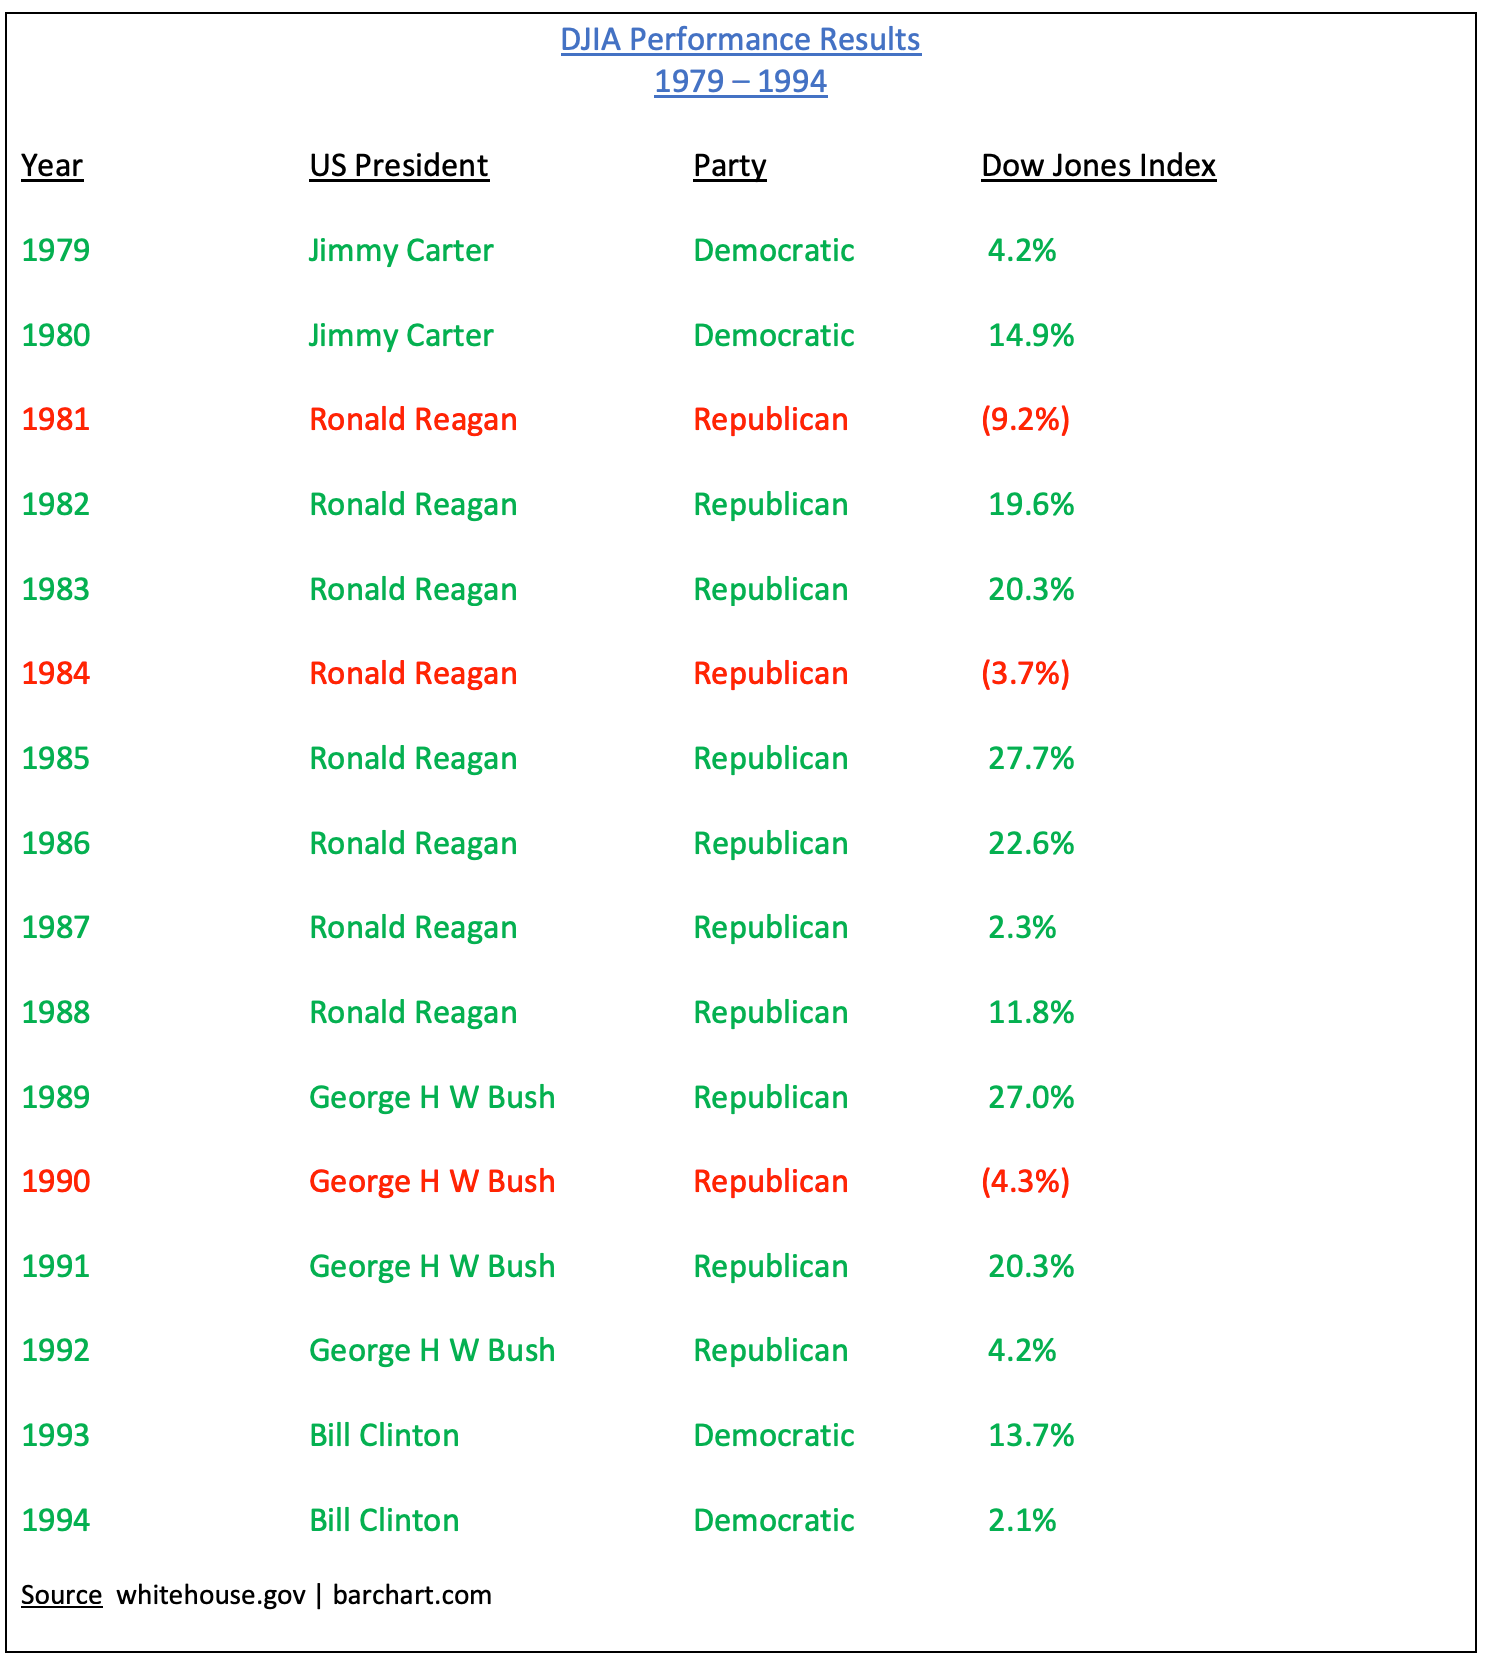
In terms of individual results, President Clinton easily achieved the highest average annual return at 16.6%. Clinton had the benefit of being President during the internet mania, which turned out to be a huge boost for the domestic economy. Of course, political pundits will argue that Clinton’s economic policies were the driving force behind the technology boom of the 1990s. To a certain extent, the pundits are probably correct. President Clinton was a centrist in terms of his economic agenda. His policies were quite favorable to new businesses and start-up companies.
Despite the fact that President Clinton was a Democrat, his views on government regulation were extremely conservative, particularly in regard to Wall Street. Clinton pushed for deregulation, which allowed the major banks and investment firms on Wall Street to provide cheap financing for start-up technology companies.
George H W Bush and Ronald Reagan followed behind Clinton in regard to stock market performance. Presidential historians will surmise that “Reaganomics” was responsible for the strong rate of return during the Reagan years and the Bush years. During the past 30+ years, economists have engaged in heated debates concerning whether or not Reagan’s “trickle down” economic policies were beneficial to the domestic economy. Most likely, this debate will continue well into the future. However, there is no disputing the fact that the stock market performed incredibly well during the “Reaganomics” years. In fact, it was so successful that George H W Bush was able to ride the coattails of Reagan’s economic policies during the first few years of his presidency.
* President Trump’s results were not included because his term has not ended.
The 2020 Presidential election is finally upon us. It will be very interesting to see how the stock market reacts to our nation’s next President. Most likely, there will be a tremendous amount of short-term volatility.
In an effort to provide investors with exposure to the S&P 500, the SPDR family of exchange traded funds introduced the S&P 500 ETF on 22 January 1993. The ticker symbol is SPY. The ETF allows investors to participate in the S&P 500 without the burden of owning shares of each company within the index. SPY is historically significant because it was the very first exchange traded fund listed in the United States. SPY is easily the most heavily traded ETF, with daily volume usually exceeding 100 million shares.
SHORT-TERM VIEW – SPY
There appears to be a great deal of uncertainty as we approach the final 24 hours before the Presidential election. Wall Street hates uncertainty. This explains the recent sell-off in the stock market. The bears have recaptured the short-term momentum. The next level of support is 319.09. The momentum will reverse in favor of the bulls on a weekly close above 354.02.
LONG-TERM VIEW – SPY
Regardless of who wins the White House, it’s highly unlikely that the stock market will be impacted from a long-term perspective. These days, equity prices are driven by Federal Reserve monetary policy. Throughout the 1980s and 1990s, the White House had a great deal of influence on the direction of the stock market. However, things began to change rather dramatically following the terrorist attack in 2001. In order to stimulate the economy, the Federal Reserve unleashed a massive amount of monetary stimulus immediately following the 911 crisis.
The events of September 11 marked a major shift in power for the Federal Reserve. Monetary policy replaced fiscal policy as the preferred method for stimulating the economy and boosting the stock market. The Federal Reserve’s influence over the stock market has slowly continued to increase during the past decade. Historians will argue that the White House and Congress played a significant role in dealing with the 2008 Global Financial Crisis. This is true. Congress did pass several “alphabet soup” programs in an effort to save the big US banks. However, these programs were heavily endorsed by the Federal Reserve. Of course, we all know that the Fed has been largely responsible for boosting the economy and the stock market during the recent pandemic.
The “bottom line” is that our next President will not have a long-term impact on the direction of the stock market. The most likely scenario is that equity prices will continue to rise as long as the Federal Reserve maintains an aggressive money printing program.
In regard to SPY, the long-term view remains extremely bullish. The next resistance level is 377.92. A
weekly close below 155.73 is needed in order to reverse the momentum. It’s highly unlikely that the long-term momentum will turn bearish any time in the near future.
SHORT-TERM TREND – SPY
Please review the 6-month chart of SPY (Chart #1). The recent decline in the stock market has flipped the chart pattern from bullish to bearish. The next level of support is 319.09. The chart pattern will turn bullish on a weekly close above 354.02. The most likely scenario is a trading range as Wall Street continues to monitor the global pandemic.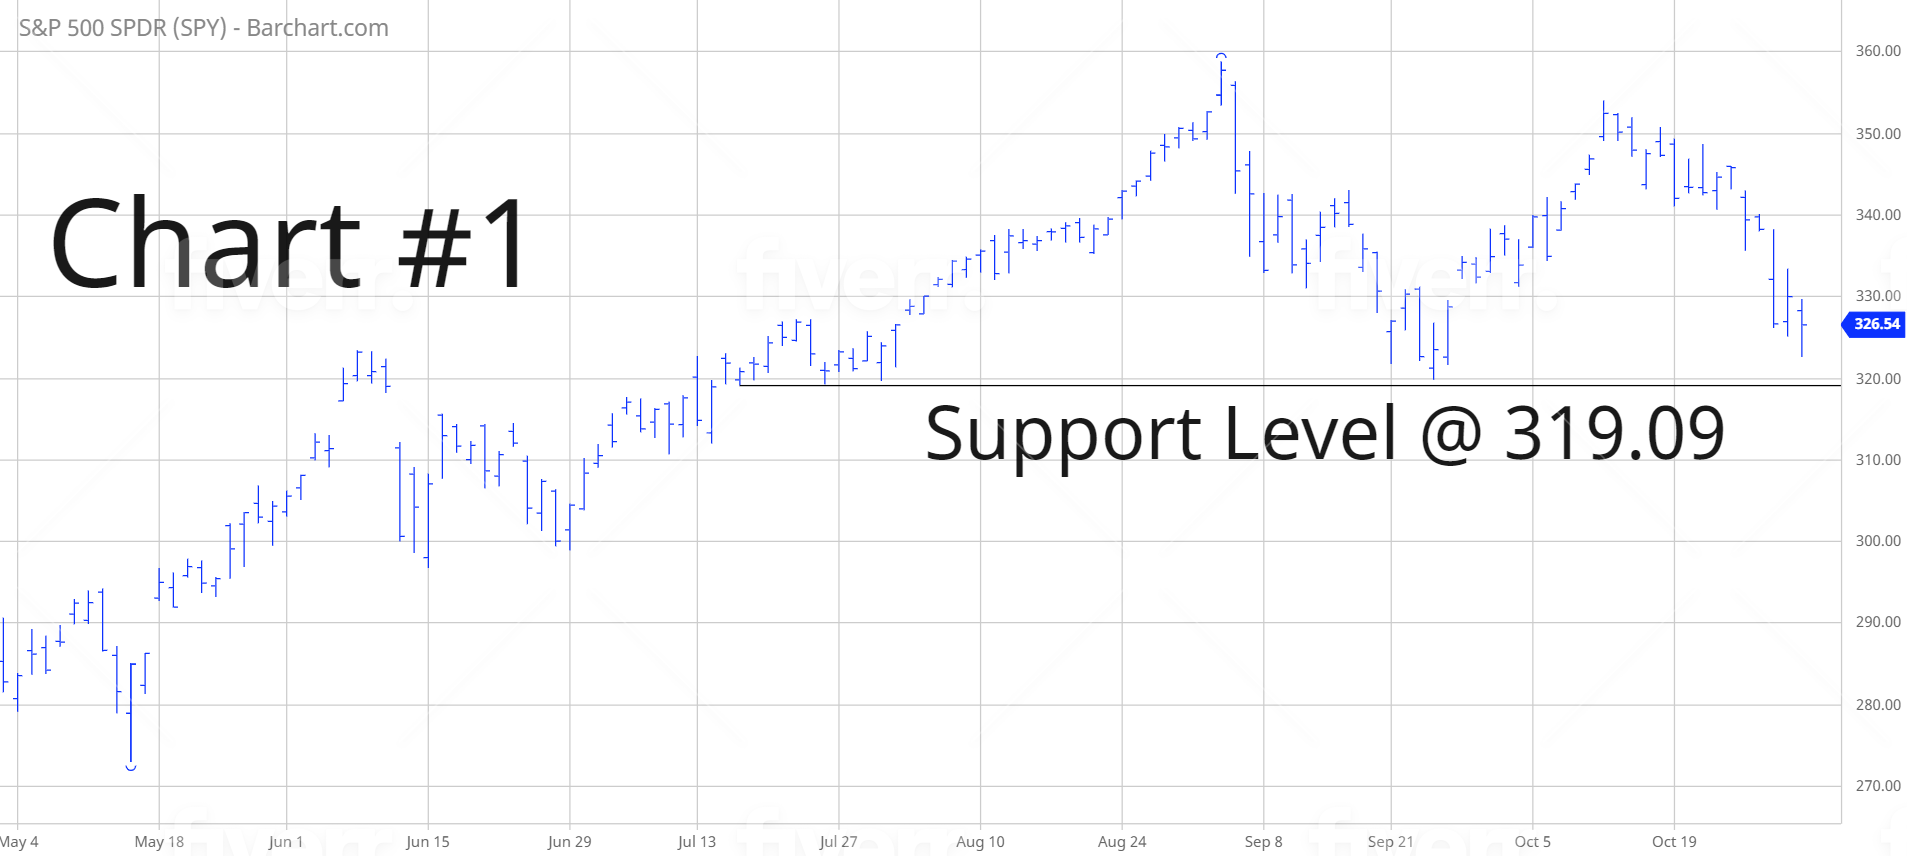
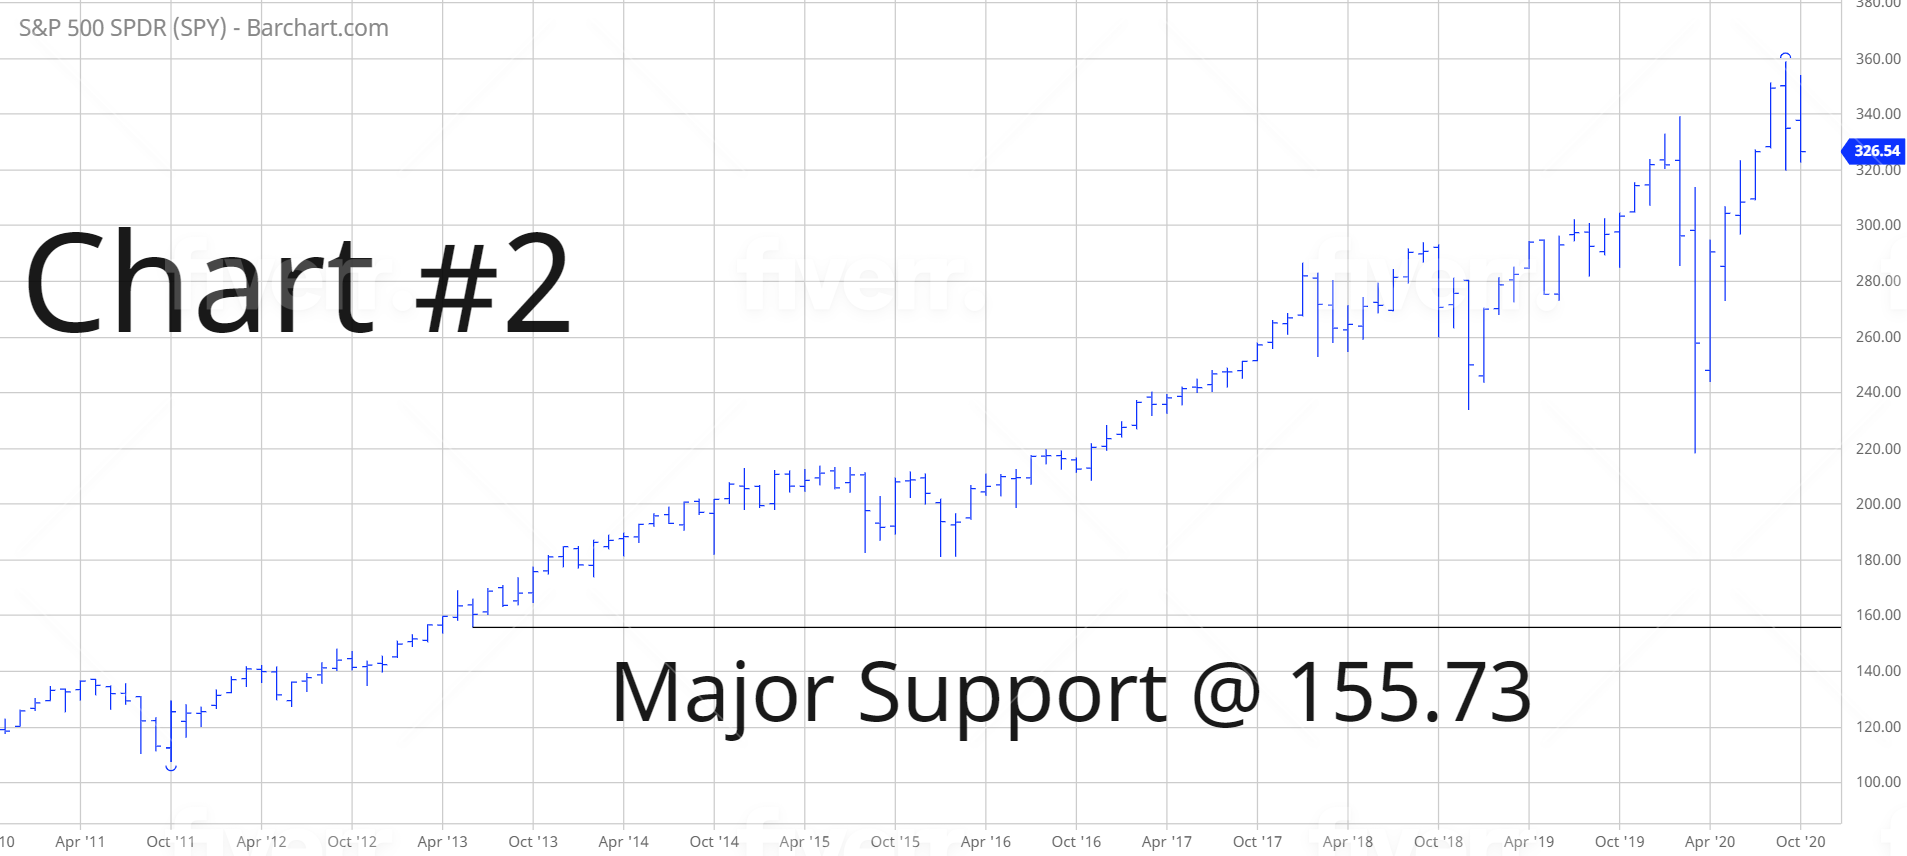
LONG-TERM TREND – SPY
Please review the 15-year chart of SPY (Chart #2). Despite the recent decline, the long-term chart pattern remains very bullish. A weekly close below 155.73 is needed in order to create a bearish chart pattern. Highly unlikely.