Invesco DB Commodity Index Tracking Fund (DBC)
Key Statistics
Thank you for reading this post, don't forget to subscribe!
Minor Support Level 13.06 Minor Resistance Level 14.82
Major Support Level 11.10 Major Resistance Level 25.43
Minor Buy Signal 15.66 Minor Sell Signal 12.48
Major Buy Signal 26.53 Major Sell Signal 10.41
BRIEF OVERVIEW – DBC
The global financial ecosystem consists of five major asset classes. The list includes: stocks, bonds, commodities, alternative investments and cash. Based on historical data, the most volatile asset class is commodities. It’s not uncommon for commodity prices to fluctuate 100% in a single year. Unlike other asset classes, commodities are inextricably linked to weather patterns, geopolitical events, trade wars, supply-demand disruptions, foreign currency fluctuations and inflation expectations. This explains why commodities are inherently volatile. Despite the extreme volatility, this asset class follows a fairly predictable long-term cycle. In fact, commodities have the most reliable long-term cycle among all asset classes. Is this a good time to invest in commodities? Are we in the early stages of a new multi-year bull market? Let’s discuss the details.
Commodity markets have played a major role in the global investment landscape for over 170 years, dating back to the founding of the Chicago Board of Trade (CBOT) on 3 April 1848. For the first several decades of its existence, the CBOT consisted only of agriculture commodities. The list included grains and livestock. In 1972, the commodity universe began a decade-long expansion which substantially increased the number of commodities available for trading on the various commodity exchanges. The first new commodity group to join the ag commodities were foreign currencies, which were officially launched by the Chicago Mercantile Exchange in May 1972. Foreign currencies were soon followed by financial commodities, energy commodities and stock index commodities.
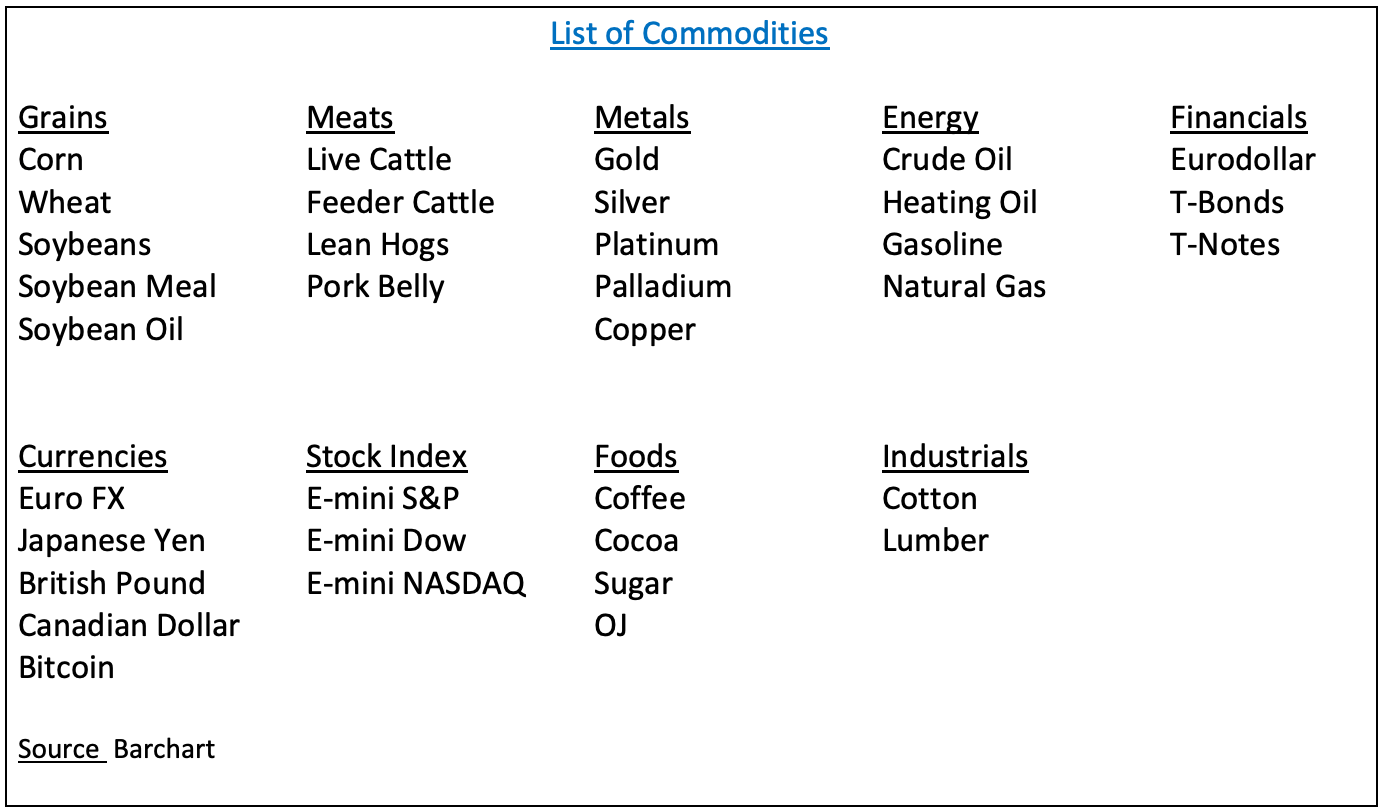
As you can see from the list, the commodity universe has expanded dramatically over the course of the past 40 years. These days, the most popular commodities are based on interest rates and stock prices. “Traditional” commodities (i.e. grains and meats) have steadily declined in volume during the past few decades.
Thanks to the advent of mutual funds and ETFs, it is much easier for investors to gain exposure to the commodity markets. These days, there are dozens of commodity-specific mutual funds, exchange-traded funds and commodity index tracking funds. Investors are no longer required to open an account with a commodity broker in order to participate in this asset class.
The Invesco family of exchange traded funds introduced the DB Commodity Index Tracking Fund on 3 February 2006. The ticker symbol is DBC. This investment vehicle is not a standard ETF (as defined by the Investment Company Act of 1940). Instead, DBC is a statutory trust registered with the Commodity Futures Trading Commission as a Commodity Pool. DBC is designed for investors who want a cost-effective and convenient way to invest in commodity futures. The trust is composed of 14 of the most heavily traded physical commodities in the world. Sectors include: energy, precious metals, base metals and agriculture.
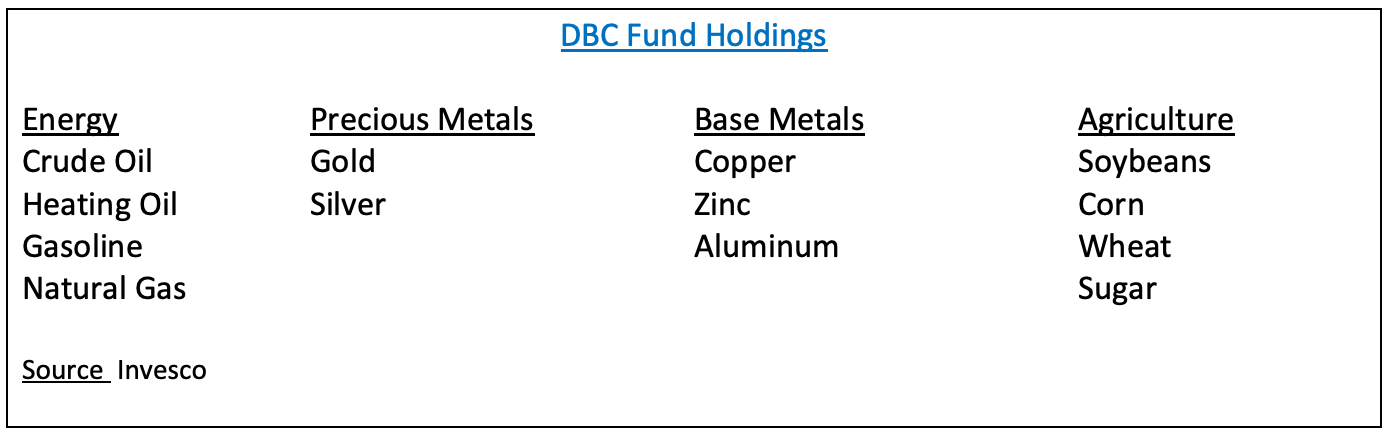
Sector Allocation
- Energy – 56.3%
- Precious Metals – 9.3%
- Base Metals – 17.0%
- Agriculture – 22.1%
SHORT-TERM VIEW – DBC
DBC remains in bullish territory on a short-term basis. The next level of resistance is 14.82. In order to recapture the momentum, the bears need a weekly close below 13.06. The most likely scenario is a continuation of higher prices.
Based on the Aroon Oscillator, DBC has an overbought reading of +76. The Aroon Oscillator is programmed differently than most stochastic indicators. The oscillator fluctuates between
-100 and +100. A reading of 0 would indicate a neutral position. Therefore, a reading of +76 is considered sharply overbought. DBC has certainly enjoyed a substantial rally during the past seven months. The ETF is way overdue for a nasty short-term correction. Based on the oscillator reading, the price correction could begin very soon.
LONG-TERM VIEW – DBC
As we previously mentioned, commodities follow a fairly predictable long-term cycle. In fact, commodities have the most reliable long-term cycle among all asset classes. Is this a good time to invest in commodities? Are we in the early stages of a new multi-year bull market? Let’s discuss the details.
Generally speaking, commodities are comprised of two dominant cycles. The first cycle has an intermediate-term time frame of 6 to 9 years. The second cycle is based on a long-term secular trend of 17 to 30 years. These two cycles have been incredibly accurate for the past several decades. In fact, based on historical research, the long-term commodity cycle has been in existence since the United States declared its independence from England in the late-1700s. The intermediate-term cycle was discovered in the early 1900s.
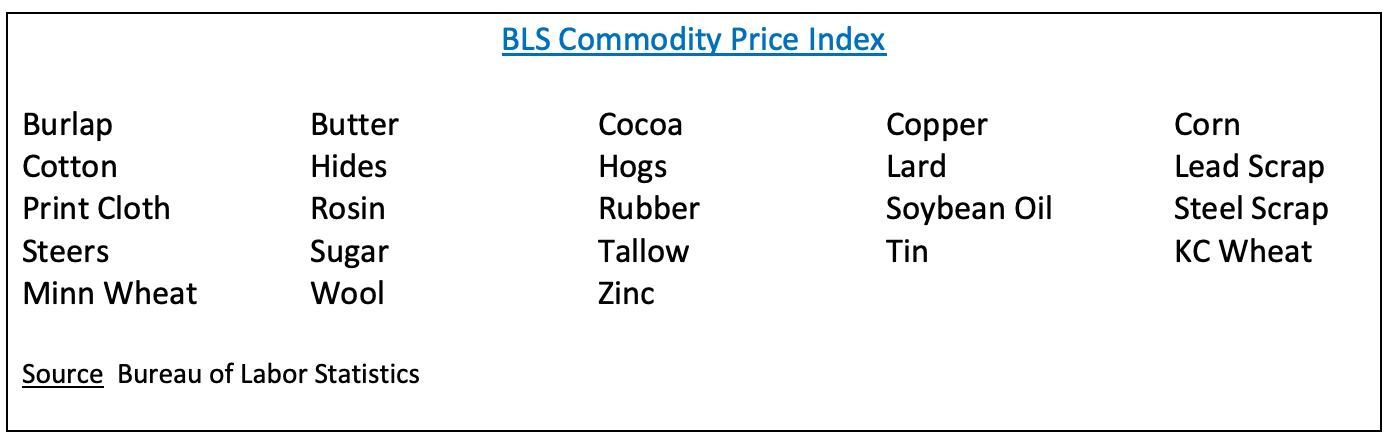
The Bureau of Labor Statistics (BLS) is a governmental statistical agency created in June 1884, for the sole purpose of collecting, processing and analyzing statistical data on behalf of the federal government. In January 1947, BLS developed several commodity indices in an effort to help other federal agencies monitor commodity prices. Please review the following list.
- BLS Commodity Price Index
- BLS Metals Price Index
- BLS Textiles Price Index
- BLS Industrials Price Index
- BLS Foodstuffs Price Index
- BLS Fats and Oil Price Index
- BLS Livestock Price Index
The main index is BLS Commodity Price Index, which contains a total of 23 different commodities.
During the past several decades, many commodity firms and research groups have established various commodity indices for the purpose of measuring consumer prices and the effect it has on their spending habits. For many years, the Commodity Research Bureau (CRB) Index was considered the “gold standard” of commodity indices. The index has been calculated on a daily basis since 1934. For the first few decades of its existence, CRB was the only major global commodity index. However, several other companies began offering their own proprietary index following the huge commodity bull market of the early-1970s. The list included: Reuters, Bloomberg, Knight Ridder, Investor’s Business Daily (IBD) and Goldman Sachs.
As we mentioned, the CRB Index has been calculated on a daily basis since 1934. However, CRB is no longer considered the leader among commodity indices. During the past two decades, the index has been changed on several different occasions because of new ownership. Each new owner would change the commodities within the index, thus requiring a new calculation. This added a great deal of confusion within the commodity trading industry. Therefore, many investors have simply quit following CRB.
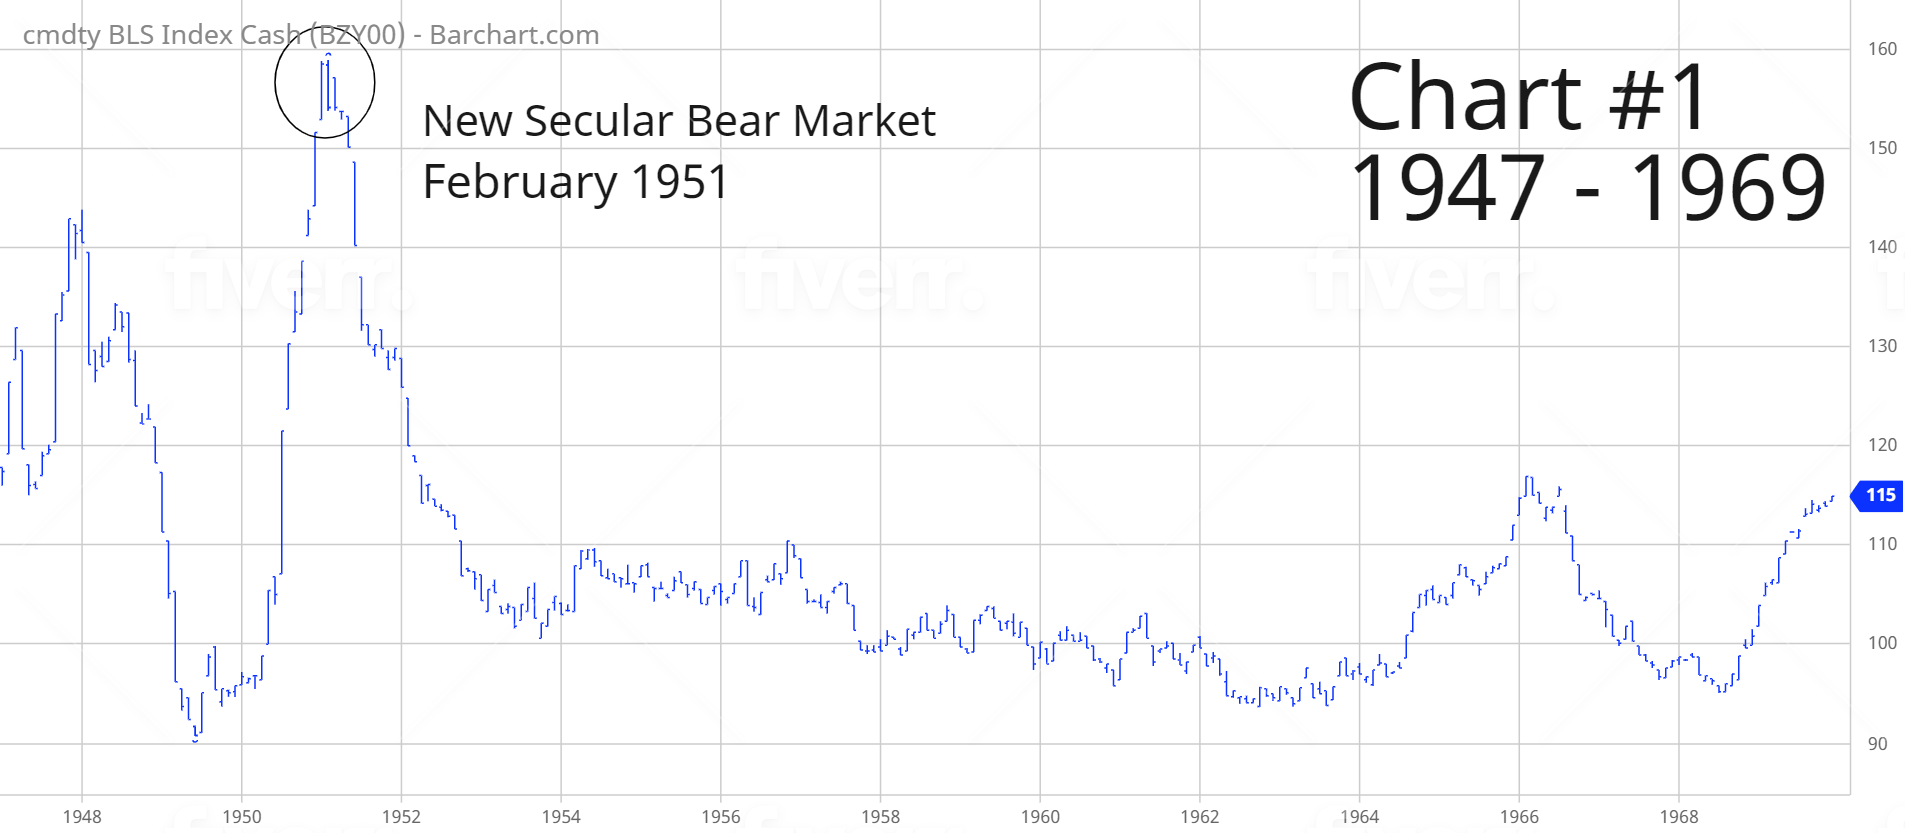
These days, BLS is arguably the most popular commodity index among active commodity traders. The index has been calculated using the same format since 1947. This explains why BLS has steadily increased in popularity. The index was launched at a perfect time because it captured the final phase of the spectacular commodity bull market following the end of World War II (Chart #1). The time period covered is 1947 to 1969. Commodity Prices surged 74.7% from June 1949 through February 1951. Financial historians have concluded that the main catalyst for the rally was pent-up demand as a result of subdued spending during WW II. Demand peaked in February 1951, which ushered in a multi-year commodity bear market.
As you can see from Chart #2, a new secular bull market was unleashed in November 1971. Although prices peaked exactly nine years later in November 1980, the bull market continued until a final “triple top” was formed in March 1989. From beginning to end, the bull market lasted exactly 17 years and 4 months.
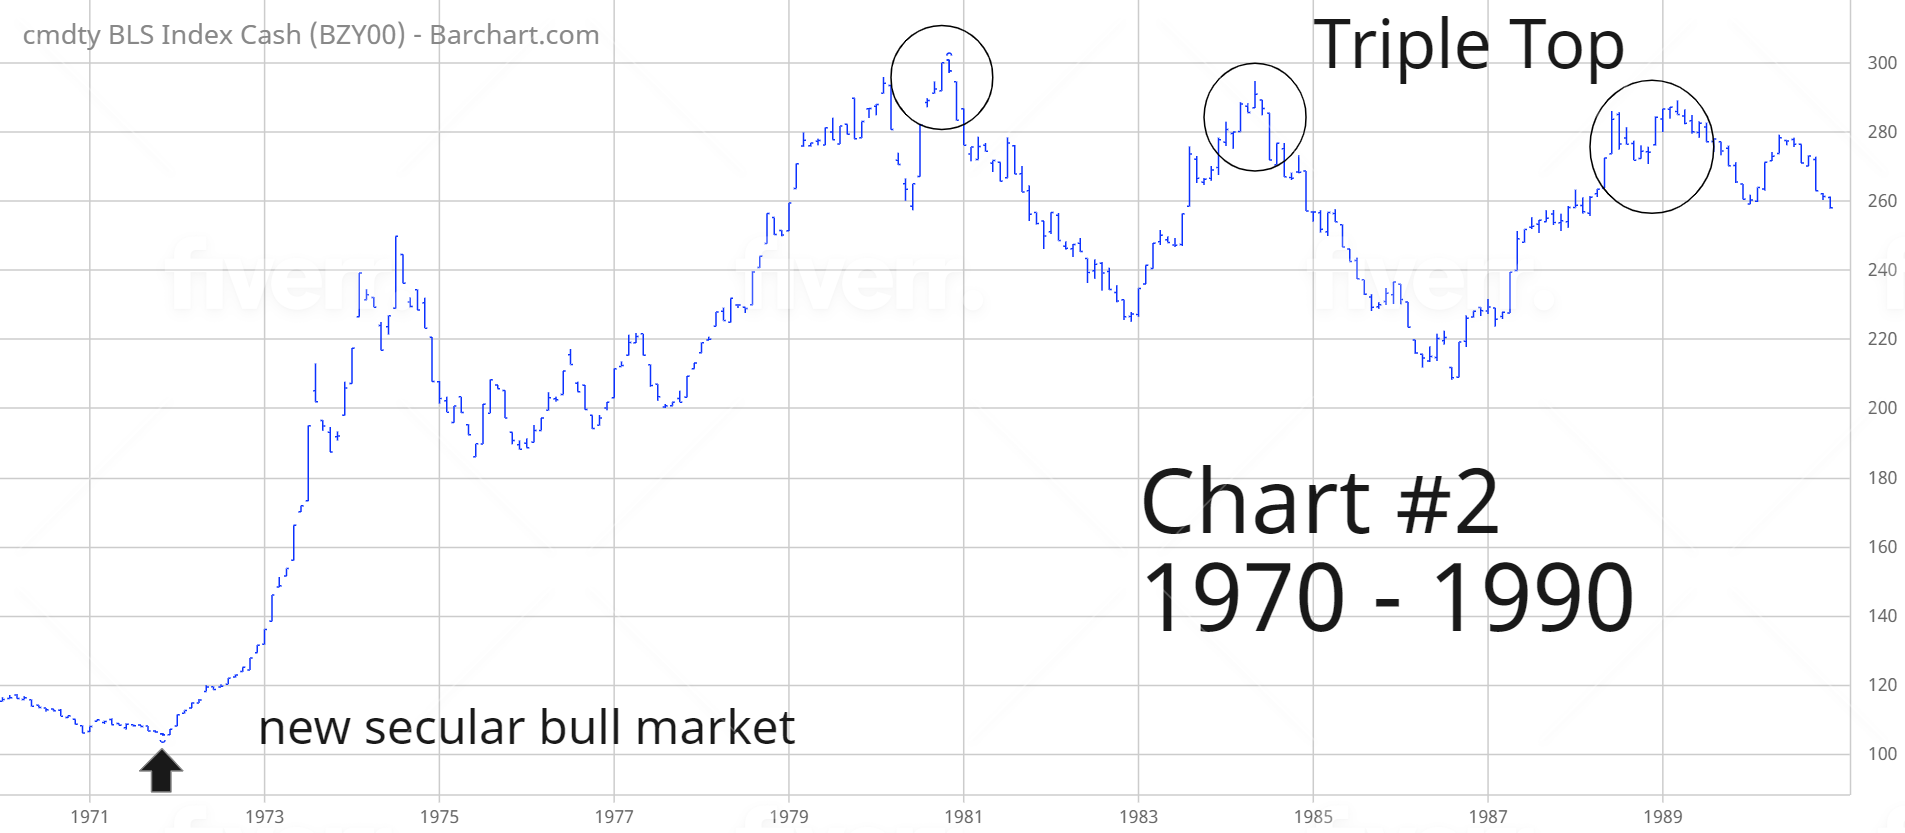
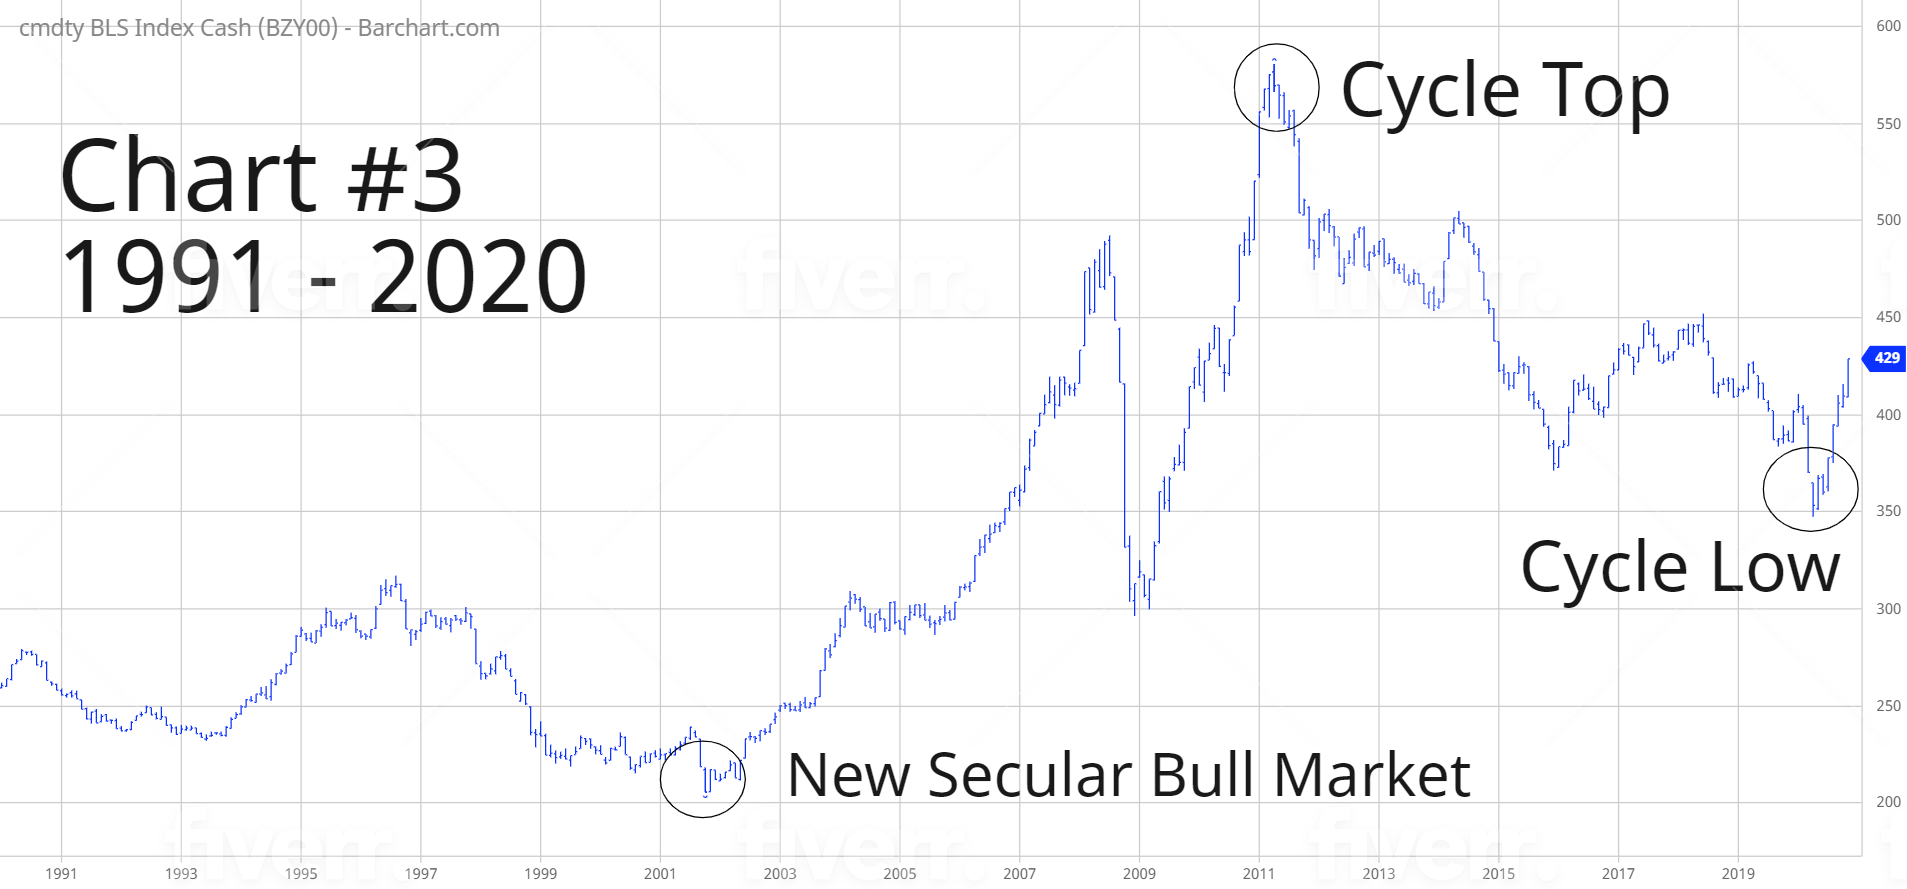
Chart #3 covers the time period from 1991 through 2020. A new secular bull market began in October 2001. If we use the peak from November 1980, this means that the secular bear market lasted 20 years and 11 months. This time period fits perfectly with the official definition of a secular bear market, which is 17 to 30 years. Additionally, the cyclical bear market from April 2011 through April 2020 matches the official time frame for an intermediate-term bear market of 6 to 9 years. Therefore, both cycles are forecasting much higher commodity prices for the remainder of this decade. Most likely, COVID-19 was responsible for marking the end of the cyclical bear market in commodities. It’s quite possible that the COVID vaccine will unleash a dramatic rally in commodity prices beginning in H2 2021.
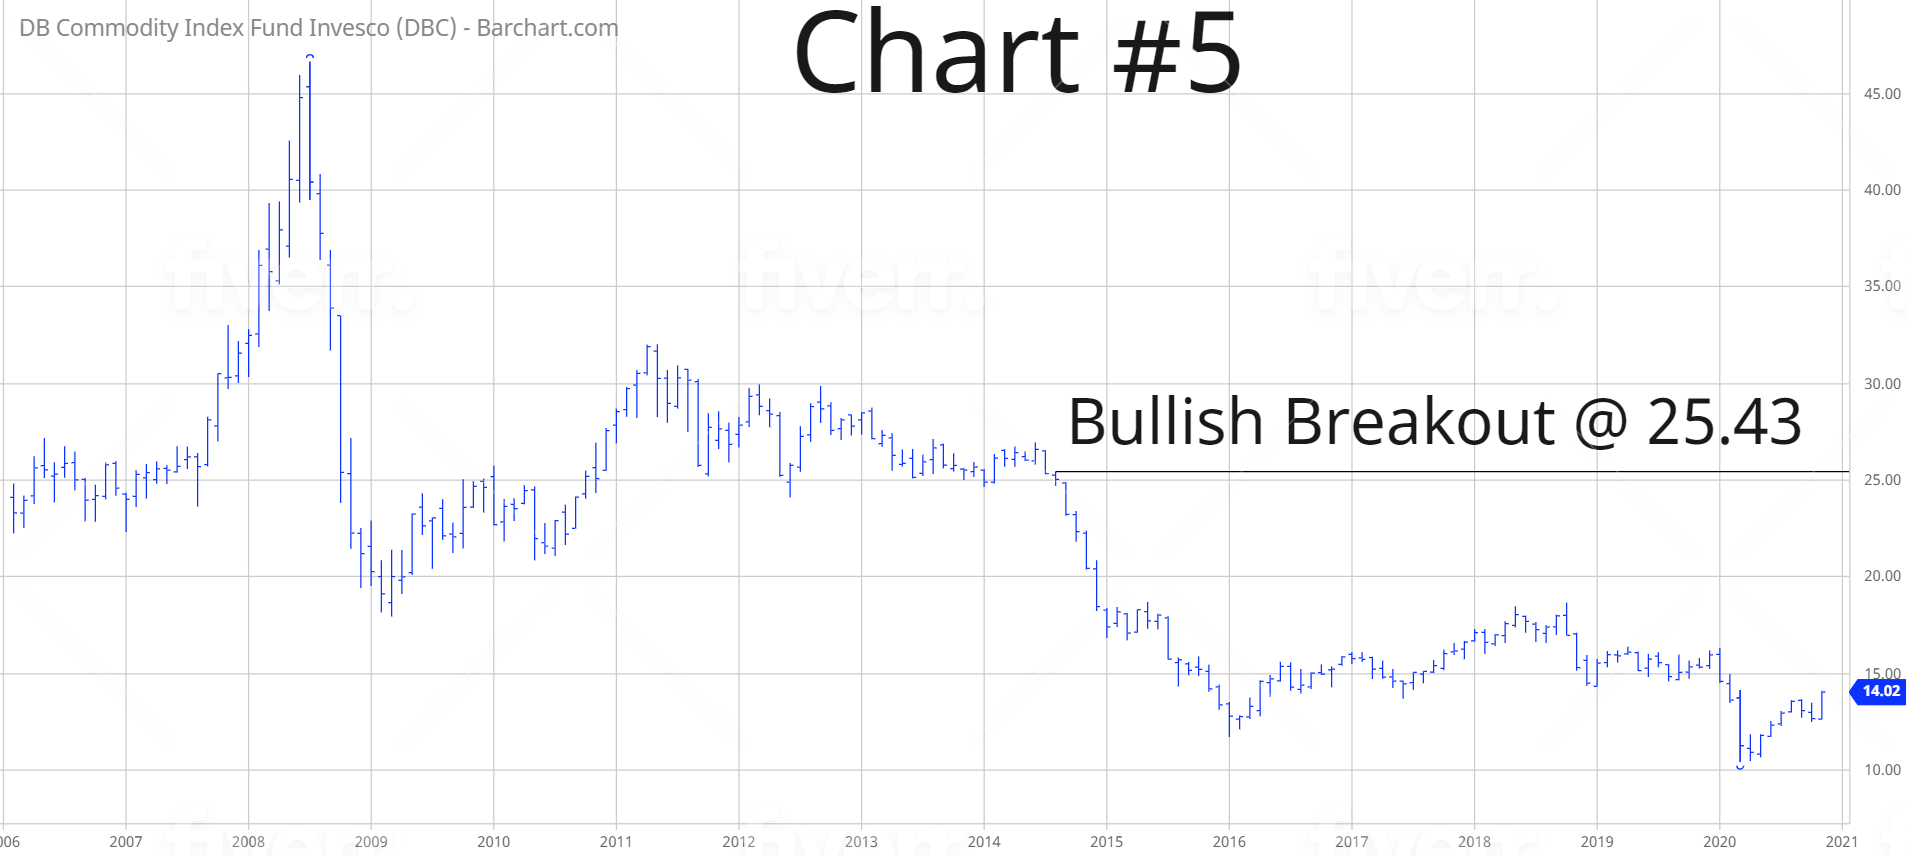
In regard to DBC, the long-term trend remains decidedly bearish. Based on the fact that DBC has a large exposure to energy commodities, a major top was recorded in July 2008, along with the peak in crude oil. In order to reverse the long-term bearish momentum, the bulls need a weekly close above 25.43. It certainly appears as though a major low was established in March 2020 @ 10.41.
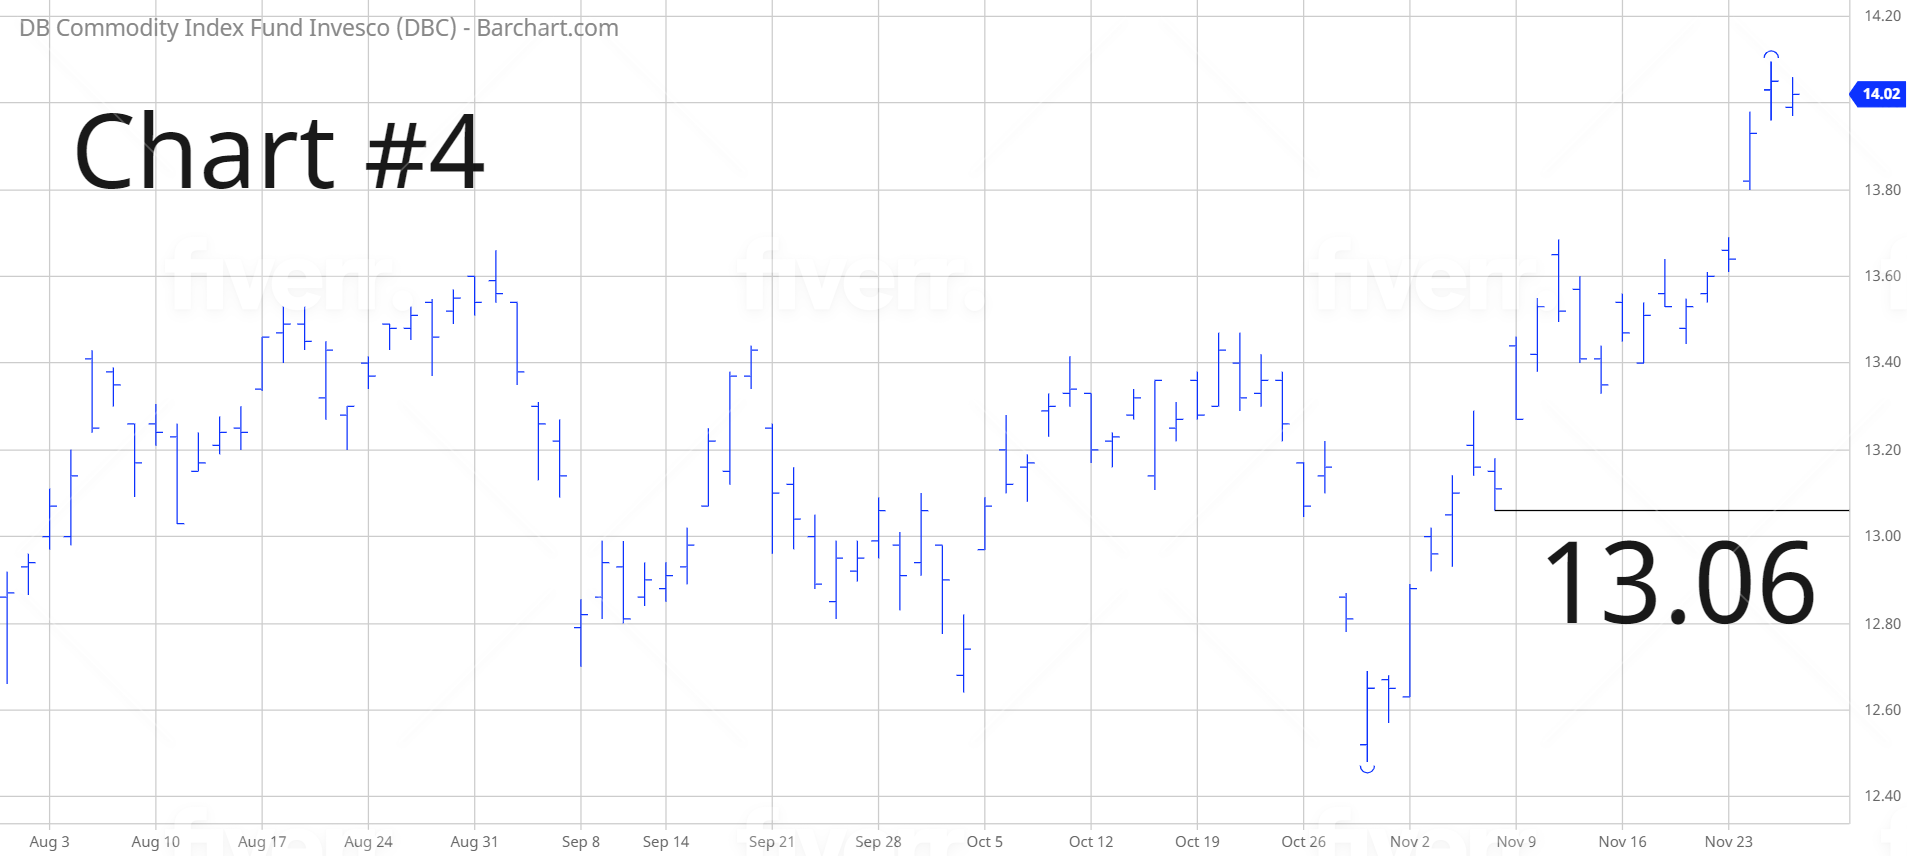
SHORT-TERM TREND – DBC
Please review the 4-month chart of DBC (Chart #4). DBC is hovering in bullish territory on a short-term basis. The next level of resistance is 14.82. The chart pattern will remain bullish as long as DBC stays above 13.06 on a weekly closing basis. The most likely scenario is a continuation of higher prices.
LONG-TERM TREND – DBC
Please review the 15-year chart of DBC (Chart #5). The long-term bullish trend has been bearish for the past several years. However, it does appears that an important low was formed in March 2020 @ 10.41. A weekly close above 25.43 is needed in order to create a bullish chart pattern.