Invesco DB US Dollar Index Bullish Fund ETF DXY
Key Statistics
Minor Support Level 24.17 Minor Resistance Level 25.30
Thank you for reading this post, don't forget to subscribe!Major Support Level 20.84 Major Resistance Level 28.90
Minor Buy Signal 25.43 Minor Sell Signal 24.09
Major Buy Signal 30.53 Major Sell Signal 19.05
BRIEF OVERVIEW – DXY ETF
Without question, one of the most important indicators in determining the future direction of stocks, bonds, precious metals and commodities, is the value of the US Dollar. The Dollar plays a huge role throughout the global economy in terms of international trade and capital flows between countries. For better or worse, the US Dollar is the global reserve currency. The vast majority of trade conducted between countries is priced in US Dollars. Consequently, all industrialized countries are influenced by the value of the Dollar.
Many financial experts and foreign currency analysts predict the US Dollar will eventually lose its reserve currency status. Based on the overwhelming popularity of the Dollar among the G20 nations, it’s highly unlikely the greenback will be dethroned as the global reserve currency. In fact, it’s almost impossible for another currency to replace the Dollar as the dominant settlement layer within the current global monetary framework. Why? Because there simply are not enough paper currency notes in circulation outside of the US Dollar. The only other currencies that could even remotely compete against the greenback are the Euro and the Japanese Yen. However, both of these currencies have very little physical notes in circulation. Therefore, it would be logistically impossible for these currencies to replace the US Dollar.
In regard to the ETF universe, the most popular US Dollar ETF is the DB US Dollar Index Bullish Fund, which was launched by the Invesco family of exchange traded funds using the ticker symbol UUP. The date of inception was 20 February 2007. This is an excellent vehicle for investors who are searching for a cost effective way to track the value of the US Dollar relative to other global currencies. Specifically, UUP invests in a basket of six currencies. The list includes Euro FX, Japanese Yen, British Pound, Canadian Dollar, Swedish Krona and Swiss Franc.
SHORT-TERM VIEW – DXY
UUP enjoyed a substantial rally following the initial outbreak of the global pandemic in March 2020. However, the ETF surrendered the majority of its gains over the remainder of 2020. Despite an impressive rally in Q1 2021, the bears are in control of the short-term momentum. The next level of support is 24.17. In order to recapture the momentum, the bulls need a weekly close above 25.30.
Based on the Aroon Oscillator, UUP has an oversold reading of -80. The Aroon Oscillator is programmed differently than most stochastic indicators. The oscillator fluctuates between
-100 and +100. A reading of 0 would indicate a neutral position. Therefore, a reading of -80 with UUP is considered extremely oversold. A substantial short-term rally is quite possible.
LONG-TERM VIEW – DXY
The US Dollar holds the “key” to determining the long-term direction of most asset classes. The list includes commodities, precious metals, bonds, real estate and cryptocurrencies. In fact, a strong argument could be made that the US Dollar influences the stock market more than most investors are willing to admit. This is especially true over the course of the past 20 years, as more companies have migrated from a domestic platform to a multi-national platform.
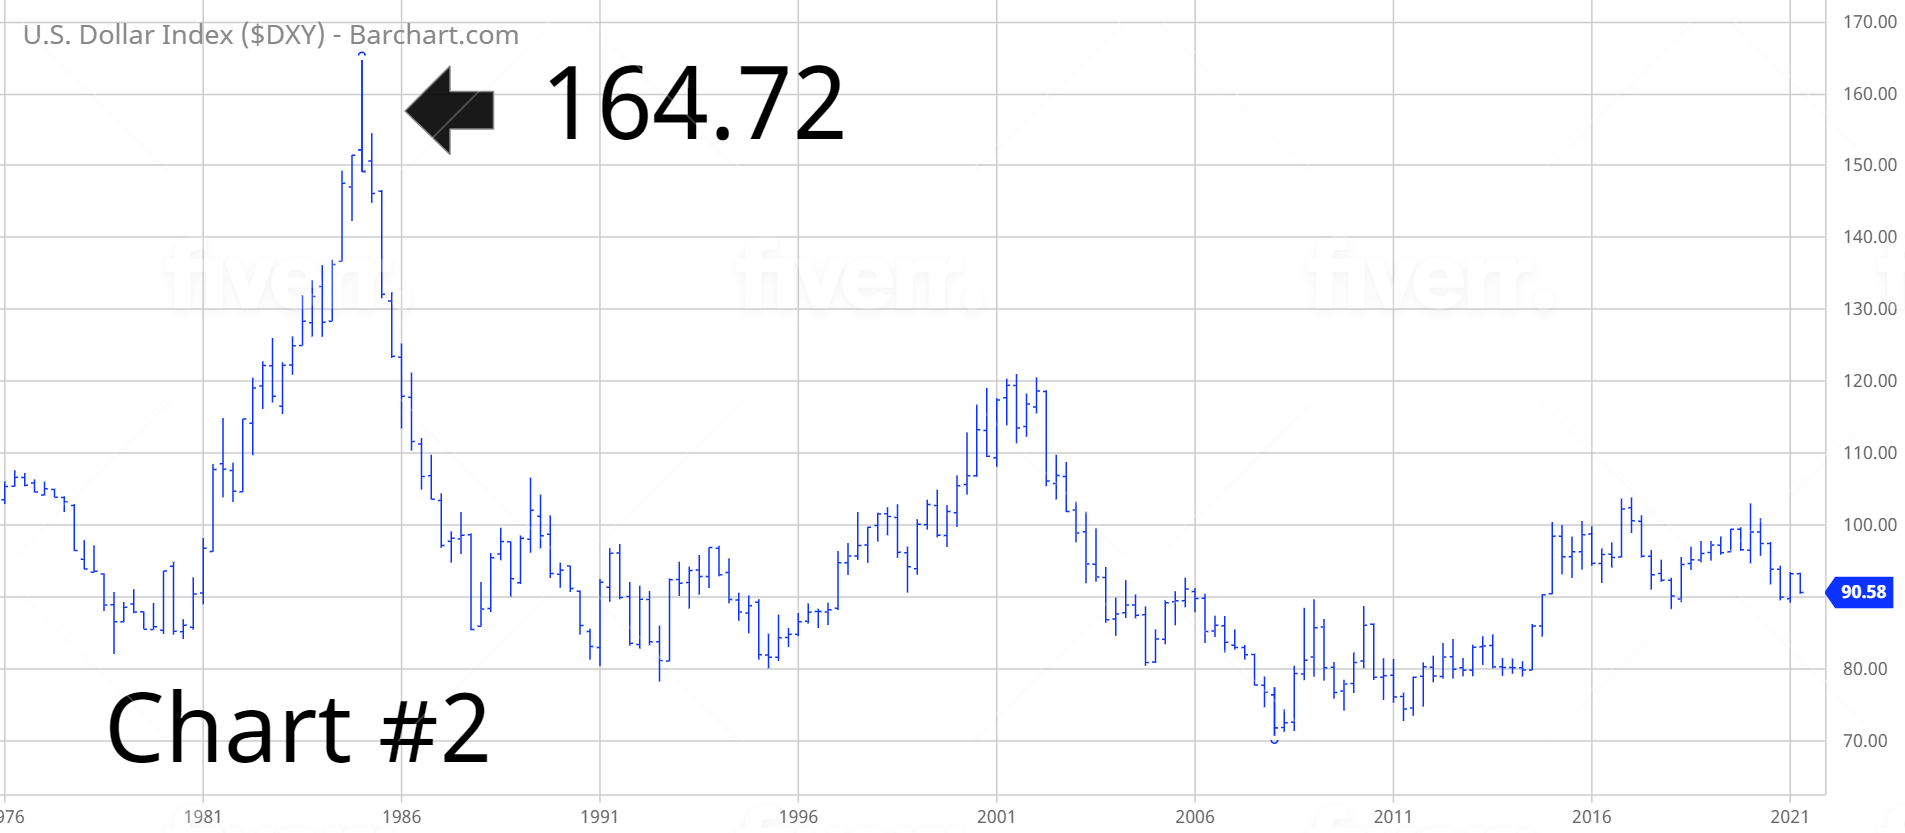
The US Dollar has remained locked in a trading range during the past 6 ½ years (Chart #1). From a longer-term perspective, the Dollar has clearly been in a secular bear market since 2001. As you can see from Chart #2, the Dollar Index (DXY) formed a massive top in Q1 1985 @ 164.72. During the past 35 years, the index has never approached its level from 1985. Not even close. Essentially, the Dollar has been drifting sideways-to-lower for almost four decades.

The multi-year weakness in the Dollar partially explains the record breaking advance in the stock market since the mid-1980s. The weak Dollar also allowed the commodity universe to enjoy its most historic bull market advance of the past 100 years from 2001 through 2011. Additionally, gold recorded an increase of 654% during the first decade of the 2000s as the Dollar was drifting lower. In addition to stocks, commodities and precious metals, real estate experienced an unprecedented bull market advance. Since 1985, the median home price in the US has generated an average annual increase of 8.4%. The newest asset class, cryptocurrencies, have also benefitted from the bear market in the US Dollar.
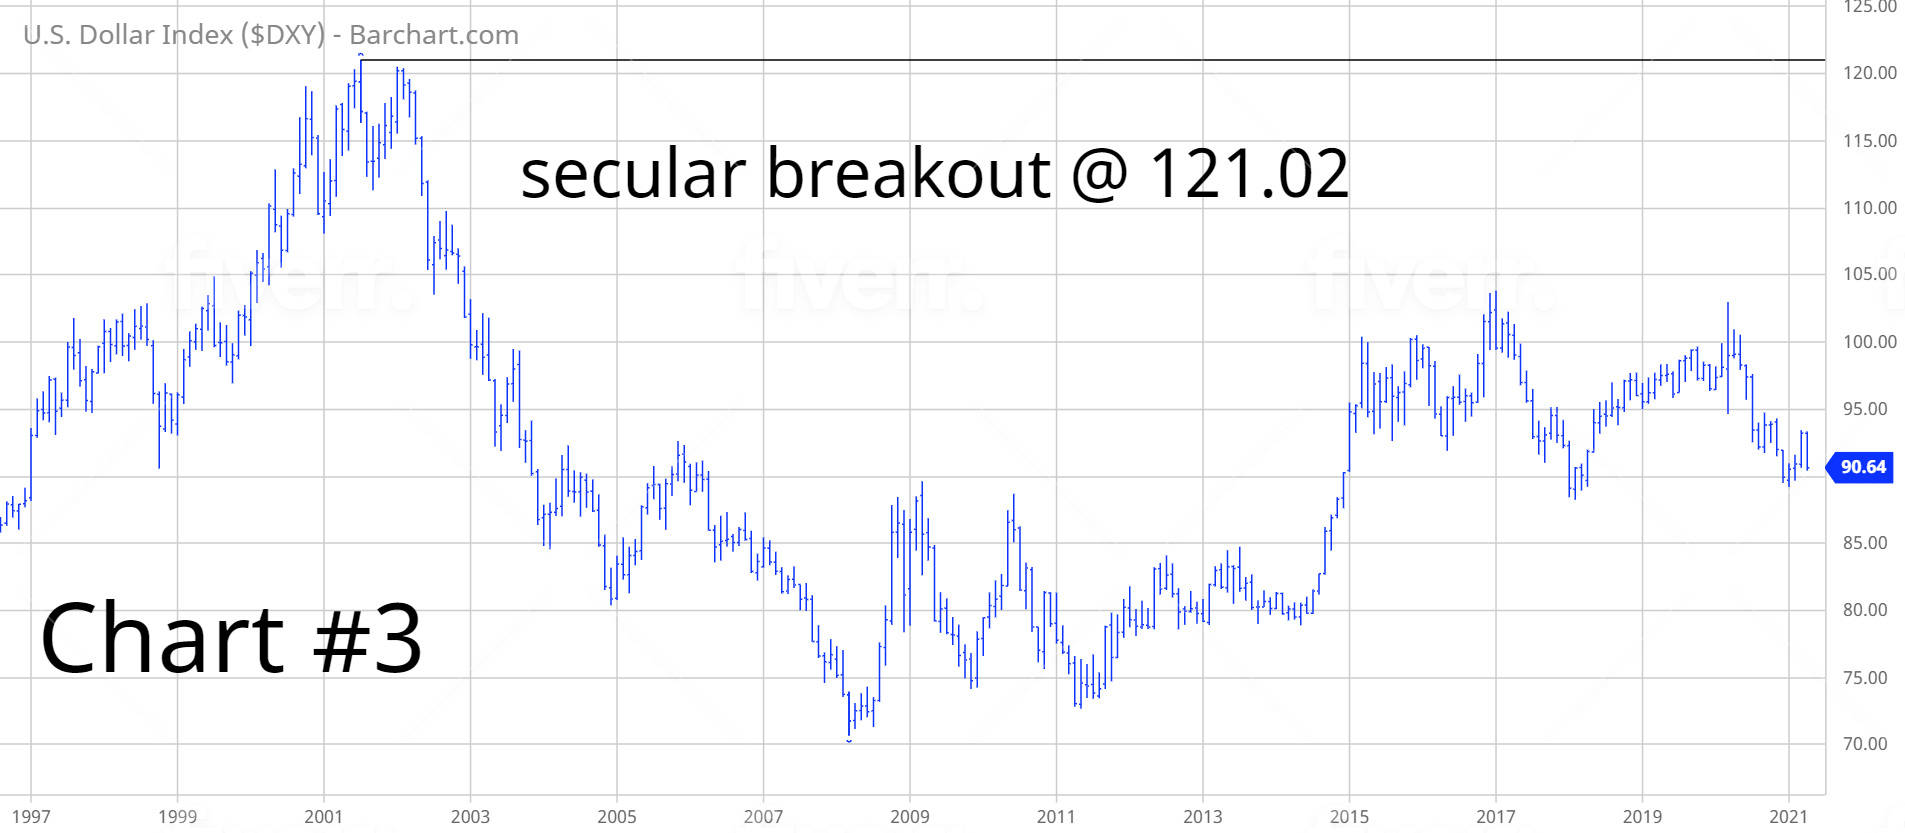
In terms of the US Dollar, where do we go from here? As we discussed, the Dollar has been in a secular bear market for the better part of four decades. Currently, there’s no indication that the greenback is on the verge of launching into a new long-term bull market. In order to reverse the secular trend, DXY must generate a weekly close above 121.02 (Chart #3). This type of price advance is certainly possible but not likely. Instead, the most likely scenario is that the US Dollar remains in a secular bear market. This means that DXY will trade sideways-to-lower for the next several years. If this forecast is correct, investors can expect higher prices in stocks, commodities, precious metals, real estate and cryptocurrencies.
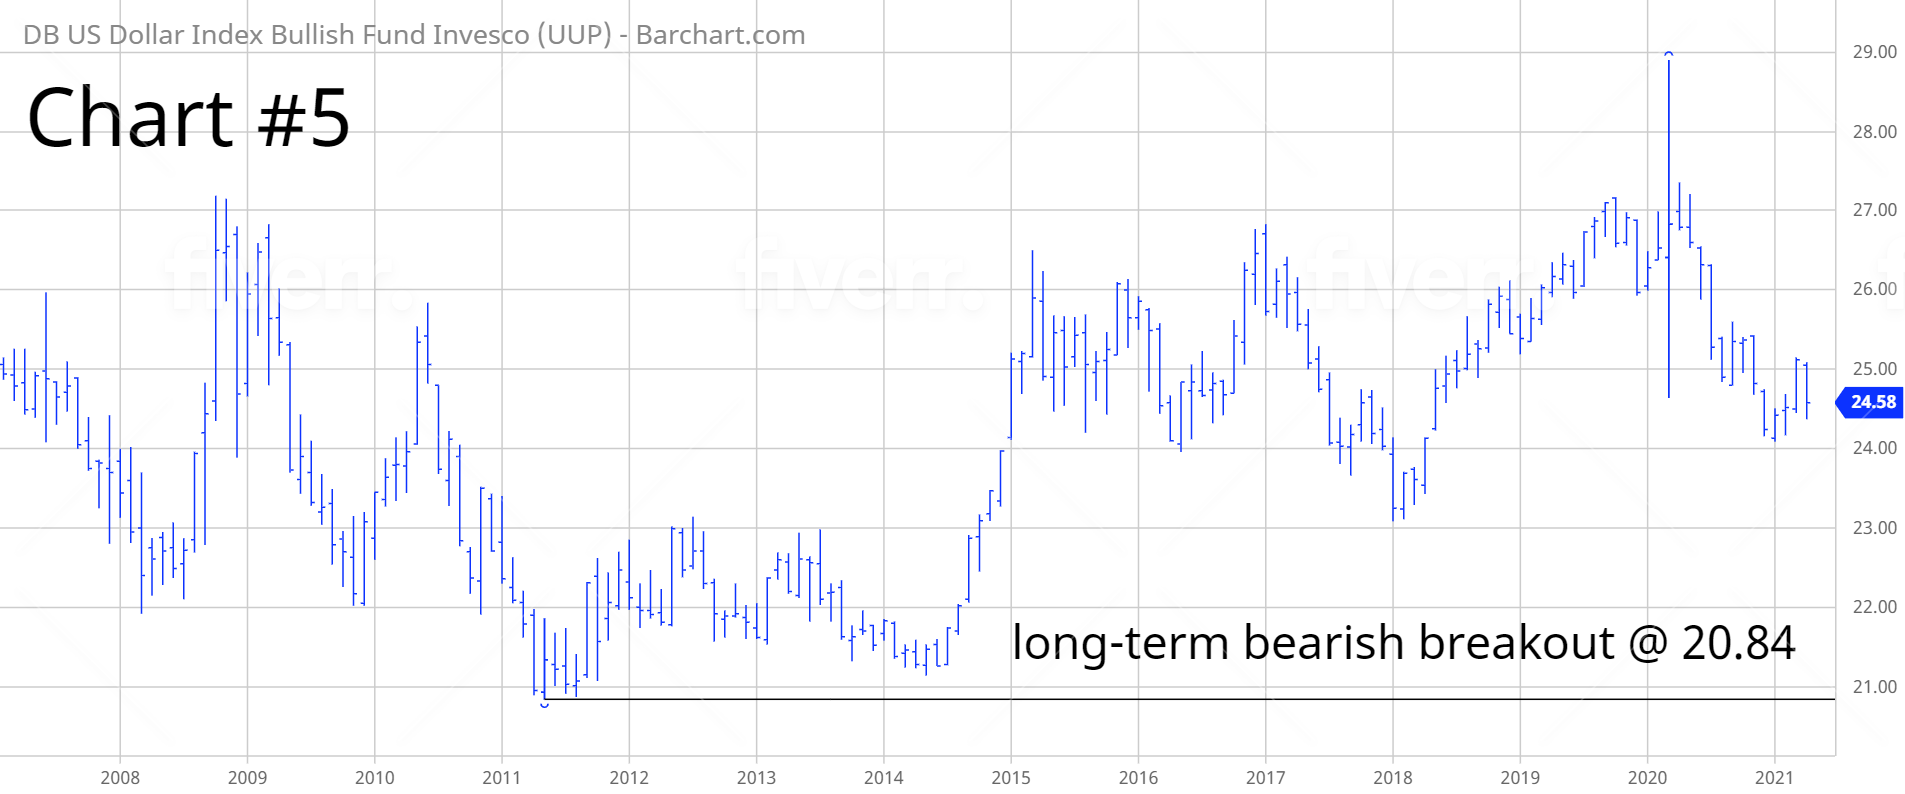
In regard to UUP, the long-term trend is neutral. The ETF is hovering in the middle of its 13-year trading range. The important numbers to watch are 20.84 and 28.90.
SHORT-TERM CHART – DXY
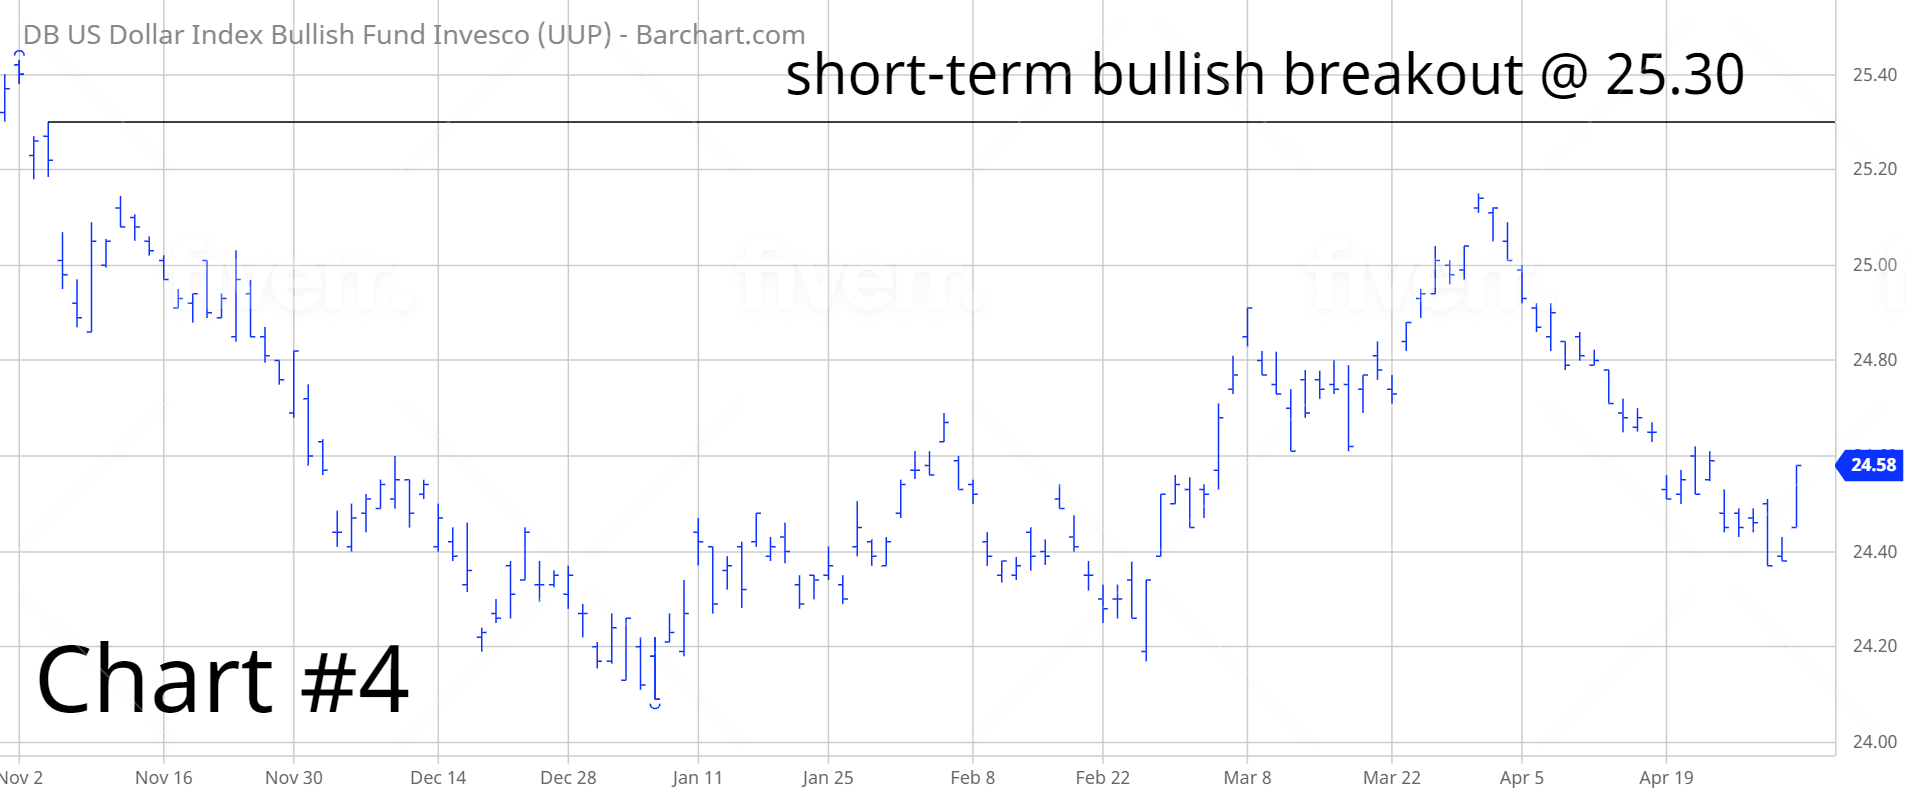
Please review the 6-month chart of UUP (Chart #4). Despite the strong rally following the global pandemic in March 2020, the short-term chart pattern is bearish. The next level of support is 24.17. In order to reverse the chart pattern, the bulls, a weekly close above 25.30. Most likely, UUP will drift sideways-to-lower for the next several weeks.
LONG-TERM CHART – DXY
Please review the 14-year chart of UUP (Chart #5). This chart covers the entire trading history of the ETF. The long-term chart pattern is neutral. UUP spiked to a new all-time high in March 2020, following the outbreak of the coronavirus. However, all of the gains have disappeared during the past 12 months. The most likely scenario is a bearish breakout below 20.84.