iShares Russell 3000 ETF (IWV) Key Statistics
Thank you for reading this post, don't forget to subscribe!
Minor Support Level 156.37 Minor Resistance Level 188.81
Major Support Level 100.00 Major Resistance Level 207.44
Minor Buy Signal 194.97 Minor Sell Signal 151.91
Major Buy Signal 221.84 Major Sell Signal 86.01
BRIEF OVERVIEW – IWV ETF
In regard to stock market indices, most investors are familiar with Dow Jones Industrial Average (DJIA), S&P 500 and NASDAQ. In fact, DJIA is easily the most recognizable stock index in the world. DJIA is constantly quoted throughout each trading day of the year. However, in addition to DJIA, S&P 500 and NASDAQ, there are two domestic stock indices which are rarely discussed beyond the inner circles of Wall Street. It’s probably a safe guesstimate that over 70% of the investing public has never heard of these indices. Despite their relative obscurity, these two indices are arguably the most complete stock market indices within the investment community. Why? Because they represent a more comprehensive view of the overall stock market in comparison to DJIA, S&P 500 or NASDAQ. Very briefly, let’s review each index.
Russell 3000 index was launched on 1 January 1984 by Russell Investments. Founded in 1936 by Frank Russell, the company became one of the largest investment advisors in the United States. Russell Investments was a rather unique firm based on the fact that the company preferred to fly under the radar screen and avoid the Wall Street spotlight. The firm was located in Tacoma, Washington, about as far removed from Wall Street as possible. However, that certainly did not prevent the company from growing. With the help of his children and grandchildren, Frank grew Russell Investments into one of the ten largest advisors in North America.
In 1998, the company was sold to Northwestern Mutual for an incredible $1.2 billion. Over the course of 62 years (1936 – 1998), the Russell family grew the company from a one-room stock brokerage firm to a Wall Street juggernaut (even though the firm was never located on Wall Street). Even more impressive was the fact that the vast majority of the growth was internal growth. Frank Russell and his family rarely made any acquisitions. Instead, they grew the old fashioned way, one new customer at a time.
Despite the fact that Northwestern Mutual was the new owner, the only major change that occurred was the firm’s relocation to Seattle. In terms of day-to-day operations, Northwestern Mutual allowed Russell Investments to continue servicing its existing clients and solicit new clients. Assets under management continued to increase. In fact, other investment companies were so impressed with Russell’s growth strategy, Northwestern Mutual found itself receiving several offers to sell the Seattle-based company. In 2014, Northwestern Mutual accepted an offer from the London Stock Exchange for $2.7 billion.
Today, Russell Investments has $300 billion of assets under management and $2.6 trillion of assets under advisement across 32 countries. The firm is the world’s fourth largest advisor.
In May 2015, London Stock Exchange rebranded the Russell 3000 index. Today, the index is known as the FTSE Russell 3000. For those of you who may be curious, FTSE is an acronym for Financial Times Stock Exchange, which is a subsidiary of the London Stock Exchange. The Financial Times is a daily business newspaper, very similar to the Wall Street Journal.
The Russell 3000 is a capitalization-weighted index, which means that the individual securities within the index are weighted according to their total market capitalization. What is market capitalization? It is the total market value of a firm’s outstanding shares. The calculation involves multiplying the outstanding shares by the current price of a single share. Of course, this calculation method favors the securities with a higher market cap. Critics argue that the performance of the index is unfairly influenced by large cap companies. This is probably a valid argument. Despite this flaw, the vast majority of stock indices are capitalization-weighted.
Wilshire 5000 index was launched on 17 December 1974 by Wilshire & Associates, an independent investment management firm located in Santa Monica, CA. The name of the index is slightly misleading based on the fact that the index does not contain 5,000 companies. Initially, the index did consist of exactly 5,000 listed companies in December 1974. However, due to mergers, acquisitions, IPOs and bankruptcy liquidations, the number of companies within the index has fluctuated over the years. At its peak on 31 July 1998, the Wilshire 5000 included 7,562 listings. Following the 2008 global financial crisis, several mergers and reorganizations occurred. Consequently, the number of listed companies began to decline. Today, the number of stocks listed on the Wilshire index is less than 3,500.
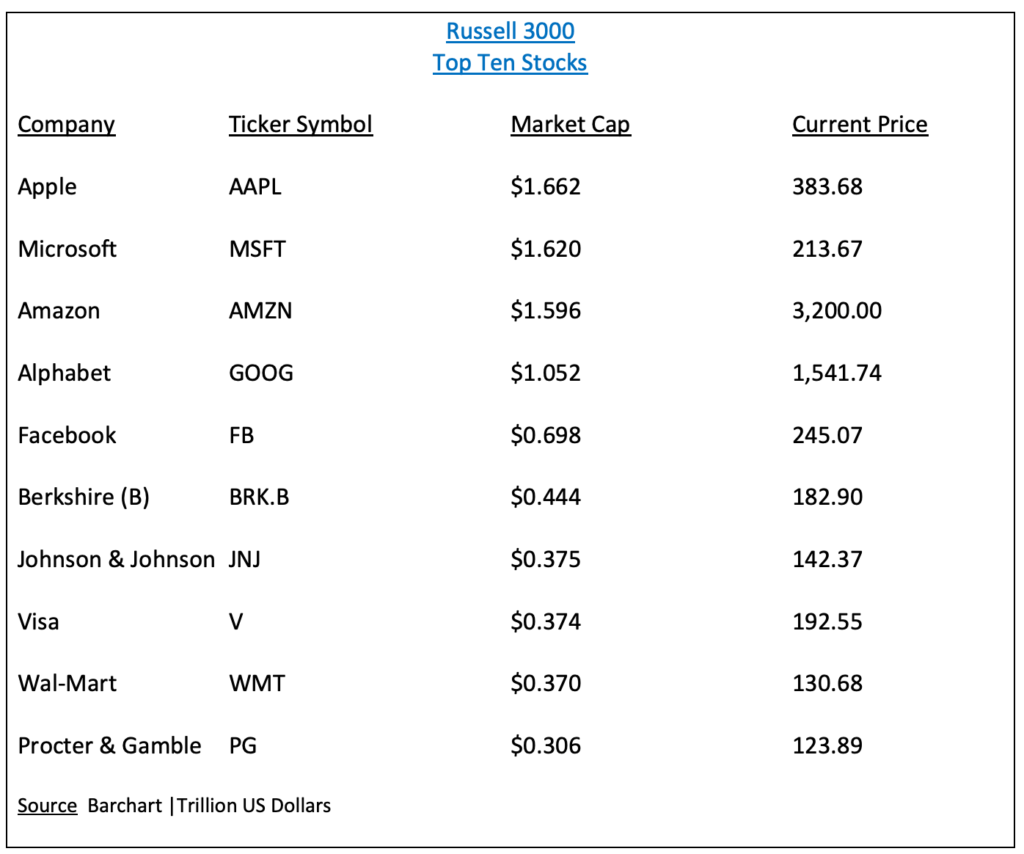
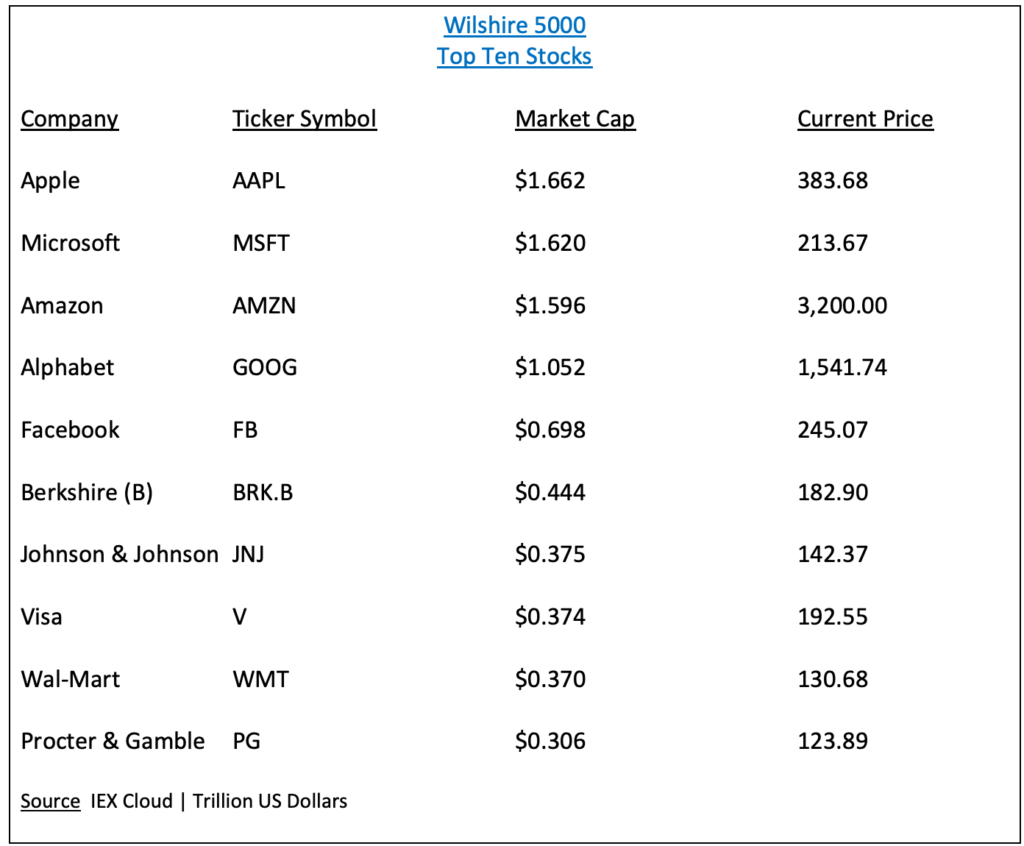
The Wilshire index is very similar to the Russell index based on the fact that both indices are capitalization-weighted. The largest companies within the index are the most influential in terms of index valuation. Please review the list of the top ten stocks in the Wilshire 5000 index.
As you can see from the table, the top ten list is identical to the Russell 3000. This should not be a great surprise because both indices are essentially designed to track the majority of all stocks listed on the NYSE and NASDAQ.
In an effort to provide investors with exposure to a diverse basket of stocks, the iShares family of exchange traded funds (managed by BlackRock) introduced the Russell 3000 ETF using the ticker symbol IWV. The launch date was 22 May 2000. IWV is designed to track the performance of the Russell 3000, which is an index comprised of the largest publicly traded companies incorporated in the United States. The top five holdings include Apple, Microsoft, Amazon, Alphabet and Facebook.
SHORT-TERM VIEW – IWV ETF
IWV has enjoyed a substantial rally following the COVID-19 low on 23 March. The ETF has advanced 46.9% since 23 March. The short-term momentum is in favor of the bulls. The next level of resistance is 188.81. The bears need a weekly close below 156.37 in order to recapture the momentum. The most likely scenario is a continuation of higher prices.
Based on the Aroon Oscillator, IWV has a neutral reading of -20. The Aroon Oscillator is programmed differently than most stochastic indicators. The oscillator fluctuates between
-100 and +100. A reading of 0 would indicate a neutral position. Therefore, a reading of -20 is considered neutral. Why is the oscillator in neutral territory even though IWV has generated a substantial rally? Because the majority of the rally occurred in April and May. During the past six weeks, the ETF has essentially traded sideways. This has allowed the Aaron Oscillator to drift back into neutral territory. Ironically, this is quite bullish for IWV because the market is now prepared to launch another sustainable bull move.
LONG-TERM VIEW – IWV ETF
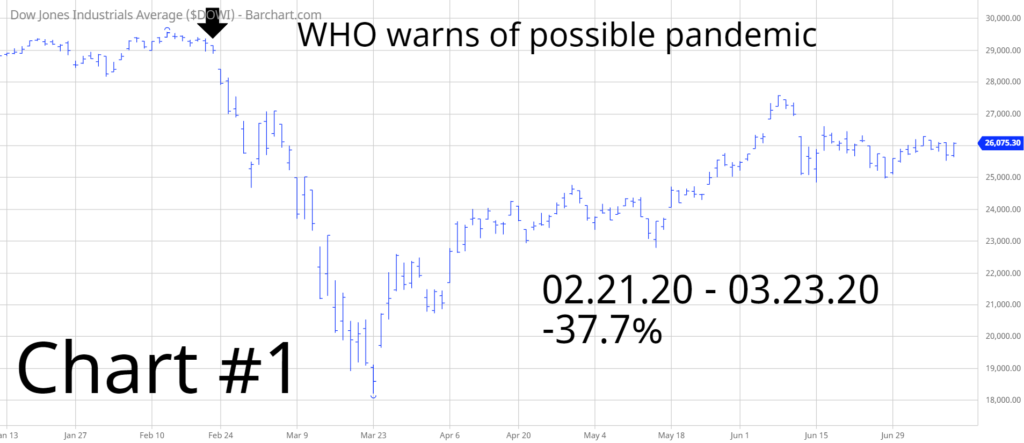
The stock market continues to frustrate the perma-bears. These long-term stock market bears were giddy with excitement when Wall Street officially became concerned about COVID-19 on 21 February, when WHO announced that the coronavirus would probably turn into a global pandemic. The stock market proceeded to drop 37.7% over the course of the next five weeks (Chart #1). The bears were convinced that this was the beginning of a multi-year decline. Of course, they were completely wrong. Stocks have been grinding higher for the past 3 ½ months. The long-term bull market is still firmly in place.
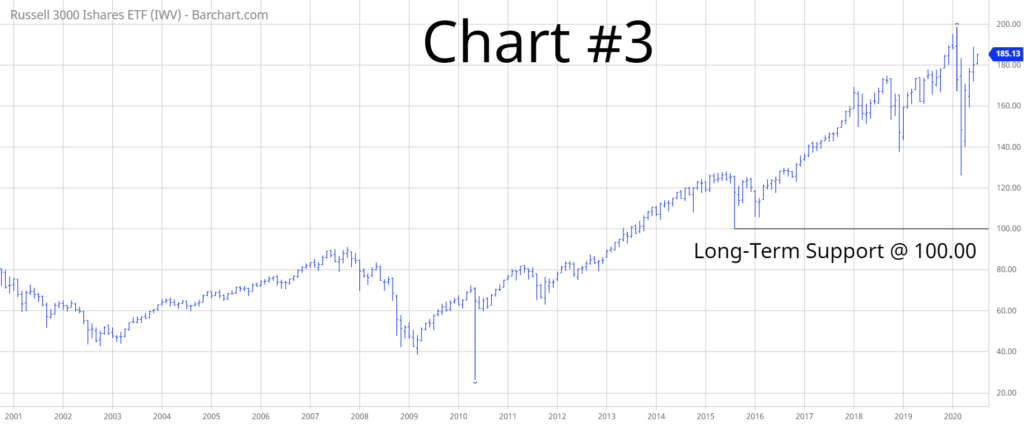
In regard to IWV, the bulls are in complete control. Despite the brutal decline in February and March, the secular bull market has remained intact. The bears need a weekly close below 100.00 in order to derail the bull market. This type of decline is highly unlikely as long as global central banks continue to print unlimited sums of money.
SHORT-TERM CHART
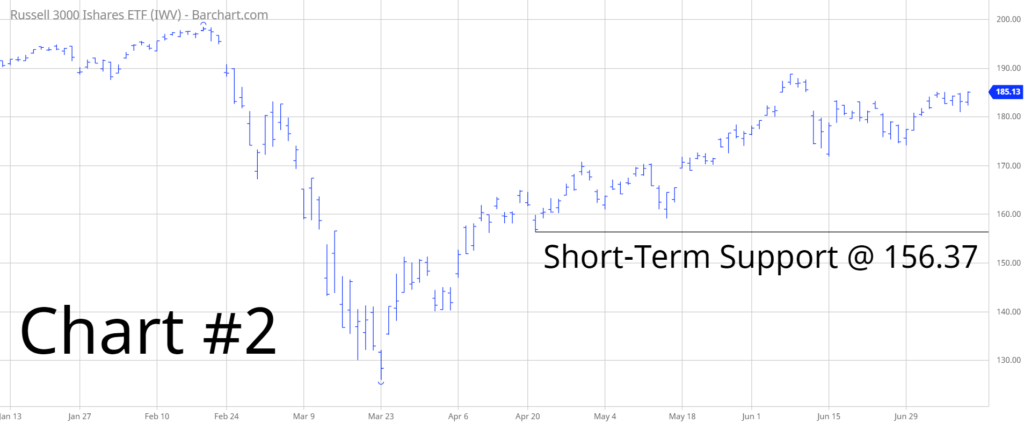
Please review the 6-month chart of IWV (Chart #2). The ETF has advanced 46.9% since 23 March. The short-term chart pattern is clearly in favor of the bulls. The next level of resistance is 188.81. A weekly close below 156.37 is needed in order to recapture the bearish trend. The most likely scenario is a continuation of higher prices.
LONG-TERM CHART
Please review the 20-year chart of IWV (Chart #3). The ETF has experienced a few brutal declines during the past two decades. Despite these nasty sell-offs, the long-term chart pattern continues to remain bullish. A weekly close below 100.00 will flip the chart pattern from bullish to bearish (highly unlikely).

