

SPDR Dow Jones Industrial Average ETF (DIA)
Key Statistics – Down Jones ETF – DIA
Thank you for reading this post, don't forget to subscribe!Minor Support Level 233.20 Minor Resistance Level 263.16
Major Support Level 80.96 Major Resistance Level 284.63
Minor Buy Signal 265.93 Minor Sell Signal 230.52
Major Buy Signal 298.65 Major Sell Signal 64.78
BRIEF OVERVIEW – Down Jones ETF – DIA
By far, the most popular stock market index is the Dow Jones Industrial Average (DJIA). When people discuss the stock market, 99% of the time they are referring to DJIA. Why is this stock market index so popular and, more importantly, what is the future price direction of the Dow Jones Industrial Average? In order to answer these questions, let’s take a brief journey through the history of this celebrated stock index.
The Dow Jones Industrial Average (colloquially known as “the Dow”) was created by Charles Dow and his business associate, Edward Jones. The launch date was May 26, 1896. The first official closing price of the index was 62.76.
During the first 32 years of its existence, the Dow consisted of only 12 companies. In 1928, the index was expanded to include a total of 30 different companies. Although the companies within the index have changed over the years, the number of stocks that comprise the Dow has held steady at 30 since October 1, 1928.
Original 12 Companies of DJIA
May 26, 1896
American Cotton Company American Sugar Company American Tobacco Company
Chicago Gas Company Distilling & Cattle Feeding Co General Electric
Laclede Gas Company National Lead Company North American Company
Tennessee Coal & Railroad Co US Leather Company US Rubber Company
Original 30 Companies of DJIA
October 1, 1928
Allied Chemical American Can American Smelting
American Sugar American Tobacco Atlantic Refining
Bethlehem Steel Chrysler General Electric
General Motors General Railway Signal Goodrich
International Harvester International Nickel Mack Truck
Nash Motors North American Co Paramount Publix
Postum Inc Radio Corporation Sears Roebuck & Company
Standard Oil Texas Company Texas Gulf Sulphur
Union Carbide US Steel Victor Talking Machine Co
Westinghouse Electric Woolworth Wright Aeronautical
Dow Jones Industrial Average
May 7th, 2018
3M American Express Apple
Boeing Caterpillar Chevron
Cisco Cocoa-Cola Disney
DowDuPont Exxon Mobile General Electric
Goldman Sachs Home Depot IBM
Intel Johnson & Johnson JPMorgan Chase
McDonald’s Merck Microsoft
Nike Pfizer Procter & Gamble
Travelers Companies Inc United Technologies UnitedHealth Group
Verizon Visa Wal-Mart
As you can see from the list, General Electric (GE) is the only company still remaining from the original Dow Jones Industrial Average. GE has been continuously listed on DJIA since its inception on May 26, 1896.
It’s quite remarkable how the companies have changed over the years. For example, in 1928, the index was 100% comprised of industrial companies. There were no financial services companies or technology companies on the list. These days, 37% of the Dow 30 stocks are either financial services or technology based. Only seven companies are considered “true” industrial companies (3M, Boeing, Caterpillar, Chevron, DowDuPont, Exxon Mobile and General Electric).
Many financial historians claim that S&P Global (the current owner of the Dow Jones Industrial Average) has done a poor job of maintaining the “true identity” of the index. They argue that Charles Dow and Edward Jones created the index in an effort to track the health of our nation’s industrial sector. However, during the past few decades, DJIA has abandoned its “roots” in favor of a more modern index based on technology and giant money center banks.
To a certain extent, this argument is correct. DJIA has certainly evolved over the years. However, the US economy has also evolved during the past several decades. The United States is no longer an industrial based economy. Instead, our nation’s economy has slowly transitioned into a more mature and diversified economic engine of growth. S&P Global is simply trying to reflect these changes by periodically adjusting the companies within DJIA.
The majority of financial experts would most likely agree that S&P Global has done a splendid job of making occasional changes to DJIA, while at the same time maintaining some of the index’s original industrial base. Going forward, it’s safe to assume that DJIA will continue to be modified over the years, which is probably a good thing.
The SPDR family of exchange traded funds (underwritten by State Street Global Advisors) introduced the Dow Jones Industrial Average ETF on January 14, 1998. The ticker symbol is DIA. This ETF is a perfect vehicle for investors who wish to participate in the performance of DJIA. DIA is an extremely popular ETF, with an average daily volume of nearly six million shares.
SHORT-TERM VIEW – Down Jones ETF – DIA
DIA has been drifting lower for the past three months. The bears have the upper hand in regard to the short-term momentum. The next level of support is 233.20. A weekly close below 233.20 opens the door to much lower prices.
Throughout all of 2017, the bulls were in complete control of DIA. However, the ETF began to rollover to the downside in late-January. In order to recapture the short-term momentum, the bulls need a weekly close above 263.16. At least for now, it appears the most likely scenario is a sideways trading range, with a slight bias to the downside.
LONG-TERM VIEW – Down Jones ETF – DIA
The Dow Jones Industrial Average has enjoyed a dramatic rally during the past nine years. In fact, DJIA is on the verge of recording its longest uninterrupted bull market of all-time. If the index can stay above 21929 until September 9th, a new record will be established.
Despite the Dow’s impressive performance, very few investors have participated in this bull market. This has been one of the most hated bull markets in several decades. The vast majority of financial experts and individual investors have remained overwhelmingly bearish throughout this entire bull run. Of course, this explains why the stock market advance has lasted so long. As long as investor sentiment remains bearish, DJIA will continue to push its was higher.
In an effort to determine the long-term direction of the stock market, let’s review a 20-year chart of the Dow Jones Industrial Average (Chart #1). As you can see from the chart, DJIA essentially traded sideways for 15 years (1997 – 2012). The Dow finally penetrated the trading range by generating a bullish breakout in February 2013.
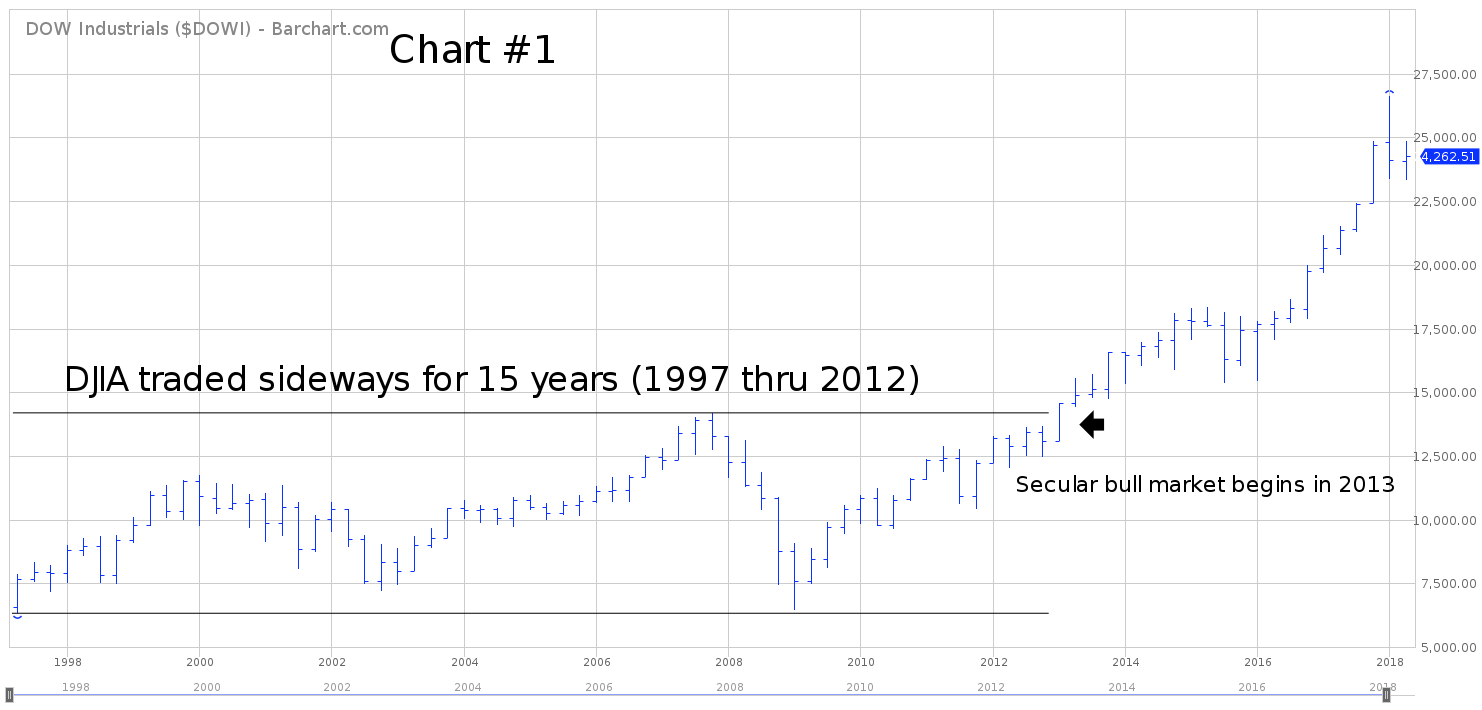
Many stock market cycle experts would conclude that February 2013 marked the beginning of a new multi-year bull market. If this analysis is correct, DJIA is in the early stages of a new powerful thrust to the upside which could easily continue for another 10 to 15 years. The final top should occur in the early 2030s near the 60K level.
Other cycle experts claim DJIA has been in a massive bull market since February 1991, when the Dow finally penetrated its old high from 1987. They argue that the stock market is way overdue for a multi-year bear market. Based on their analysis, DJIA will drift lower for the next two decades (very similar to the Japanese stock market in the 1990s & 2000s).
Which camp is correct, the bullish camp or the bearish camp? As we discussed previously, investor sentiment remains extremely bearish. Therefore, the most likely outcome is a continuation of the bull market. At least for now, it appears rather unlikely that DJIA is in the early stages of a multi-year bear market.
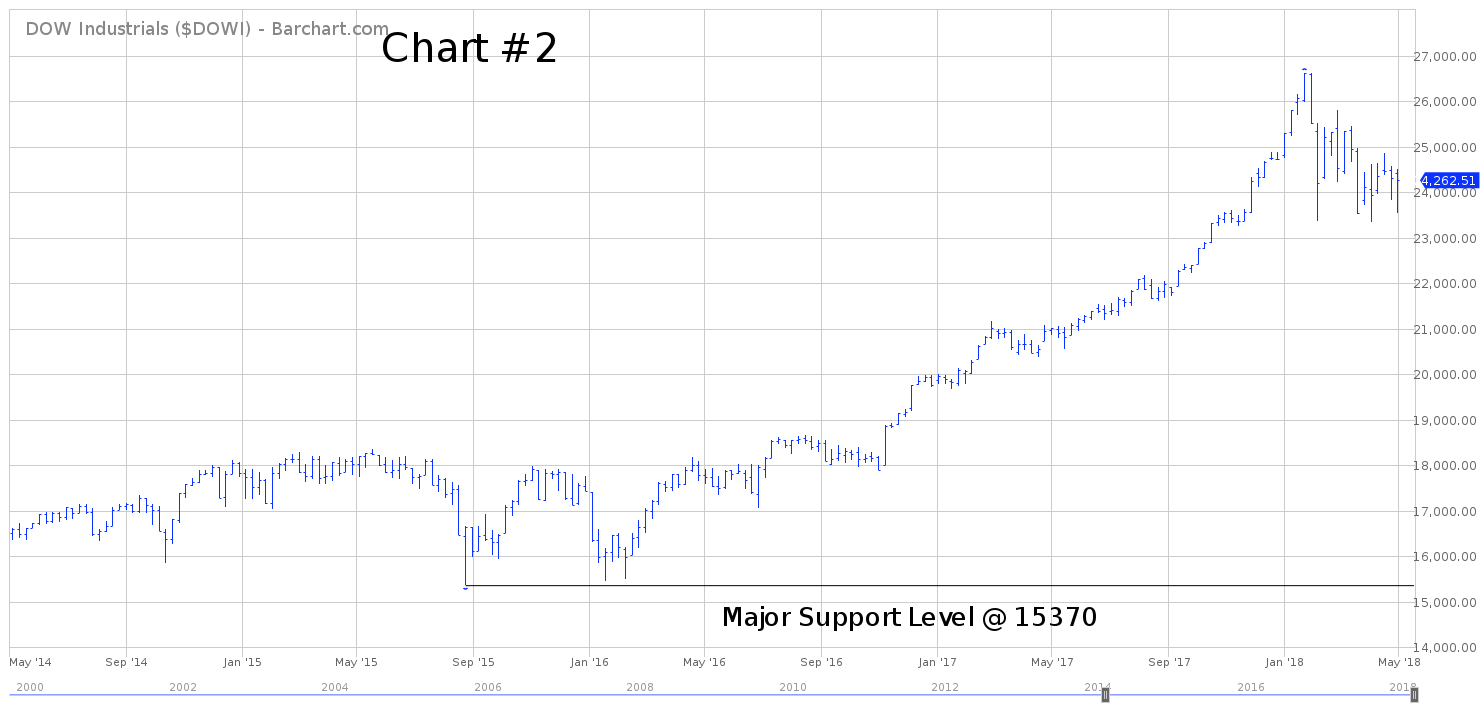
Please review the 4-year chart of DJIA (Chart #2). If the bears can generate a weekly close below 15370, this would definitely mark the beginning of much lower prices for the next several years. However, it appears rather unlikely that DJIA will penetrate 15370 any time in the near future.

The long-term view of DIA is extremely bullish. The ETF has been moving continuously higher since March 2009. The bears need a weekly close below 80.96 in order to reclaim the downside momentum. A penetration of 80.96 is highly improbable.
SHORT-TERM CHART – Down Jones ETF – DIA
Please review the 6-month chart of DIA (Chart #3). The bears are in control of the short-term trend. However, it does appear that DIA formed a double bottom on April 2nd @ 233.20. A weekly close below 233.20 could easily produce a violent short-term decline.
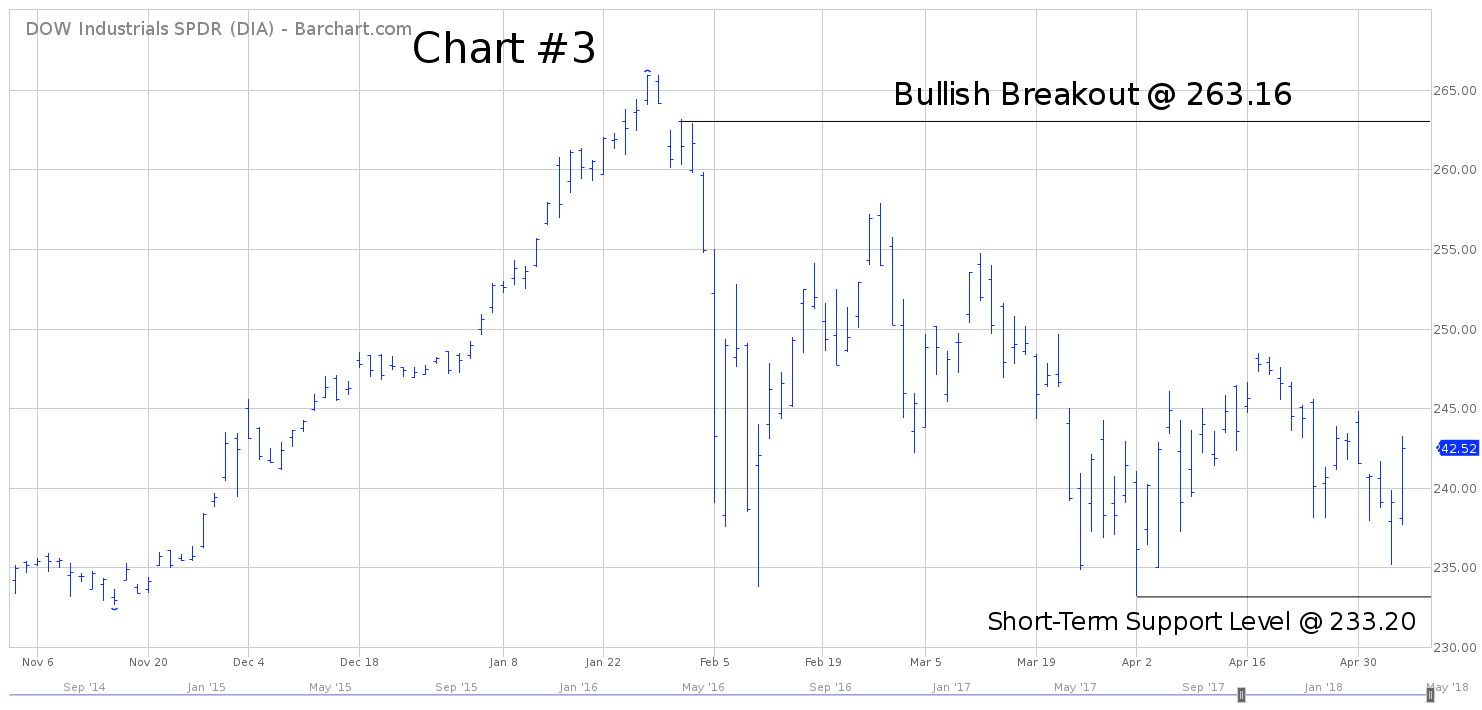
In order to recapture the short-term trend, the bulls need a weekly close above 263.16. At least for now, the most probable scenario for the next several weeks is a trading range affair between 233 and 263. This trading range could continue well into the third quarter.
LONG-TERM CHART – Down Jones ETF – DIA
Please review the 10-year chart of DIA. The bulls are definitely in control of the long-term trend. DIA has enjoyed an incredible rally since March 2009. Based on the current chart pattern, there’s no evidence to suggest that this powerful bull market is on the verge of rolling over to the downside.
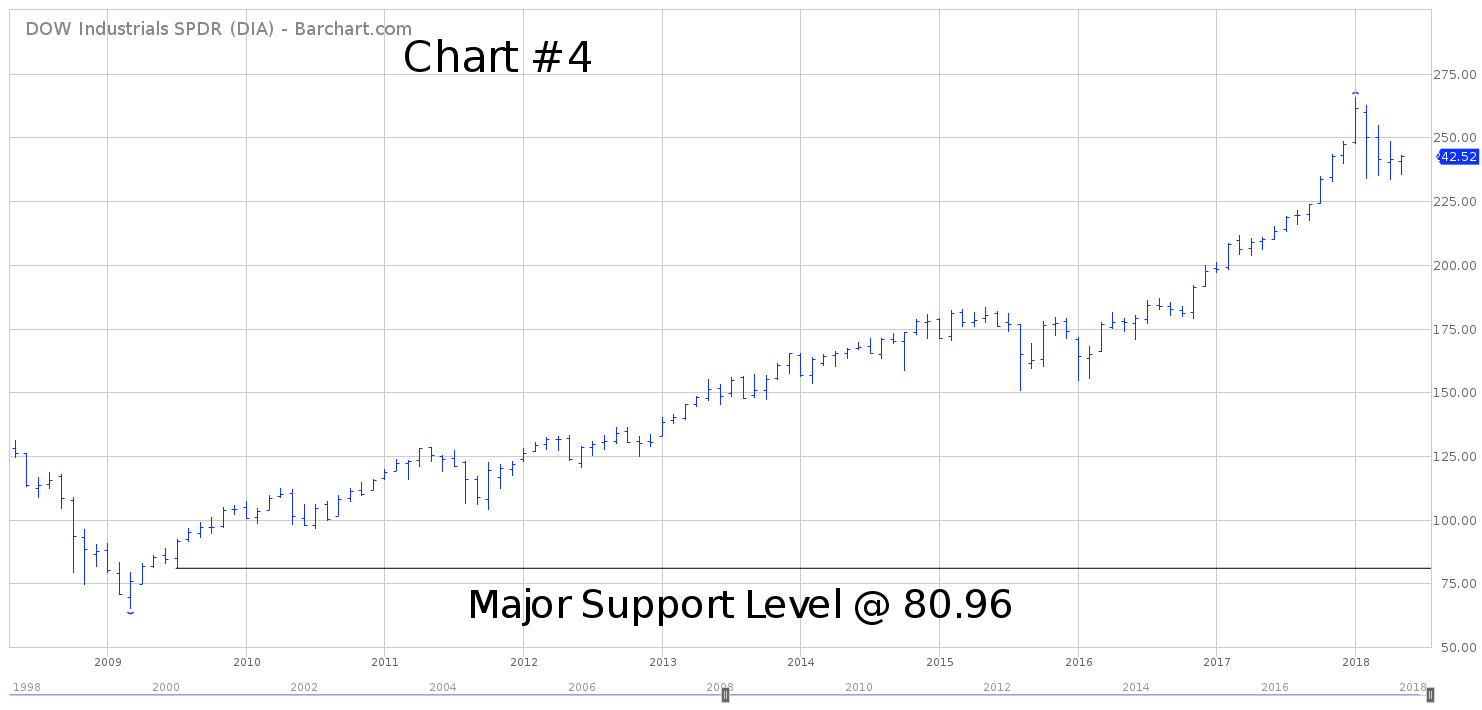
The recent 4-month decline in DIA is actually quite healthy for the long-term trend. It allows DIA to consolidate its sharp rally (in preparation for another leg to the upside). The bears need a weekly close below 80.96 in order to flip the long-term trend from bullish to bearish.
