SPDR Gold Shares ETF (GLD) – Daily Report for May 20
Key Statistics
Thank you for reading this post, don't forget to subscribe!Minor Support Level 113.42 Minor Resistance Level 127.21
Major Support Level 55.05 Major Resistance Level 170.01
Minor Buy Signal 128.54 Minor Sell Signal 112.25
Major Buy Signal 173.19 Major Sell Signal 52.10
BRIEF OVERVIEW
Arguably, the gold market is the best investment vehicle for determining the current level of emotional distress within the global investment community. During times of investor uncertainty, gold has performed incredibly well. However, when investors appear to be rather sanguine about the future direction of the global economy, the price of gold usually drifts lower. Whether you love gold or despise it, there’s no denying the fact that the “yellow metal” has stood the test of time in regard to its role as a store of value and a universally accepted method of payment.
In light of the recent explosion in the digital currency movement (i.e. bitcoin), many investors
and speculators are beginning to question the necessity of owning gold as an alternative asset. They claim gold is no longer needed as part of a diversified portfolio. Has gold finally lost its appeal within the investment community? Are all precious metals on the verge of entering a multi-year bear market? Let’s examine the details.
The price of gold has been locked in a very tight trading range during the past five years. Why? Because price movements in the global financial markets have been as boring as watching paint dry. The VIX Index (which measures stock market volatility) has experienced some of its lowest readings since the index was launched in 1993. In other words, investors are not the least bit concerned about a major stock market collapse or financial crisis. Consequently, there’s no reason to own gold. Of course, the fact that everyone is so complacent about the global investment landscape is probably a good reason to own gold. Currently, all investors are leaning to the same side of the boat. History has taught us many times that this scenario usually doesn’t end well.
The SPDR family of exchange traded funds (underwritten by State Street Global Advisors) introduced the Gold Shares ETF on November 18, 2004. The ticker symbol is GLD. The name of the ETF is slightly misleading. GLD does not contain any shares of gold mining companies. Instead, the ETF is focused on investing in gold bullion. Therefore, GLD is a perfect vehicle for investors who are searching for 100% exposure to the price of physical gold.
SHORT-TERM VIEW
GLD enjoyed a nice rally from October 2018 through February 2019. However, the ETF has been drifting lower over the course of the past ten weeks. Despite the recent decline, GLD is hovering in the middle of its 12-month range. Therefore, the short-term view is basically neutral. The important numbers to watch are 113.42 and 127.21. Based on the recent price action in GLD, the most likely scenario is a bearish breakout below 113.42.
Based on the Aroon Oscillator, GLD has a fairly neutral reading of +28. The Aroon Oscillator is programmed differently than most stochastic indicators. The oscillator fluctuates between
-100 and +100. A reading of 0 would indicate a neutral position. Therefore, a reading of +28 with GLD is considered neutral. The next significant move could be in either direction.
LONG-TERM VIEW
Gold has been used as a medium of exchange and store of value for over 3,000 years. It is one of the very few asset classes that is universally accepted as a method of payment. Therefore, those investors and financial pundits who are forecasting the demise of gold, will probably end up looking rather foolish over the course of the next decade, as gold continues to play an important role in the global financial marketplace. However, that doesn’t mean the yellow metal is on the path to prosperity. On the contrary, there probably is some truth to the notion that gold will take a back seat to other asset classes as we move into a new financial frontier throughout the 2020s and beyond.
In regard to the long-term view of gold, the market enjoyed an incredible rally over the course of ten years (2001 through 2011). In percentage terms, gold increased 656%. However, a strong argument could be made that gold formed an important top in September 2011 @ $1,920 per ounce. Prices have been drifting sideways-to-lower for the past seven years. If the yellow metal did indeed generate a multi-year top in 2011, the market could easily remain in a bearish trend for the next decade. The downside target would be the original breakout level from November 2005 @ 502.
Of course, the “gold bugs” have a much different interpretation of the market. They claim that gold is in a secular bull market which began in September 2001. Based on their research, gold has been in a cyclical bear market since 2011. However, the multi-year secular bull market is still intact as long as the price stays above 859 on a weekly closing basis. The bullish camp believes gold will ultimately penetrate its old high from 2011, which will launch the market to its final peak in the early-2020s, well above $2,000 per ounce.
Which analysis is correct, the bulls or the bears? At least for now, it appears that the bullish argument is the best interpretation. It’s not uncommon for a commodity to experience a cyclical bear market (while still being in a secular bull market). Most likely, gold is in the seventh year of a cyclical bear market. The secular bull market is still intact as long as the price stays above 859 on a weekly closing basis. If the market does indeed penetrate 859, all bets are off, and the long-term bullish argument for gold must be thrown out the window.
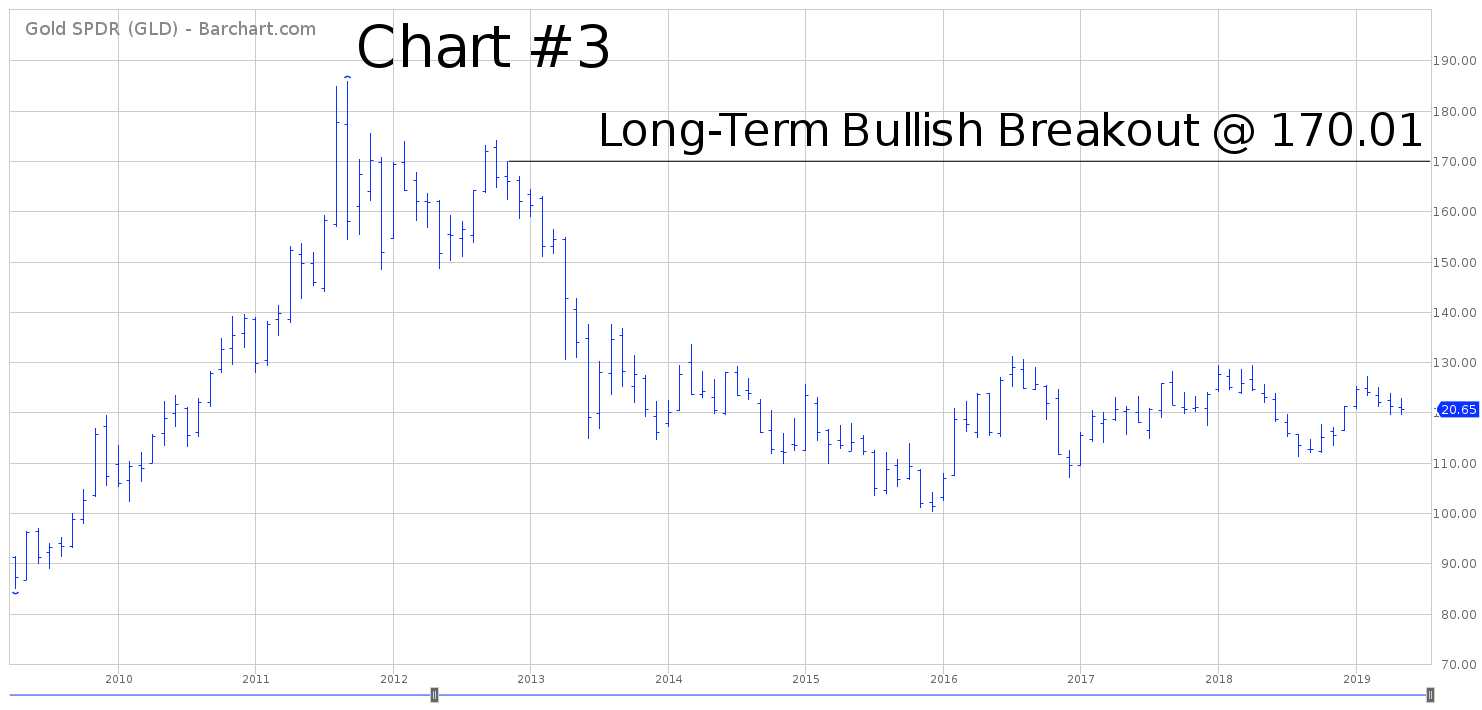
Please review the 10-year chart of the gold market (Chart #1). Prices have been locked in a boring trading range for over five years. The important numbers to watch are 1046 and 1433. Currently, the market is stuck right in the middle of the 5-year range. Based on gold’s previous historical price behavior, the market will probably produce a substantial move whenever the breakout finally occurs. The breakout could go either way.
In regard to GLD, the long-term viewpoint is very similar to the gold market. The ETF has been trading sideways for the past five years. Currently, GLD is in the middle of its trading range. Therefore, the long-term view is considered neutral. In terms of the 5-year trading range, the important numbers to watch are 100.23 and 137.62.
SHORT-TERM CHART
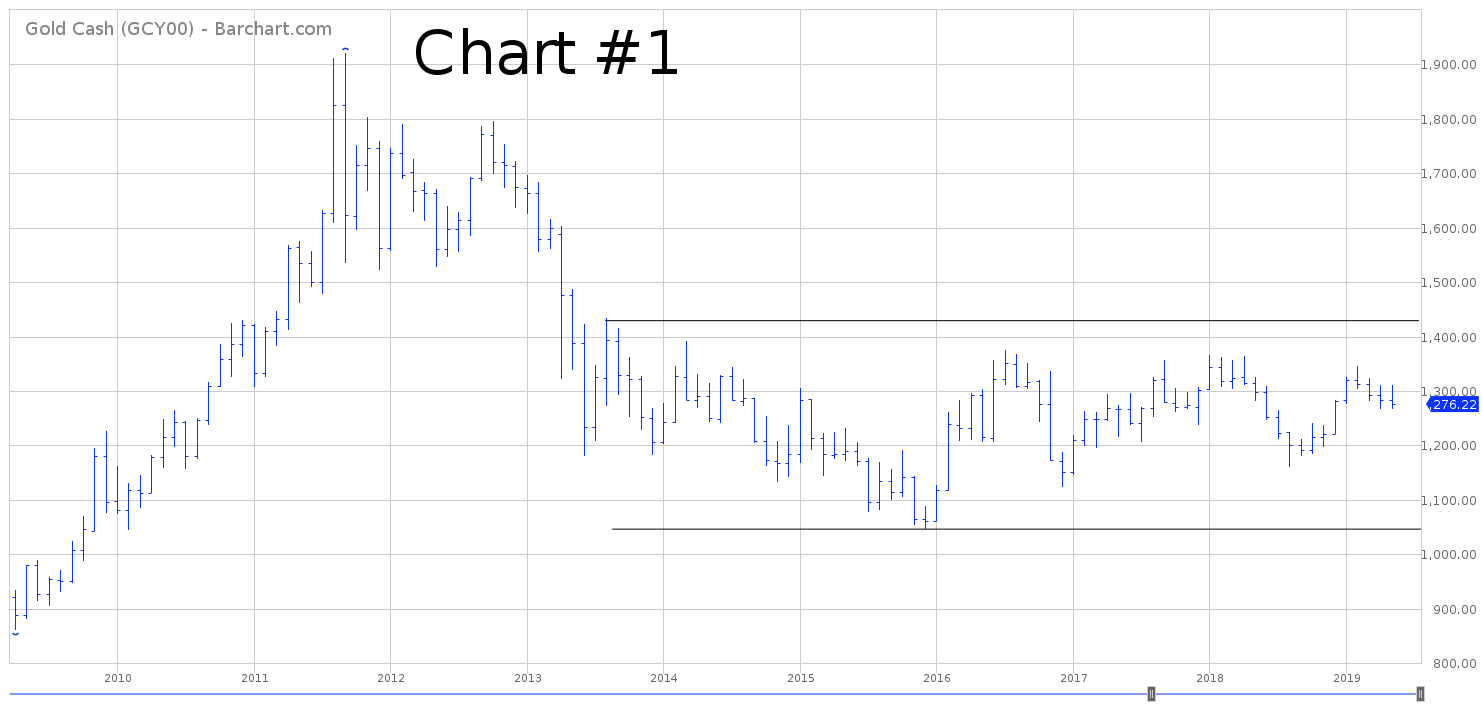
Please review the 6-month chart of GLD (Chart #2). The short-term chart pattern is considered neutral. The important numbers to watch are 113.42 and 127.21. Based on the recent price action in GLD, the most likely scenario is a bearish breakout below 113.42.
LONG-TERM CHART
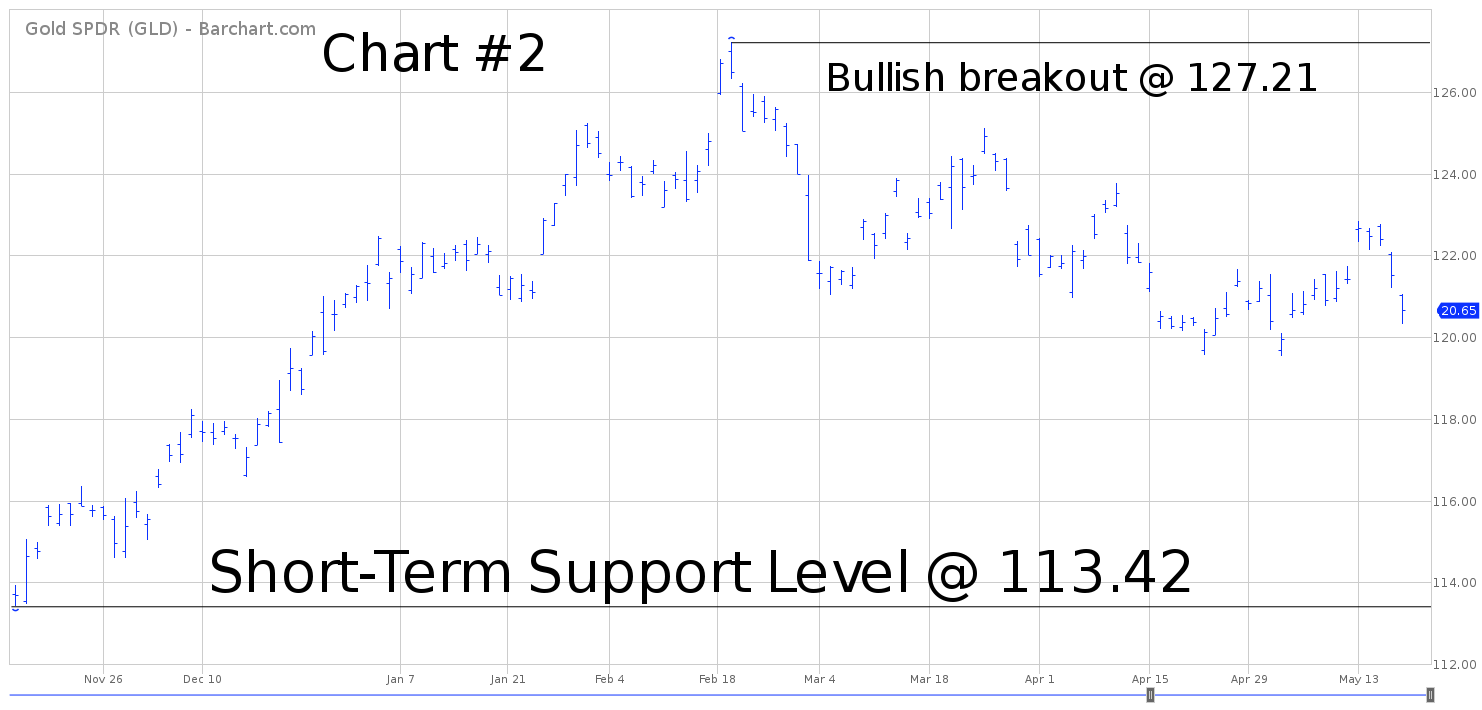
Please review the 14-year chart of GLD (Chart #3). This chart covers the entire trading history of GLD. Very similar to the gold market, GLD has been locked in a trading range since 2013. The long-term chart pattern remains in neutral territory. A bullish breakout will occur @ 170.01.