

iPath Series B S&P 500 VIX Short-Term Futures ETN (VXX)
Key Statistics
Thank you for reading this post, don't forget to subscribe!Minor Support Level 24.86 Minor Resistance Level 39.99
Major Support Level N/A Major Resistance Level N/A
Minor Buy Signal 42.49 Minor Sell Signal 22.83
Major Buy Signal N/A Major Sell Signal N/A
BRIEF OVERVIEW
What is volatility and why should investors be concerned about the level of volatility in the stock market? More importantly, how does volatility affect my investments? Additionally, why does the Wall Street community spend an extraordinary amount of time tracking and measuring volatility? Let’s examine the details.
Many professional investors firmly believe volatility is the most important component of successful investing. Why? Because asset prices will be locked in a boring trading range unless volatility is added to the equation. If asset prices trade sideways, it’s incredibly difficult for money managers and professional traders to generate a profit. This explains why investors are obsessed with volatility.
In its simplest format, volatility is a statistical measure designed to capture the range of returns for a specific security, asset class or market index. As a general rule of thumb, the higher the volatility, the riskier the security. In the financial markets, volatility is often associated with big swings in either direction. Quite frankly, most speculators (particularly daytraders) are not concerned with the direction of the underlying security. As long as the asset class is experiencing large price fluctuations, speculators are happy. The direction is not important.
Without question, the most popular way to measure volatility among the Wall Street community is through the VIX (officially known as the Volatility Index). The VIX was created by the Chicago Board Options Exchange (CBOE) on 19 January 1993. The original VIX was simply a tracking device used by traders to gauge the volatility of the equity markets. It was not feasible to trade the VIX in a brokerage account.
On 24 March 2004, CBOE introduced the first exchange-traded futures contract on its futures exchange. The VIX futures contract became an immediate success among traders and speculators. Two years later, in February 2006, CBOE launched VIX options, which became even more popular than VIX futures. Today, several thousand contracts are traded on a daily basis by speculators as a means to capture volatility in their brokerage accounts.
In an effort to bring a volatility-based product to the ETF community, the iPath family of exchange traded funds introduced the Series B S&P 500 VIX Short-Term Futures ETN, using the ticker symbol VXX. The product was launched on 19 January 2018. VXX is designed to provide investors with exposure to the CBOE VIX futures contract, using the S&P 500 as the underlying index. As the name implies, VXX is not an exchange-traded fund. Instead, it was issued to the investment community as an exchange-traded note (ETN).
An ETN is a type of unsecured debt security that tracks an underlying index on a major exchange. It is very similar to a bond but it does not make an interest payment. Instead, the owner of the ETN is paid at maturity based on the performance of the underlying index (i.e. S&P 500). Although an ETN is similar to a bond, it trades like a stock. Traders can buy and sell the ETN throughout the trading day. They are not required to hold the debt security until maturity. As far as the average investor is concerned, there is no difference between an exchange-traded note and an exchange-traded fund.
In terms of financial responsibility of VXX, Barclays Bank PLC is the issuer of the ETN. However, this product is an unsecured debt obligation of Barclays Bank. Therefore, investors are relying on the financial stability of the issuing bank. Barclays corporate headquarters is based in London. The bank has several branches located in the United States. All branches are FDIC insured. However, exchange-traded notes issued by Barclays are not FDIC insured. Instead, the ETN products are backed by the “full faith and credit” of Barclays.
SHORT-TERM VIEW
From a short-term perspective, the bears are in complete control of VXX. The ETN has been in a brutal decline since December 2018. Specifically, VXX has lost 51.1% of its value since 27 December 2018. In order recapture the short-term momentum, the bulls need to generate a weekly close above 39.99 (highly unlikely any time in the near future).
Investors should be aware that all VIX products usually have an inverse relationship to the underlying asset. For example, if the S&P 500 is moving higher, the accompanying VIX product is probably moving lower. Of course, this relationship makes perfect sense. Why? Because traders and speculators become extremely complacent as the stock market increases in value. They become convinced that stock prices will levitate indefinitely, with very little chance of a violent decline. Consequently, they ignore the VIX index and the price begins to decline.
Currently, VXX is experiencing a similar scenario. The S&P 500 is trading at an all-time record level and VXX is trading at an all-time low. As the S&P continues to move higher, VXX will continue to drift lower.
LONG-TERM VIEW
As we discussed briefly, the CBOE introduced the VIX Index in December 1993. The index has been continuously calculated on a daily basis for the past 26 years. In order to provide historical context, let’s examine the record price levels of the VIX Index since its inception. Please review the following table.
VIX Index
Historical Price Levels
Ranking Date Price Level Ranking Date Price Level
1 10.24.2008 89.53 1 11.24.2017 8.56
2 10.27.2008 81.65 2 07.26.2017 8.84
3 11.20.2008 81.48 3 12.27.1993 8.89
4 10.16.2008 81.17 4 12.20.2017 8.90
5 11.21.2008 80.74 5 01.04.2018 8.92
6 10.23.2008 79.43 6 01.03.2018 8.94
7 10.28.2008 78.98 7 11.03.2017 8.99
8 10.10.2008 76.94 8 01.05.2018 9.00
9 11.19.2008 75.00 9 07.25.2017 9.04
10 10.17.2008 74.48 10 07.12.1993 9.11
Source Macroption
Not surprisingly, the top ten VIX readings occurred during the “peak” of the 2008 financial crisis. On the opposite end of the spectrum, the majority of the record low VIX readings have transpired during the past 24 months. Since 2017, global equity markets have been incredibly sanguine. Consequently, the volatility has completely disappeared. This explains why the hedge fund industry and managed money industry have produced such anemic performance results dating back to 2017. Without volatility, hedge funds have absolutely no chance of outperforming the major averages and financial benchmarks. It’s simply not going to happen.
Why have the financial markets morphed into these “zombie” trading environments for the better part of the past decade? What happened to the volatility? Not only has the volatility disappeared from most global equity markets, it has also vanished from all other asset classes. This includes commodities, alternative assets, precious metals, high yield bonds and several cryptocurrencies. What has been the main culprit of reduced volatility during the past several years, particularly since 2017? Although it’s difficult to pinpoint the exact cause of reduced financial volatility, the majority of the blame can be traced back to the 2008 financial crisis.
During the next 50 years, as financial historians reflect upon the collateral damage from the global financial crisis of 2008, the vast majority of these experts will undoubtedly agree that the policies enacted by government officials resulted in a tremendous reduction in volatility within most global financial markets. Why? Because most of the “alphabet soup” programs adopted by the Federal Reserve and the US Treasury Department were designed to sterilize the financial markets in an effort to calm investors’ fears.
Unfortunately, the sterilization process went too far. Today, we find ourselves with speculative financial markets that are anything but “speculative.” Instead, these markets are “managed” by global central bankers as the volatility continues to erode. Will this problem ever be fully resolved? The answer is, “Yes.” However, it will require a coordinated effort by the bankers to remove the excess liquidity that resides in the financial markets and the banking system. Until these steps are taken, traders and investors should prepare themselves for a continued reduction in volatility (with an occasional burst of dramatic price fluctuations similar to Q4 2018).
In terms of VXX, the ETN has only been in existence since January 2018. Therefore, it’s impossible to study the long-term momentum. Not surprisingly, the VXX has been in a nasty bear market since its inception 15 months ago. At least for now, there’s no reason to expect VXX to generate any type of bullish breakout in the near future.
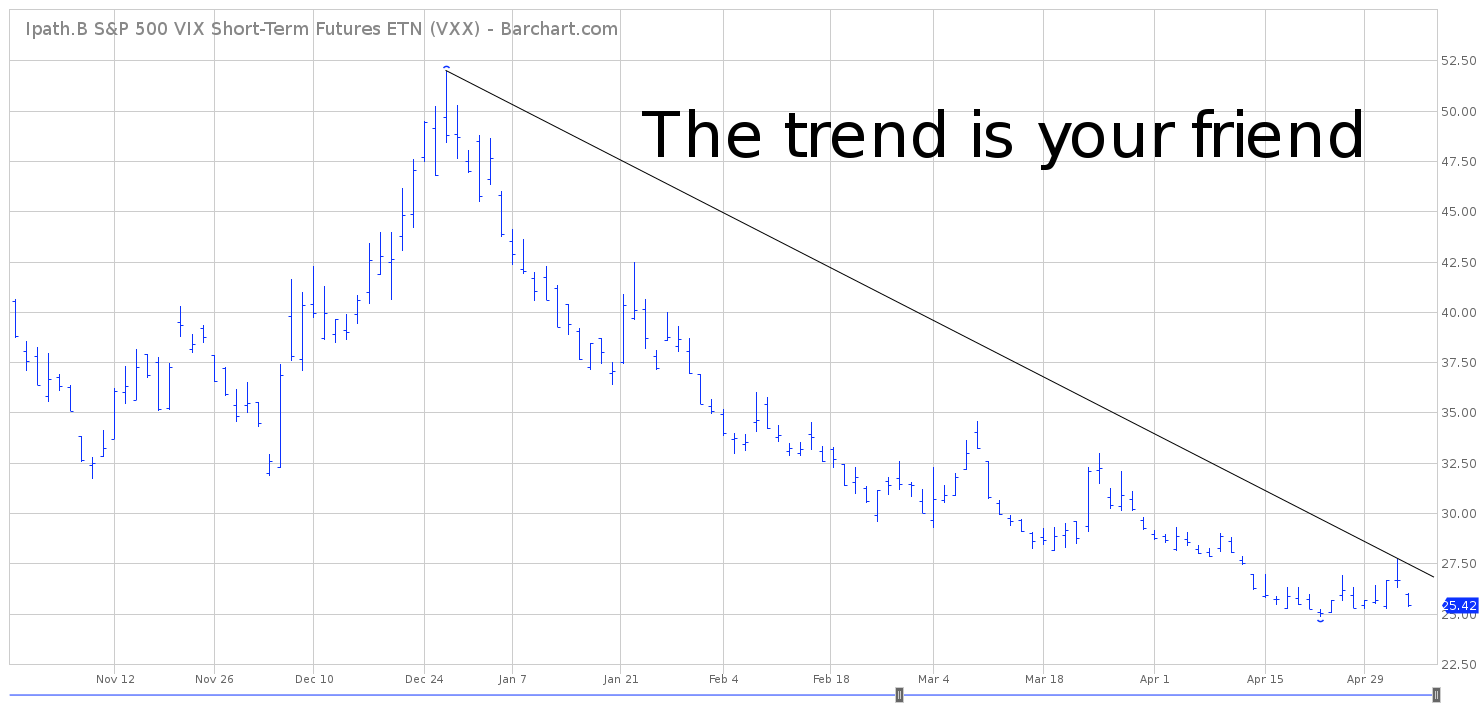
SHORT-TERM CHART
Please review the 6-month chart of VXX. The bears are in complete control of the chart pattern. The next level of support is 24.86, followed by 22.83. In order to push the trend into bullish territory, the trend-following community needs to generate a weekly close above 39.99 (highly unlikely any time in the near future).

LONG-TERM CHART
VXX was launched in January 2018. Therefore, the ETN does not have enough data to create a long-term chart. VXX has been in a nasty bear market since its inception 15 months ago. At least for now, there’s no reason to expect VXX to generate any type of bullish breakout.
