iPath Bloomberg Coffee Subindex Total Return ETN (JO)
Key Statistics
Thank you for reading this post, don't forget to subscribe!
Minor Support Level 31.02 Minor Resistance Level 39.24
Major Support Level N/A Major Resistance Level N/A
Minor Buy Signal 39.83 Minor Sell Signal 30.69
Major Buy Signal N/A Major Sell Signal N/A
BRIEF OVERVIEW
Arguably, coffee is the most popular drink in the world. The global population consumes a staggering amount of coffee on an annual basis. Based on data provided by the International Coffee Organization (ICO), annual consumption is 10 million tons per year. Despite the fact that the United States has more coffee shops than any other nation on the planet, the US is not the largest consumer on a per capita basis. In fact, the United States does not even rank in the top twenty.
As of December 2018, there were 35,616 coffee shops operating in the United States. Of course, it should come as no surprise that Starbucks is the largest coffee shop in the country. Currently, Starbucks operates 14,606 stores in the United States. Dunkin’ Donuts is a distant second, with 9,200 stores in the US. Here’s a quirky little statistic: Most people believe that Seattle is the number one city in terms of coffee shops per person. Actually, that honor goes to Berkeley, CA. Berkeley has one coffee shop for every 2,073 people living in the city. For those who are curious, Seattle finished fourth on the list.
As you can see, the United States is a major coffee consuming nation and a major sponsor of several coffee shops. However, on a global basis, our nation is way down on the list in regard to
annual coffee consumption per person. Please review the following table.
Annual Coffee Consumption Per Capita
Year Country Location Consumption Country Population
2017 Finland Northern Europe 26.4 lbs 5.56 million
2017 Norway Northern Europe 21.8 lbs 5.40 million
2017 Iceland Northern Europe 19.8 lbs 0.34 million
2017 Denmark Northern Europe 19.1 lbs 5.77 million
2017 Netherlands Northwest Europe 18.4 lbs 17.13 million
2017 Sweden Northern Europe 18.0 lbs 10.05 million
2017 Switzerland Western Europe 17.4 lbs 8.61 million
2017 Belgium Western Europe 15.0 lbs 11.56 million
2017 Luxembourg Western Europe 14.3 lbs 0.60 million
2017 Canada North America 13.6 lbs 37.28 million
Source: International Coffee Organization
As you see from the table, the vast majority of the top coffee consumers are located in northern European countries. This should come as no big surprise, as coffee is considered as one of the best liquid refreshments to warm the body. In terms of the United States, coffee consumption per capita is 9.2 lbs, which ranks the US in 25th place among all coffee consuming nations.
The history of coffee consumption dates back to the middle of the 15th century in the country of Yemen. Over the course of the past 600 years, the drinking and distribution of coffee has changed dramatically, particularly during the past 30 years. Today, coffee is a multi-billion dollar industry, generating tremendous amounts of revenue for the individuals and companies that operate within the industry.
Specifically, coffee is a $76.7 billion industry in the United States. Annual coffee sales are forecasted to increase 5.6% per year for the next five years. The coffee industry in the US will be worth $100 billion by 2024. Please review the following table.
| Annual Revenue From US Coffee Industry
* Estimated Revenue | Source: Statista |
The table verifies the fact that annual coffee revenue within the United States has increased every year since 2010. The growth rate in this industry is staggering. Despite the fact that the coffee industry is in the mature phase of its product cycle, it continues to grow at nearly 6% per year for as far as the eye can see. However, in all honesty, the incredible growth rate of the coffee market probably is more attributable to its addictive nature versus its excellent marketing strategy. Whatever the case may be, coffee will continue to be a great investment opportunity for the next several years.
The iPath family of exchange traded notes (ETN) issued the Bloomberg Coffee Subindex Total Return ETN on 24 June 2008, using the ticker symbol JO. Essentially, JO is a pure play on the coffee market. It is designed for investors who want exposure to the coffee market without the speculative risk of investing in a coffee futures contract. JO does not hold any equity positions. Instead, the ETN is invested in a coffee futures contract on the Intercontinental Exchange (ICE).
An ETN is a type of unsecured debt security that tracks an underlying index on a major exchange. It is very similar to a bond but it does not make an interest payment. Instead, the owner of the ETN is paid at maturity based on the performance of the underlying index (i.e. ICE coffee futures contract). Although an ETN is similar to a bond, it trades like a stock. Traders can buy and sell the ETN throughout the trading day. They are not required to hold the debt security until maturity. As far as the average investor is concerned, there is no difference between an exchange-traded note and an exchange-traded fund.
In terms of financial responsibility of JO, Barclays Bank PLC is the issuer of the ETN. However, this product is an unsecured debt obligation of Barclays Bank. Therefore, investors are relying on the financial stability of the issuing bank. Barclays corporate headquarters is based in London. The bank has several branches located in the United States. All branches are FDIC insured. However, exchange-traded notes issued by Barclays are not FDIC insured. Instead, the ETN products are backed by the “full faith and credit” of Barclays.
SHORT-TERM VIEW – JO ETF
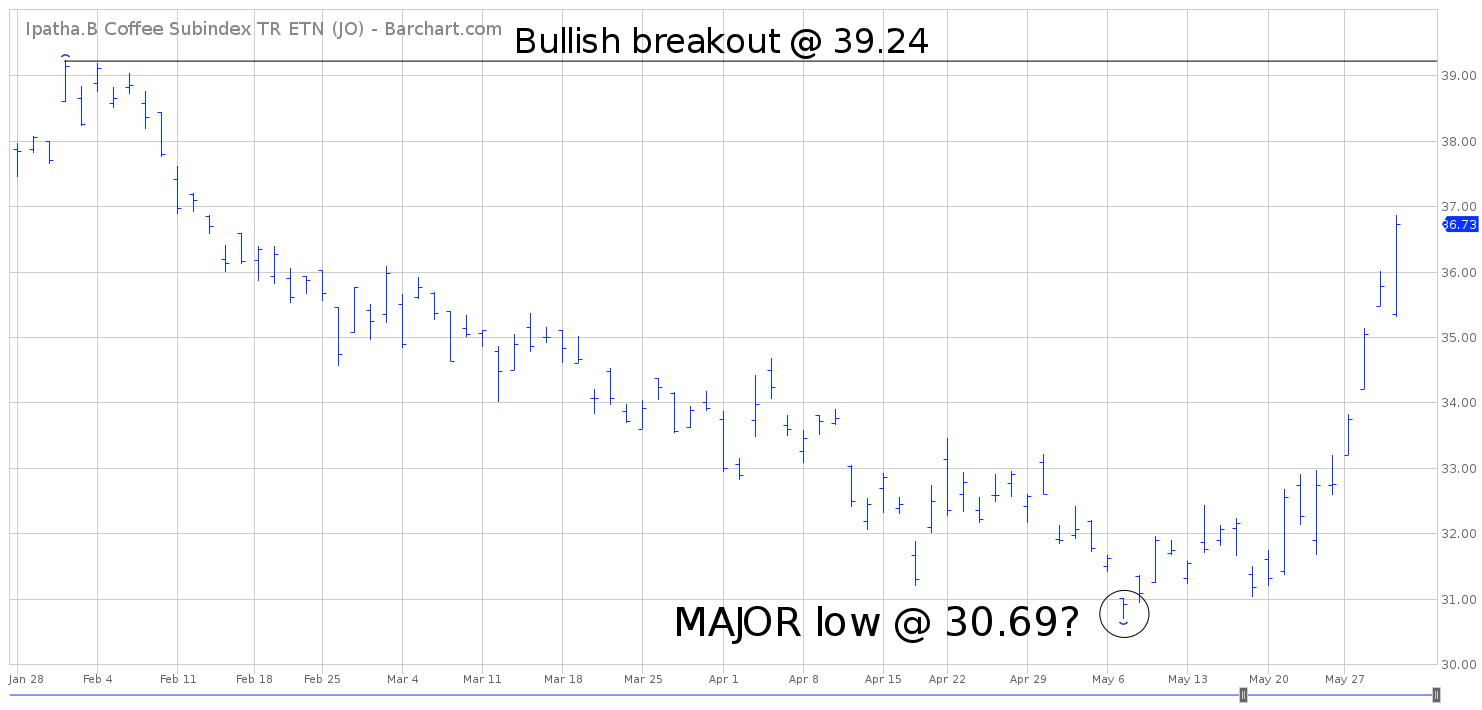
In terms of short-term momentum, the coffee market has been on a brutal decline for the past several months. Consequently, the bears have been in complete control of JO. However, it certainly appears that coffee may have formed an important bottom on 7 May. This corresponds perfectly with a low in JO @ 30.69. The ETN has been grinding its way higher for the past few weeks. A weekly close above 39.24 will flip the short-term momentum in favor of the bulls.
LONG-TERM VIEW – JO ETF
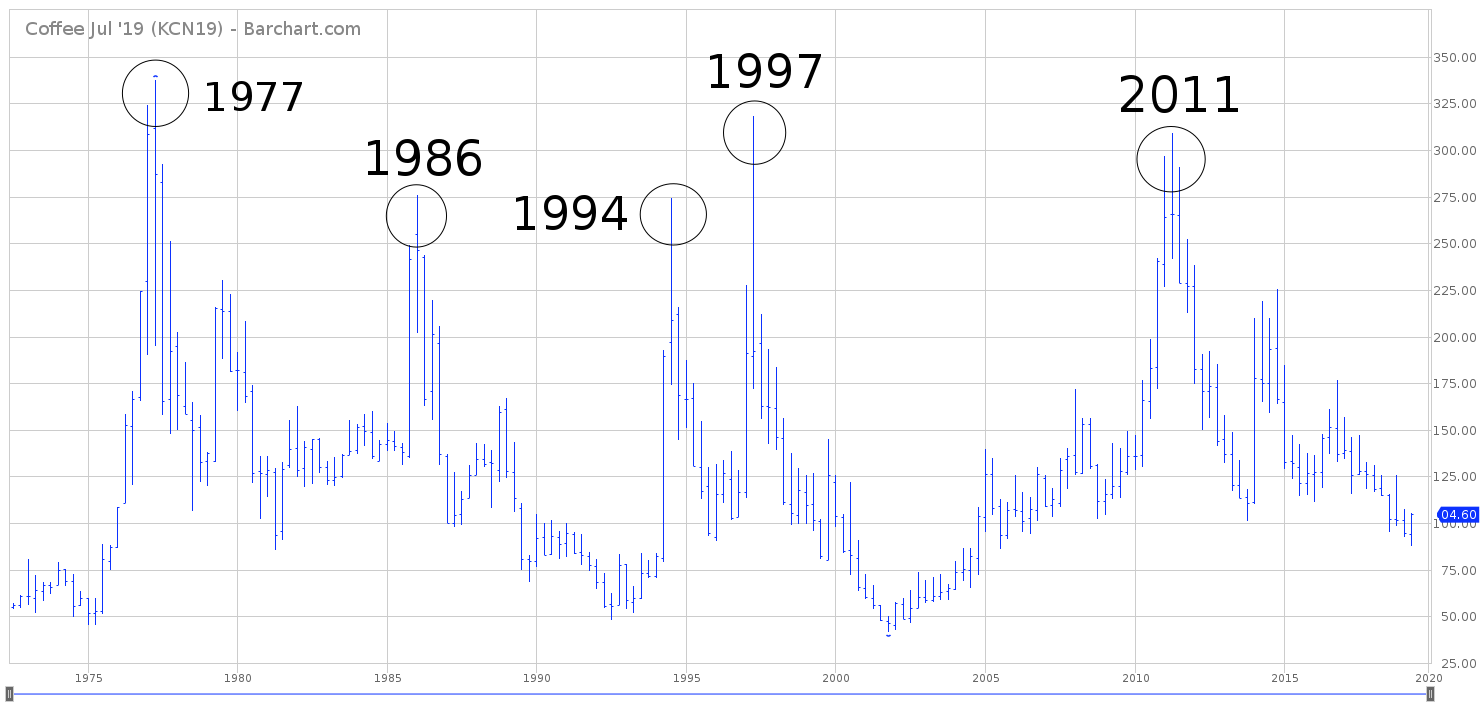
From 2008 through 2012, the commodity markets enjoyed a tremendous rally. During this five year time period, almost every commodity recorded a new all-time high. Coffee was one of the very few markets that was unable to generate a new high. In fact, the highest price for coffee dates all the way back to April 1977. Essentially, the market has been drifting sideways-to-lower for the past 42 years! There are only two commodities that are cheaper today versus 42 years ago. These commodities include sugar and coffee. Without question, coffee is the ultimate contrarian play!
Why has coffee become so inexpensive during the past few decades? The main reason is because the cost of production has fallen dramatically, as automation has replaced human labor. Additionally, Mother Nature has blessed the coffee growing regions of the world with excellent growing conditions during the past few decades. In fact, Brazil, the world’s largest coffee producer, has only experienced one damaging frost during the past 25 years.
In terms of coffee production, the overwhelming majority of global coffee production originates from South America and Asia. Please review the following table.
Global Coffee Production (2017)
Rank Country Location Production
1 Brazil South America 2.59 million
2 Vietnam Asia 1.70 million
3 Colombia South America 0.81 million
4 Indonesia Asia 0.70 million
5 Ethiopia Africa 0.40 million
6 India Asia 0.35 million
7 Honduras North America 0.34 million
8 Uganda Africa 0.29 million
9 Mexico North America 0.27 million
10 Guatemala North America 0.20 million
Source: International Coffee Organization | Production is million metric tons
As you can see from the table, Brazil is easily the largest coffee producer on the planet. In fact, Brazil produces 30% of the world’s coffee beans. Brazil and Vietnam dominate global coffee production. No other country even comes close to matching these two powerhouses.
In regard to coffee prices, this particular commodity generates a spectacular rally slightly more than once per decade. Based on this cycle, the price of coffee should experience a massive rally in 2020. Please examine the attached chart of coffee from 1975 through 2019. There have been five major bull markets during the past 44 years. Be prepared for a fifth bull run as we enter a new decade in 2020.
In regards to the long-term view of JO, Barclays Bank PLC made some significant changes to the ETN in January 2018. Specifically, Barclays modified how the daily value of the ETN was calculated. Consequently, it completely fouled up the pricing structure of JO, making it impossible to analyze the long-term view of the ETN. Therefore, a long-term forecast will not be provided.
SHORT-TERM JO ETF CHART
Please review the 4-month chart of JO. The short-term chart pattern is in favor of the bears. However, it certainly appears that JO formed an important bottom on 7 May @ 30.69. The chart pattern will turn bullish on a weekly close above 39.24.

LONG-TERM JO ETF CHART
In regard to the long-term chart pattern of JO, Barclays Bank PLC made some significant changes to the ETN in January 2018. Specifically, Barclays modified how the daily value of the ETN was calculated. Consequently, it completely fouled up the pricing structure of JO, making it impossible to analyze the long-term chart pattern of the ETN. Therefore, a long-term forecast will not be provided. However, based on the 44-year chart of coffee, an argument could be made that a multi-year bottom was formed in May 2019. If so, this could easily be the best contrarian trade of 2019.