

SPDR S&P 500 ETF (SPY)
Key Statistics
Minor Support Level 294.21 Minor Resistance Level 334.19
Thank you for reading this post, don't forget to subscribe!Major Support Level 107.43 Major Resistance Level 347.65
Minor Buy Signal 337.37 Minor Sell Signal 288.49
Major Buy Signal 355.97 Major Sell Signal 99.57
BRIEF OVERVIEW – S&P 500 ETF SPY
We live in a world of 7.7 billion people. With so many people living on the planet earth, it’s inevitable that we will experience social unrest, national emergencies, weather events, public health crises, economic disruptions, cold wars and hot wars. In fact, these events occur on a fairly regular basis. How do financial markets respond to these disruptions? Based on historical research dating back to 1792, we can conclude that global crises are very unpredictable in terms of how financial markets will react to such events. Each event has its own unique set of circumstances. As a result, financial markets respond to these global crises in relation to circumstances and public perception. Let’s explore the most recent global event, which happens to be a health crisis. How will the financial markets respond to the health crisis? Let’s examine the details.
On 31 December 2019, Chinese officials notified the World Health Organization (WHO) concerning the outbreak of the coronavirus. Initially, the virus appeared to be fairly well contained. However, by mid-January, Chinese health officials noticed a rapid increase in the number of provinces throughout the country who had reported the virus. By far, the largest outbreak of the coronavirus occurred in the city of Wuhan, which is located in central China. Wuhan has a population of 11 million people, making it the ninth largest city in the country. By the final week of January, the virus had become so severe that health officials made a decision to quarantine the entire city of Wuhan. Citizens were required to stay in their homes and apartments until further notice.
There are a total of 23 provinces in China. As of 3 February, every province has at least one case of coronavirus. By far, the worst province is Hubei, which is where the city of Wuhan is located. Officially, over 22K individuals are suffering from the virus throughout the province. Please review the following table.
China Provinces
Coronavirus Cases
Province Coronavirus Province Coronavirus
Anhui 591 Fujian 251
Gansu 62 Guangdong 970
Hainan 106 Hebei 157
Heilongjiang 227 Henan 851
Hubei 22,112 Inner Mongolia 46
Jiangsu 373 Jilin 59
Liaoning 94 Ningxia 40
Qinghai 18 Shaanxi 173
Shandong 341 Shanghai 269
Shanxi 96 Sichuan 321
Tibet 1 Xinjiang 36
Zhejiang 954
Source Bloomberg
On 30 January, WHO officially declared the coronavirus a global public health emergency of international concern (PHEIC). Why? Because the virus recently began to affect other countries outside of China. Please review the following table.
Countries With Coronavirus
Country Country Country Country
Australia Belgium Cambodia Canada
China Finland France Hong Kong
Germany India Italy Japan
Macau Malaysia Nepal Philippines
Russia Sri Lanka Singapore Spain
Sweden Taiwan Thailand The Republic of Korea
UAE UK USA Vietnam
Source Center for Disease Control (CDC)
As you can see from the table, 28 countries have been affected by the coronavirus. This list was last updated on 3 February. What can we expect next in regard to how the World Health Organization will classify the virus? Most likely, WHO will be forced to label the coronavirus as a global pandemic. Why? Because the virus is highly contagious and it spreads very easily across borders into other countries. If WHO upgrades the coronavirus to a pandemic, countries will be forced to close their borders and reduce global trade with other countries.
How is Wall Street reacting to the coronavirus? So far, the reaction has been surprisingly mild. In fact, several equity markets across the globe are actually higher today versus when China officially announced the coronavirus on 31 December. Where do we go from here? Of course, it’s impossible to accurately forecast the virus’ impact on the global economy and financial markets. It’s probably safe to assume that financial markets will generate a great deal of volatility over the course of the next few months.
In an effort to provide investors with exposure to the S&P 500, the SPDR family of exchange traded funds introduced the S&P 500 ETF on January 22, 1993. The ticker symbol is SPY. The ETF allows investors to participate in the S&P 500 without the burden of owning shares of each company within the index. SPY is historically significant because it was the very first exchange traded fund listed in the United States. SPY is easily the most heavily traded ETF, with daily volume usually exceeding 100 million shares.
SHORT-TERM VIEW – S&P 500 ETF SPY
The bulls have been in complete control of the short-term momentum for the past five months. The next level of resistance is 334.19. In order to recapture the momentum, the bears need a weekly close below 294.21. The most likely scenario is a continuation of higher prices.
LONG-TERM VIEW – S&P 500 ETF SPY
Thanks to our nation’s excellent healthcare system, it’s highly unlikely that a global health crisis will ever lead to a secular bear market in equities. Arguably, the United States enjoys the most technologically advanced healthcare network on the planet. Our health providers, doctors and specialists are the most highly trained professionals in the world. By no means is the US healthcare system perfect. However, it’s certainly capable of thwarting an international pandemic.
Please review the following table. This table provides a good example of how the US equities markets have performed during periods of previous global health crises.
S&P Performance Results
Global Viral Outbreaks
Viral Outbreak Date 6-Month Results 12-Month Results
HIV/AIDS 06/1981 (0.3%) (16.5%)
Pneumonic Plague 09/1994 8.2% 26.3%
SARS 04/2003 14.6% 20.8%
Avian Flu 06/2006 11.7% 18.4%
Dengue Fever 09/2006 6.4% 14.3%
Swine Flu 04/2009 18.7% 36.0%
Cholera 11/2010 13.9% 5.6%
MERS 05/2013 10.7% 18.0%
Ebola 03/2014 5.3% 10.4%
Measles/Rubeola 12/2014 0.2% (0.7%)
Zika 01/2016 12.0% 17.4%
Measles/Rubeola 06/2019 9.8% N/A
Coronavirus 01/2020 N/A N/A
Source Dow Jones Market Data
During the past 30+ years, there have been 13 major epidemics and/or global health outbreaks. As you can see from the table, these health crises have not adversely affected the performance of the S&P 500. The only negative impact occurred in 1981, when the HIV virus became a major health concern. Twelve months following the initial HIV outbreak, the S&P generated a decline of 16.5%. However, many Wall Street professionals argue that the S&P index was declining because the US economy was in the midst of a brutal recession. They claim that the poor performance of the stock market could not be attributed to the HIV crisis. Most likely, this argument is correct. Stocks were headed lower primarily because of the US recession, not because of the HIV epidemic.
Will the coronavirus kick off a nasty bear market in US stocks? Based on historical research, the answer is “No.” In fact, historical data suggests the S&P 500 will probably produce a healthy rate of return over the course of the next 12 months. Officially, Chinese authorities notified WHO on 31 December concerning the coronavirus. So far, investors have ignored the “doom and gloom” stories concerning the virus. The S&P 500 has generated a 3.0% rate of return for 2020 (Chart #1).

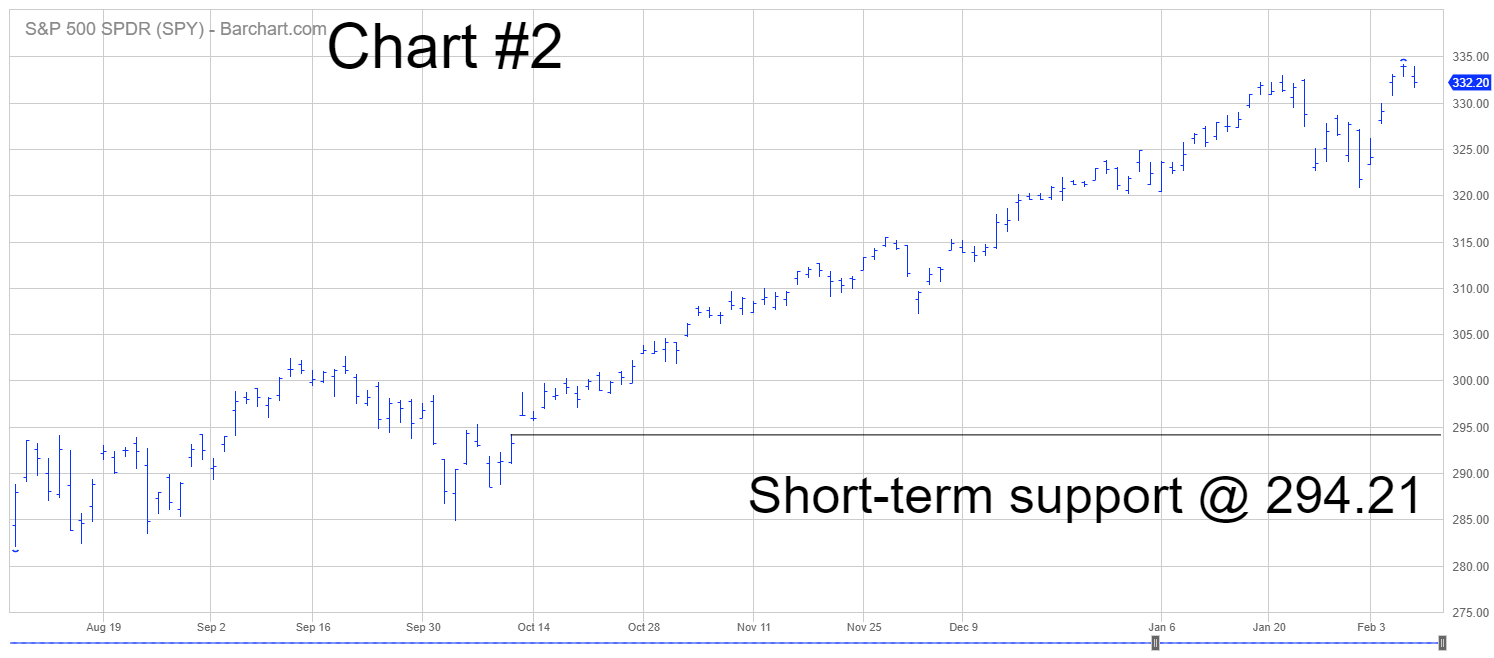
SHORT-TERM CHART – S&P 500 ETF SPY
Please review the 6-month chart of SPY (Chart #2). The short-term chart pattern is bullish. The next level of resistance is 334.19. Eventually, the chart pattern will flip in favor of the bears. However, it’s never a good idea to pick a top. Instead, wait for the trend to reverse course. The important number to watch is a weekly close below 294.21.
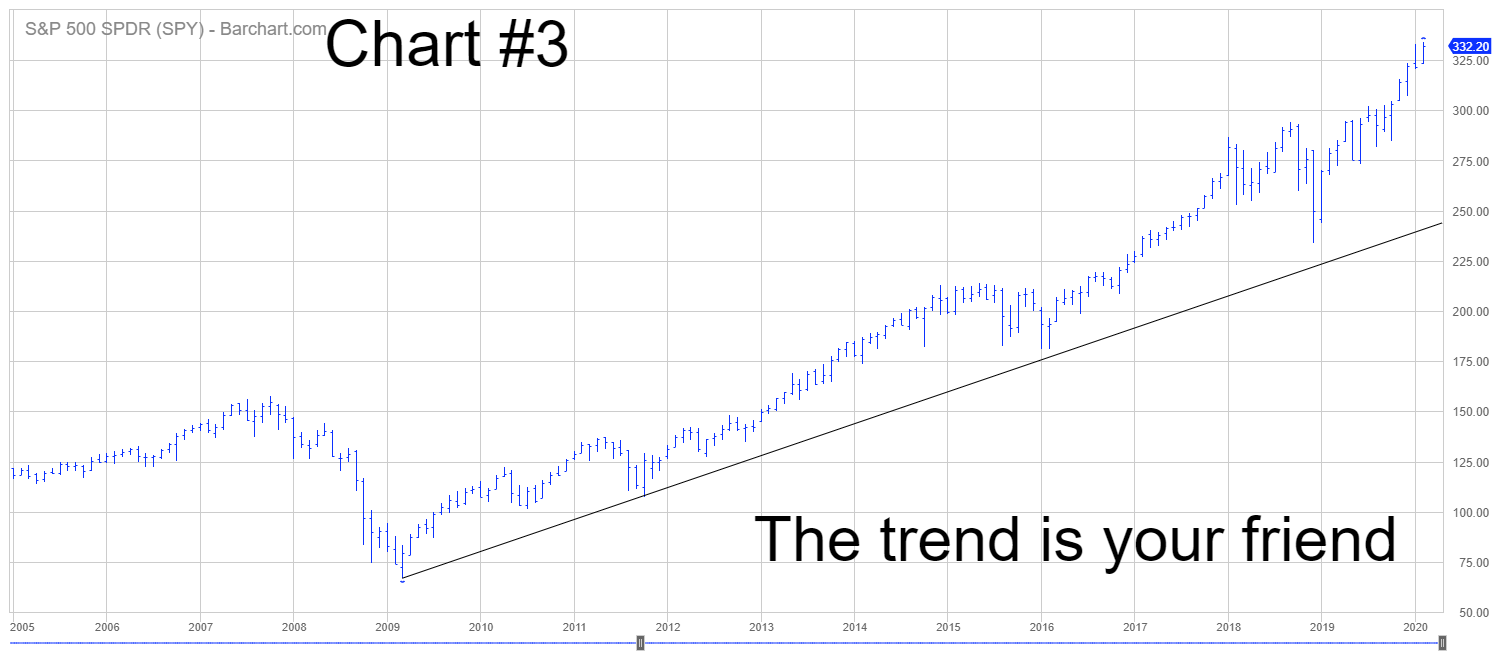
LONG-TERM CHART – S&P 500 ETF SPY
Please review the 15-year chart of SPY (Chart #3). The long-term chart has been continuously bullish since 2009. Eventually, the chart will turn bearish. However, the bull market could easily continue for another decade.

