iShares US Real Estate ETF (IYR)
Key Statistics
Thank you for reading this post, don't forget to subscribe!
Minor Support Level 80.25 Minor Resistance Level 90.18
Major Support Level 35.93 Major Resistance Level 93.35
Minor Buy Signal 91.44 Minor Sell Signal 78.92
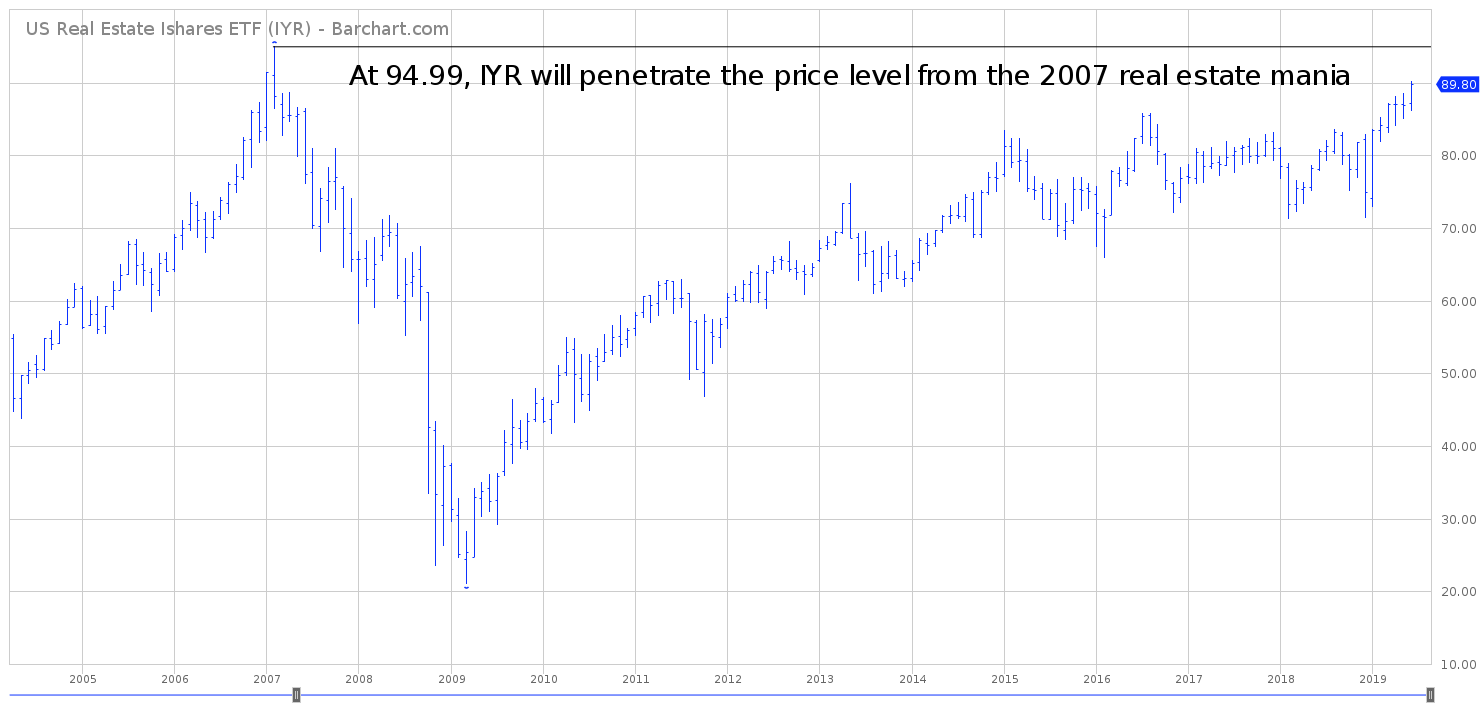
Major Buy Signal 94.99 Major Sell Signal 30.87
BRIEF OVERVIEW
When investors are asked to name the most important financial market in the United States, the overwhelming response is the stock market. It’s not surprising that the US stock market is the most popular response. Why? Because approximately 80% of all financial journalists and financial media are centered around the performance of equities, whether it be the Dow Jones Industrial Average, the S&P 500 or the NASDAQ. There is no denying the fact that the United States stock market is the “leader of the pack” when it involves the subject of financial markets.
Although the US stock market wins the popularity contest in terms of investments, it is certainly not the most important financial market in our nation. In fact, it’s not even close. As of May 2019, the total market capitalization of all US stocks was $34.4 trillion. Certainly, this is a very impressive number. However, it pales in comparison to the total value of all US real estate. As of January 2019, US real estate has a market capitalization of $48.6 trillion. This figure includes residential property as well as commercial property. Without question, US real estate is the “granddaddy” of all financial markets. Please review the following table.
US Real Estate Statistics
Commercial Real Estate
Sector Square Footage Price Per Square Foot Total
Multi-family 18,299 $152 $2.8
Retail 13,422 $186 $2.5
Office Space 11,017 $205 $2.3
Other N/A N/A $2.3
Health Care 2,698 $809 $2.2
Hospitality 2,618 $578 $1.5
Industrial 20,148 $67 $1.4
Flex 2,362 $122 $0.3
Source: Nareit | square footage in millions | value in trillions | “Other” is self-storage & sports stadium
Based on data provided by the National Association of Real Estate Investment Trusts, the market capitalization of all commercial real estate in the United States is $15.3 trillion. In regard to residential real estate, the total value of US residential real estate is $33.3 trillion. The residential data was furnished by Zillow. The total value of our nation’s real estate is $48.6 trillion, which is 41% larger than the market capitalization of all publicly traded stocks.
During the past 12 months, there has been a heated debate within the Wall Street community concerning the health of the US economy. The majority of professional economists and institutional money managers claim that the United States is in the early phases of a recession. They are forecasting a “full blown” recession by the middle of 2020. In fact, many economists predict the next recession will be even worse than the financial crisis of 2008 – 2009.
Is the US economy on the verge of a recession? Will the next economic downturn actually be worse than the Great Financial Crisis? In order to answer these questions, the best place to start is by examining the largest financial market. As we just discovered, the largest financial market in the United States is real estate (which includes commercial and residential). Let’s examine the details.
The iShares family of exchange traded funds (managed by BlackRock) introduced the US Real Estate ETF, with the objective of providing investors with exposure to real estate activity throughout the United States. The ETF was launched on 12 June 2000, using the ticker symbol IYR. The ETF has 114 different holdings. The top five holdings include American Tower REIT Corp, Simon Property Group, Crown Castle International REIT, Prologis REIT Inc and Equinix REIT Inc. The current 52-week trading range is 71.41 to 90.18.
SHORT-TERM VIEW
In terms of short-term momentum, the bulls are in complete control of IYR. The next level of resistance is 90.18. IYR has been moving relentlessly higher since December 2018. The bears have been unable to gain any traction for the past six months. In order to recapture the momentum, the bears need a weekly close below 80.25.
Based on the Aroon Oscillator, IYR has an extremely overbought reading of +96. The Aroon Oscillator is programmed differently than most stochastic indicators. The oscillator fluctuates between -100 and +100. A reading of 0 would indicate a neutral position. Therefore, a reading of +96 with IYR is considered aggressively overbought. The ETF is way overdue for a short-term correction. Based on the extreme reading of the Aroon Oscillator, IYR could be on the verge of a violent short-term decline.
LONG-TERM VIEW
The US real estate market has a huge impact on several sectors of our nation’s economy, both directly and indirectly. These sectors include: construction spending, durable goods, the insurance industry, the banking industry, retail sales, materials and industrial spending. Purchasing real estate, whether it be commercial or residential, has a tremendous influence on the entire US economy. This explains why real estate is (arguably) the most important indicator in determining the health of the US economy. Please review the following table.
US New Homes Sales
1980 – 2018
Date Units Date Units Date Units
1980 6,544 1981 5,229 1982 5,018
1983 7,528 1984 7,641 1985 8,297
1986 8,957 1987 8,028 1988 8,091
1989 7,840 1990 6,394 1991 6,112
1992 7,362 1993 8,093 1994 8,007
1995 8,034 1996 9,069 1997 9,676
1998 10,673 1999 10,542 2000 10,563
2001 10,887 2002 11,714 2003 13,088
2004 14,410 2005 15,347 2006 12,592
2007 9,224 2008 5,786 2009 4,491
2010 3,855 2011 3,677 2012 4,417
2013 5,158 2014 5,283 2015 6,032
2016 6,738 2017 7,403 2018 7,379
Source: Federal Reserve Bank of St Louis | units in thousands
The most impressive takeaway from this chart is the incredible strength of the residential real estate market during the infamous “real estate bubble” from 2002 through 2005. At the peak of the mania in 2005, an amazing 15,347,000 new homes were sold. Of course, the real estate bubble was the Achilles heel of the 2008 financial crisis. This was the trigger that unleashed the global financial crisis.
The US real estate market remained weak for the next six years following the 2005 peak. However, real estate activity has recovered nicely over the course of the past seven years, along with the United States economy. In fact, our nation’s economy is currently enjoying one of the greatest periods of uninterrupted economic expansion in recorded history. Officially, the United States is in its tenth year of economic expansion.
Based on the continued strength of the domestic real estate market, there appears to be very little chance of an imminent recession. The “doom and gloom” Wall Street economists who are forecasting a 2020 recession will probably be wrong. Residential real estate and commercial real estate are clicking on all cylinders.
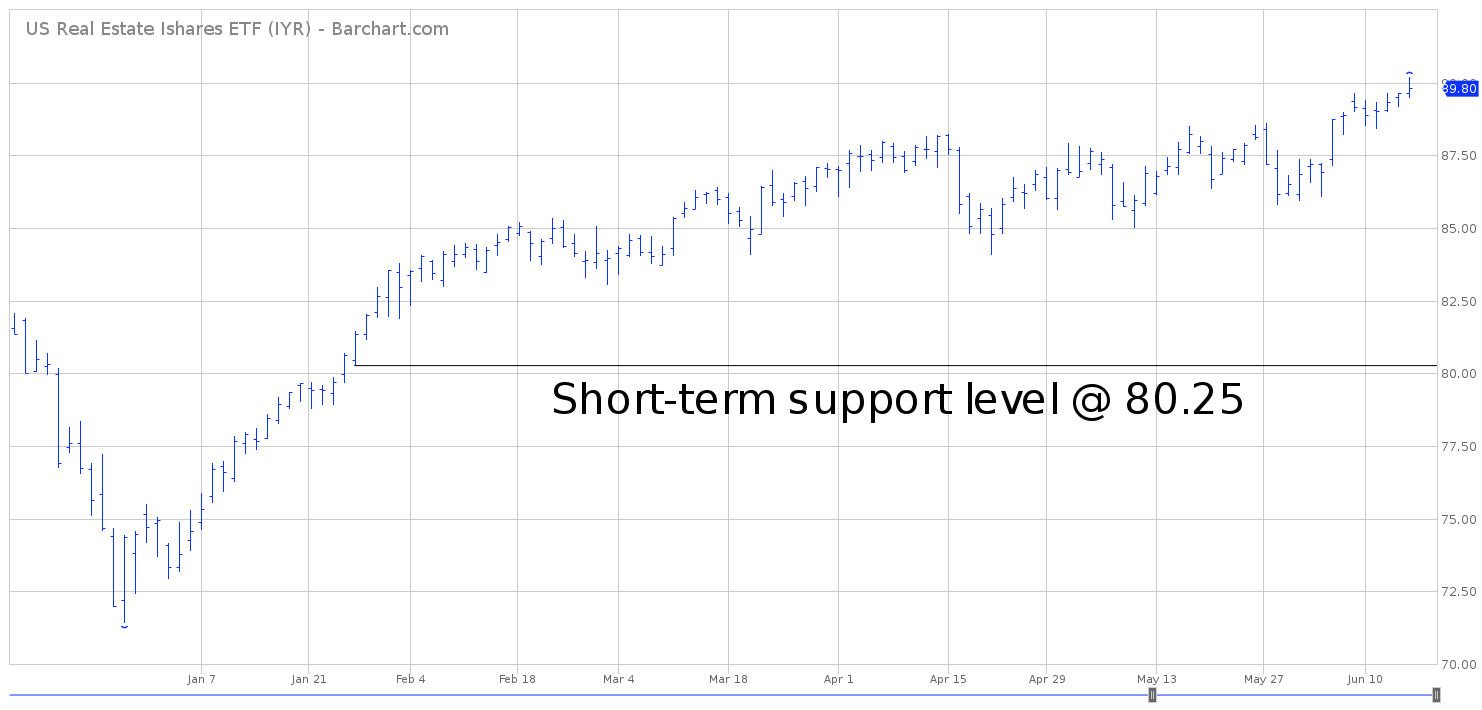
SHORT-TERM CHART IYR
Please review the 6-month chart of IYR. The short-term chart pattern is heavily in favor of the bulls. A weekly close above 90.18 could propel the ETF to much higher levels. A weekly close below 80.25 would push the short-term chart pattern in favor of the bears.
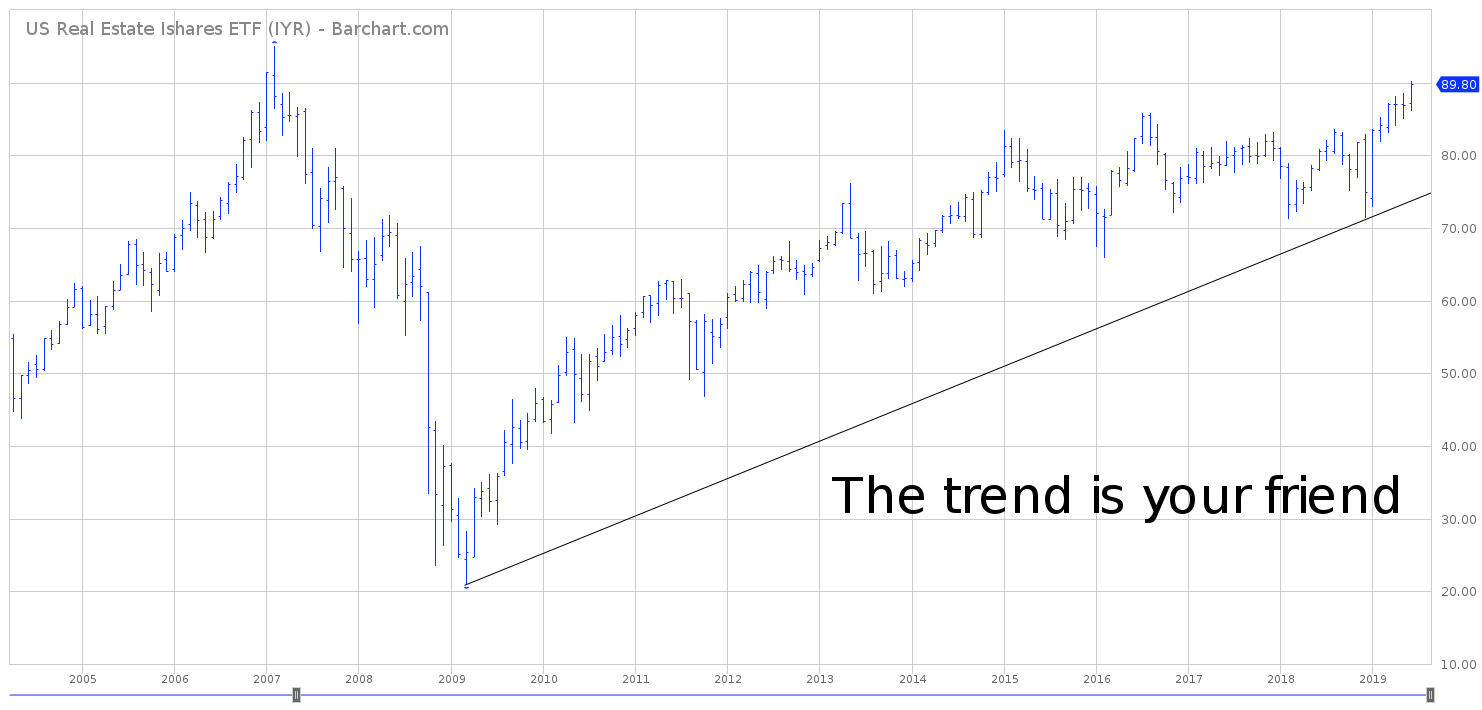
LONG-TERM CHART IYR
Please review the 15-year chart of IYR. The long-term trend is incredibly bullish. The ETF has been moving relentlessly higher for the past decade. In fact, IYR is within “spitting distance” of exceeding the price level from the 2007 real estate bubble. As long as IYR is grinding its way higher, the threat of a US recession appears to be rather limited.