
Utilities Select Sector SPDR Fund ETF (XLU) – Daily Report for June 11th
Thank you for reading this post, don't forget to subscribe!Key Statistics
Daily Close 48.69 Long-Term Trend (100 SMA) Bearish
Minor Support Level 47.37 Minor Resistance Level 52.91
Major Support Level 22.48 Major Resistance Level 57.23
Minor Buy Signal 54.48 Minor Sell Signal 46.04
Major Buy Signal 62.79 Major Sell Signal 16.71
BRIEF OVERVIEW – XLU
The S&P 500 is comprised of 11 different major market sectors. Each sector includes several different industries within the US economy. Taken together, these industries form a broad representation of our nation’s economy. Without question, the sector that receives the least amount of “fanfare” is the utilities sector. Over the course of the past several decades, the utilities sector has garnered a reputation for being an investment vehicle for “widows and orphans.” In other words, utility stocks are viewed by the investment community as incredibly boring. Does the industry deserve this label? More importantly, should you consider an investment in this sector? Let’s explore the utilities sector in more detail.
Utilities include companies involved in water, gas, electric and other types of infrastructure. In recent years, alternative energy has been added to the mix. This would include wind turbine, solar, ethanol and geothermal.
Generally speaking, utility stocks are favored by investors who prefer relative stability, particularly during times of stock market turmoil. Compared to their counterparts, utilities are incredibly reliable in terms of earnings predictability. Additionally, these companies tend to perform well across all types of economic cycles.
Utility companies have the benefit of operating with the protection of government regulations that act as barriers to entry in a market. Consequently, these companies are shielded from other competitors. This allows a limited number of companies to dominate an entire industry.
Given the fact that utilities generate reliable revenue streams, the companies are able to reward their shareholders with consistently high dividends. For this reason, many utility stocks are treated like bonds by income investors who rely on their investments for revenue. Historically, utility stock dividends tend to offer higher yields in comparison to traditional
fixed-income investments like government bonds, savings bonds and certificates of deposit. Additionally, utility stocks produce less volatility than other stock groups. This explains why utilities are labeled as investments for “widows and orphans.”
Even though utility stocks offer attractive dividends, predictable revenue streams and low volatility, these stocks are certainly not favored by all types of investors. For example, growth investors have absolutely no desire to include these stocks in their portfolios. Why? Because utility stocks have limited growth potential. As we discussed briefly, these companies operate in a government controlled environment. Consequently, utilities offer very little in the way of exciting new products or business expansion. Therefore, growth investors usually ignore this market sector.
The SPDR family of exchange traded funds (underwritten by State Street Global Advisors) introduced the Utilities Select Sector Fund ETF on December 16, 1998. The ticker symbol is XLU. This ETF is a perfect vehicle for investors who are searching for exposure to companies involved in the utilities industry. XLU has 28 different holdings. The top five holdings include NextEra Energy Inc, Duke Energy, Southern Company, Dominion Energy Inc and Exelon Corporation.
SHORT-TERM VIEW – XLU
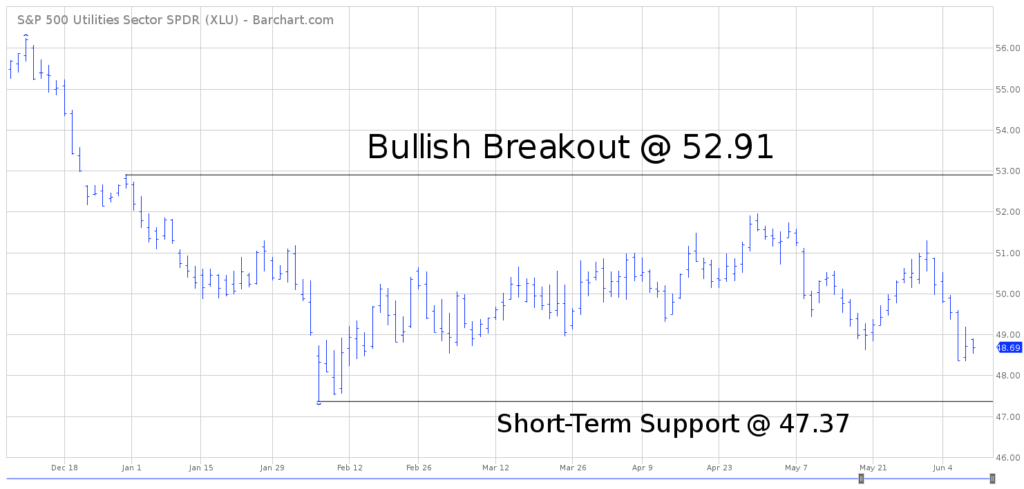
XLU has been moving sideways throughout the first six months of 2018. The ETF has been locked in a boring trading range with a slight bias to the downside. A bullish breakout will occur at 51.96. Conversely, a bearish breakout will occur at 47.37. At least for now, the most likely outcome is a breakout to the downside.
Based on the Aroon Oscillator, XLU has an extremely oversold reading of -92. The Aroon Oscillator is programmed differently than most stochastic indicators. The oscillator fluctuates between -100 and +100. A reading of 0 would indicate a neutral position. Therefore, a reading of -92 with XLU is considered extremely oversold. Most likely, the ETF is very close to generating a short-term rally.
LONG-TERM VIEW – XLU
As we discussed previously, utility stocks are in direct competition with fixed-income investments in terms of generating a predictable revenue stream for investors. Based on historical results, utility stocks outperform the overall stock market during periods of low inflation, benign economic growth, accommodative monetary policy and declining interest rates. However, it certainly appears the utilities sector could be on the verge of facing some stiff headwinds in regard to changing economic trends. Let’s review the details.
Once again, the four main factors which affect the performance of utility stocks are inflation, economic growth, monetary policy and interest rates. Let’s begin with inflation.
Over the course of the past eight years (2009 – 2017), the domestic rate of inflation has been
hovering near historically low levels. The average annual rate of inflation was a meager 1.6%. This is one of the contributing factors that allowed utility stocks to outperform the majority of the sectors within the S&P 500. However, during the first four months of 2018, inflation has been trending higher. The annualized rate is 2.3%. There is mounting evidence that the rate of inflation is in the very early stages of a new uptrend. If this analysis is correct, dividend stocks could be under pressure well into the foreseeable future.
Very similar to inflation, the United States economy is showing signs of sustainable growth for the first time in several years. For the 12 months ended in March 2018, the US gross domestic product (GDP) was 2.9%. This marks the highest annual growth rate since 2005. Additionally, the US economy is enjoying its lowest unemployment rate in 18 years. The current rate is 3.9%. This is “good news” for the American worker but “bad news” for investors in the utility sector.
Another headwind facing utility stocks these days is monetary policy. Utility stocks have a tendency to perform best during periods of accommodative monetary policy. In regard to US monetary policy, the Federal Reserve is responsible for laying the foundation by adjusting the money supply. During the past 12 months, the Fed has been reducing the rate of growth of the M2 money supply in an effort to reduce short-term interest rates. This is known as a restrictive monetary policy, which is not conducive to rising prices of utility stocks.
The fourth factor affecting utility stocks these days is a general level of rising interest rates. From 1981 through 2016, the overall trend for US interest rates was lower. During this time period, utility stocks enjoyed very little competition among interest rate products like government bonds, corporate bonds and certificates of deposit. The entire utility sector thrived in this type of environment. However, the tide has definitely turned during the past 12 months, as interest rates have started to push their way higher. As a result, utility stocks and utility ETFs are forced to compete against fixed-income products for investors’ dollars.
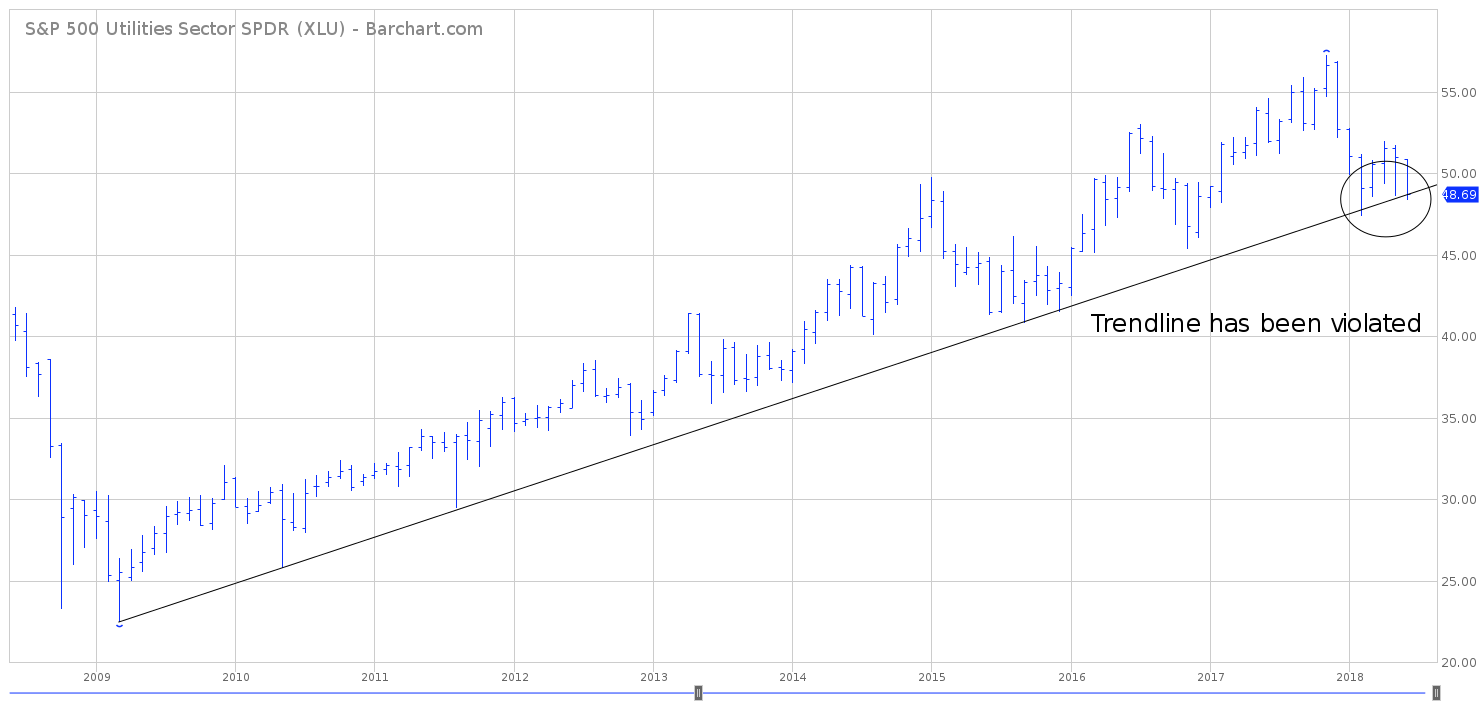
Specifically in regard to XLU, there appears to be an increasing likelihood that the ETF formed a secular top in November 2017 @ 57.23. Of course, it’s much too early to know for certain that a long-term top has been established. However, the empirical evidence suggests that we could be witnessing a secular shift from bullish to bearish. As you know, secular changes are extremely rare events, something that only occurs once every 20 to 30 years (or longer). Investors have a rare opportunity to establish a long-term short position in XLU as this trade unfolds.
Despite the recent decline in XLU, the long-term momentum still favors the bulls. Officially, a weekly close below 22.48 is required in order to reverse the bullish momentum. However, there are a few early warning signs which suggest that the bears are gaining the upper hand.
SHORT-TERM CHART – XLU
Please review the 6-month chart of XLU. The short-term chart pattern began to turn decidedly bearish in January. XLU made a feeble attempt to stage a bullish recovery during March and April. However, the rally was unsuccessful and the ETF is now rolling over to the downside. A weekly close below 47.37 will invite more selling pressure. The bulls need a weekly close above 52.91 to reverse the bearish chart pattern.
LONG-TERM CHART – XLU
Please review the 10-year chart of XLU. Over the course of the past ten years, the bulls have been in complete control of XLU. However, the bears are slowly beginning to gain the advantage. The long-term uptrend line was violated in February and June. This is a clear indication that XLU is on the verge of switching from bullish to bearish.


