SPDR Dow Jones Industrial Average ETF (DIA)
Key Statistics – DIA
Thank you for reading this post, don't forget to subscribe!
Minor Support Level 257.38 Minor Resistance Level 290.04
Major Support Level 80.96 Major Resistance Level 301.43
Minor Buy Signal 294.39 Minor Sell Signal 253.93
Major Buy Signal 308.47 Major Sell Signal 64.78
BRIEF OVERVIEW – DIA ETF
The Dow Jones Industrial Average (DJIA) has been in existence since it was launched by Charles Dow and Edward Jones on 26 May 1896. Without question, it is the most popular global stock market index among all major indices. When people discuss the stock market, 99% of the time they are referring to DJIA. Why has this stock market index maintained its popularity over the course of the past 12 decades? Because Dow and Jones were visionaries. They had the foresight to create a market index which represented a shift in the domestic economy from agrarian based to industrial based. Let’s briefly examine the details.
- American Cotton Oil Company American Sugar Refining Company
- American Tobacco Company Chicago Gas Company
- Distilling & Cattle Feeding Company General Electric
- Laclede Gas Company National Lead Company
- North American Company Tennessee Coal, Iron & Railroad Company
- US Leather Company US Rubber Company
Initially, DJIA consisted of only 12 stocks. However, all 12 stocks were industrial based. This was a very bold move by Dow and Jones. Why? Because in 1896, the United States was still heavily populated by farmers and ranchers. The “safe play” would have been for Dow and Jones to create a stock index based on agriculture companies. However, the two men were convinced that the United States was on the verge of transitioning from agriculture to industrialization. Of course, their vision turned out to be correct. This explains why DJIA has maintained its popularity over the past several decades. Although Dow and Jones passed away in 1902 and 1920 respectively, they created a forward-thinking culture that still exists today.
During the past 124 years, the components of DJIA have changed 53 times. Each time the index was altered, Dow Jones & Company made a concerted effort to maintain a list of companies that represented the future direction of the US economy. For example, the companies that currently comprise the Dow Jones Average are primarily technology based. Why? Because today’s economy is heavily influenced by technology and telecommunications. Additionally, 100% of the DJIA companies have a global presence. Of course, there’s no denying the fact that we live and work in a global environment. Therefore, it makes perfect sense for the companies within DJIA to have a multi-national background.
Dow Jones & Company was the sole owner and daily administrator of DJIA from 1896 through 2007. In May 2007, News Corp made a $5 billion bid for Dow Jones & Company. The transaction was officially completed in December 2007. In February 2010, News Corp sold a portion of Dow Jones & Company to CME Group. Specifically, CME Group purchased the Dow Jones Index. Consequently, CME Group became responsible for managing DJIA. In July 2012, CME Group joined forces with McGraw-Hill by forming S&P Dow Jones Indices. The new company became the largest provider of financial indices on a global basis. Today, the Dow Jones Industrial Average is stronger than ever in terms of popularity within the global investment community. It still remains the most widely recognized stock index in the world.
The SPDR family of exchange traded funds (underwritten by State Street Global Advisors) introduced the Dow Jones Industrial Average ETF on 14 January 1998. The ticker symbol is DIA. This ETF is a perfect vehicle for investors who wish to participate in the performance of DJIA. DIA is an extremely popular ETF, with an average daily volume of nearly six million shares. The ETF is commonly referred to as “Diamonds.”
SHORT-TERM VIEW – DIA ETF
The bulls are in complete control of the short-term momentum. The next level of resistance is 290.04. The bulls have been in control of DIA for the past seven months. In order to recapture the short-term momentum, the bears need a weekly close below 257.38.
Based on the Aroon Oscillator, DIA has an extremely overbought reading of +96. The Aroon Oscillator is programmed differently than most stochastic indicators. The oscillator fluctuates between -100 and +100. A reading of 0 would indicate a neutral position. Therefore, a reading of +96 with DIA is considered extremely overbought. However, speculative markets can remain overbought for extended periods of time. Even though the oscillator reading is +96, DIA could easily continue to move higher.
LONG-TERM VIEW – DIA ETF
As we discussed previously, the Dow Jones Industrial Average has been in existence for 124 years. Despite its long history on Wall Street, several misconceptions still exist within the global investment community concerning the world’s most popular stock index. The most glaring misconception centers around the performance of DJIA following major geopolitical events. In fact, now is a great time to shine a spotlight on this particular subject matter. Why? Because the United States is currently in the middle of a rather heated skirmish with Iran. Additionally, there is an ongoing trade war between the US and China. How do geopolitical events affect the performance of DJIA? Let’s examine the details.
Of course, most investors believe that geopolitical events negatively impact the stock market. In other words, equity prices decline when unexpected events occur. Is this true? Does DJIA actually decline in this type of environment? Please review the following table.
Major Geopolitical Events
Description Beginning Ending Annual Return
World War I 28 Jul 1914 11 Nov 1918 8.7%
World War II 1 Sep 1939 2 Sep 1945 8.3%
Korean War 25 Jun 1950 27 Jul 1953 16.0%
Cuban Missile Crisis 10 Oct 1962 28 Oct 1962 (1.2%) *
Vietnam War 8 Mar 1965 27 Jan 1973 5.3%
9/11 Terrorist Attack 11 Sep 2001 11 Sep 2001 (7.1%) *
US Invades Iraq 19 Mar 2003 1 May 2003 3.2% *
US Kills Iranian Leader 3 Jan 2020
* Total Return | Daily loss when DJIA reopened on 17 Sep | Total Return
As you can see from the table, major geopolitical events are rarely bearish for stock prices. In fact, equity markets usually rally following a major war or global crisis. Arguably, the most shocking geopolitical event in our nation’s history ensued on 11 September 2001, with the destruction of the World Trade Center. Following the attack, Wall Street was shut down for 16 days. The New York Stock Exchange reopened on 17 September. The initial “knee jerk” reaction was a sharp decline. DJIA fell 7.1% when stocks resumed trading. A few days later, the Dow hit bottom @ 8062. DJIA spent the next 12 months grinding its way higher. On the 1-year anniversary of the 911 attacks, the Dow was ahead by 6.4%.
Generally speaking, investors have always been baffled by the fact that stock prices actually increase following sudden unexpected geopolitical events. Why does this happen? Why do equity markets typically rally in the face of a disruptive event? The common belief within the investment community is that Wall Street hates uncertainty. What could be more uncertain than an unexpected geopolitical event? If these events cause nervousness and uncertainty among investors, why do stocks have a history of moving higher? Because geopolitical events encourage government leaders and monetary authorities to stimulate the domestic economy in order to offset the possible reduction in consumer confidence and consumer spending. As these events unfold, consumers typically “reign in” their spending habits. Consequently, governments will introduce policies designed to maintain economic growth. Quite often, these new policies (whether they be fiscal or monetary) are incredibly stimulative. Therefore, stock prices have a tendency to move higher, despite the geopolitical event.
As long as politicians and monetary leaders react to global crises by “throwing money” at the problem, stock prices will rise, even if these events cause uncertainty among investors. Always remember, speculative markets love to do the opposite of what most people expect. They are designed to frustrate as many people as possible.
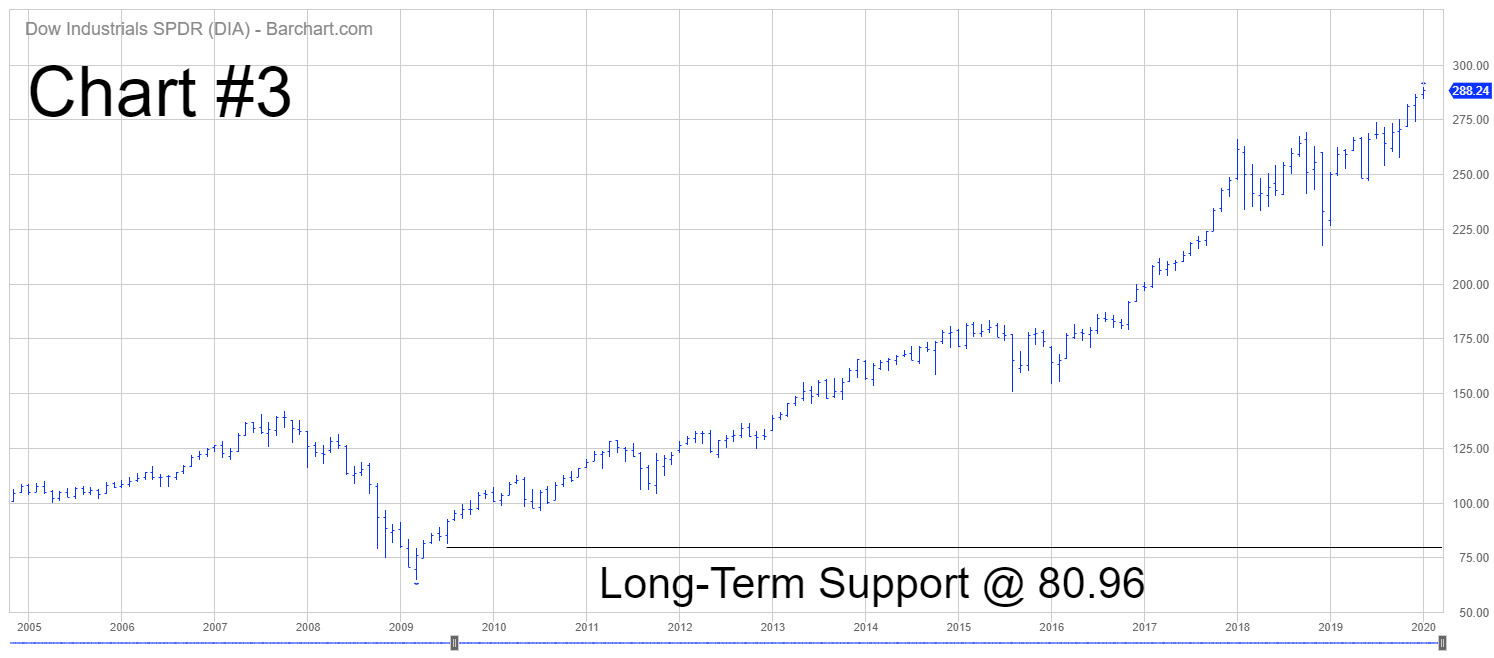
If we examine a long-term chart of the Dow Jones Industrial Average, an argument can be made that stocks have been in an uninterrupted bull market since the early 1980s. The only brief interruption was the Global Financial Crisis in 2008 (Chart #1). History would suggest that our nation’s equity markets are way overdue for an extended bear market. However, the current bull market could easily continue for several more years. It’s impossible to pick the final top.
In terms of the current long-term trend, the bulls are in complete control of DIA. The recent geopolitical event between the United States and Iran has not changed the bullish momentum. The next resistance level is 301.43. In order for the bears to gain the upper hand, a weekly close below 80.96 is needed.

SHORT-TERM CHART
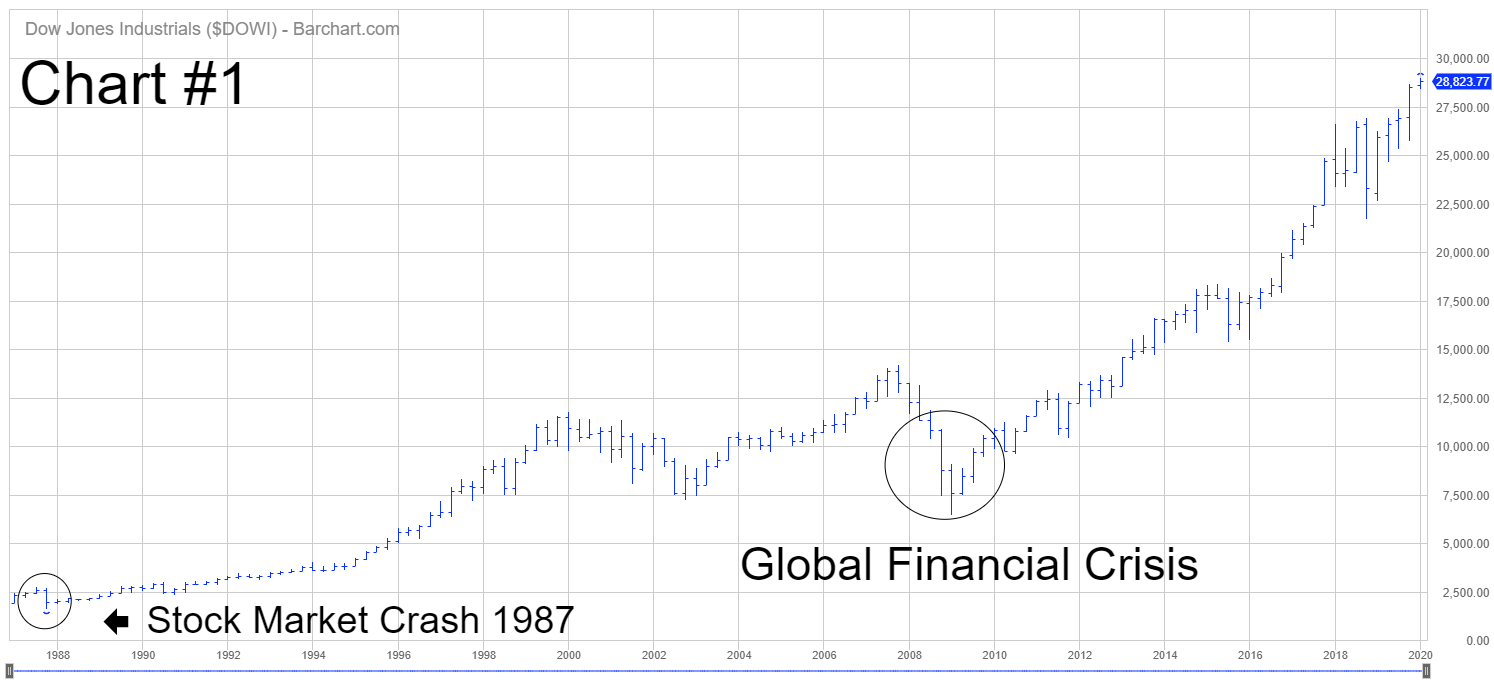
Please review the 6-month chart of DIA (Chart #2). The short-term chart pattern remains incredibly bullish. The next level of resistance is 290.04. Eventually, the chart pattern will flip in
favor of the bears. However, it’s never a good idea to pick a top. Instead, wait for the trend to reverse course. The important number to watch is a weekly close below 257.38.
LONG-TERM CHART
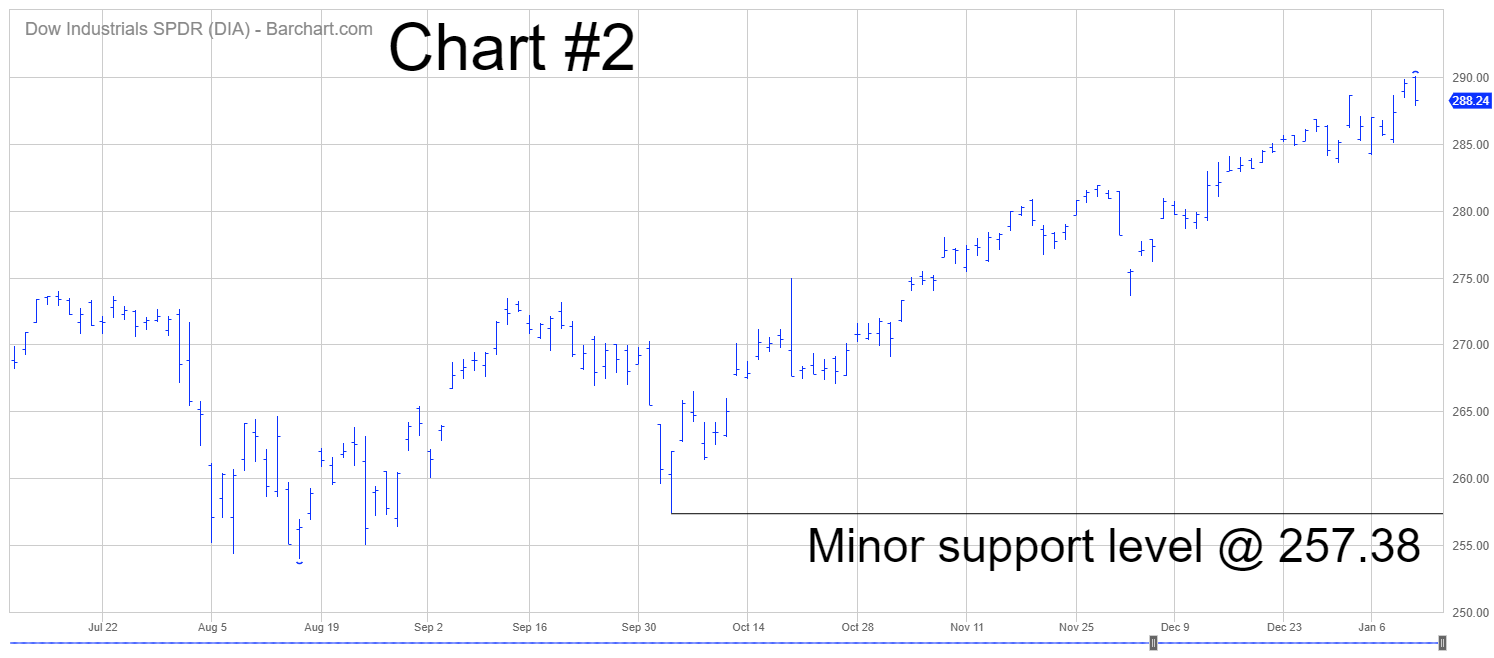
Please review the attached 15-year chart of DIA (Chart #3). The bulls are in complete control of the long-term chart pattern. The next resistance level is 301.43. In order for the bears to gain the upper hand, a weekly close below 80.96 is needed. The bulls have been in control of the long-term trend for several years. Eventually, the trend will flip from bullish to bearish. However, it’s impossible to accurately forecast the final top.