

Invesco QQQ ETF (QQQ)
Key Statistics
Minor Support Level 185.27 Minor Resistance Level 207.91
Thank you for reading this post, don't forget to subscribe!Major Support Level 41.77 Major Resistance Level 222.04
Minor Buy Signal 213.31 Minor Sell Signal 181.16
Major Buy Signal 230.77 Major Sell Signal 38.46
BRIEF OVERVIEW
The United States equity markets consist of two major exchanges, the New York Stock Exchange (NYSE) and the NASDAQ Exchange. As measured by daily trade volume and number of listed securities, NASDAQ is the largest exchange in North America. As of 13 December, there are 3,551 listed companies. Average daily volume is 2.2 billion shares. During a typical day, the NASDAQ Exchange will conduct over 13 million trades.
NASDAQ contains several different sub-indices. Arguably, the most popular sub-index is the NASDAQ-100. As the name implies, the NASDAQ-100 includes 100 of the largest domestic and international non-financial companies listed on the NASDAQ stock market based on market capitalization. The index reflects companies across major industry groups. The groups include computer hardware, computer software, telecommunications, retail trade and biotechnology. The index does not contain securities which represent financial or investment companies.
The NASDAQ-100 was launched on 31 January 1985. The base price of the index was initially set at 250. On 31 December 1993, the index was adjusted to 125 in order to allow for the trading of index options on the Chicago Board Options Exchange (CBOE) which was rolled out in 1994. In January 1998, foreign companies were allowed to be listed on the NASDAQ-100, which dramatically increased the popularity of the index with international investors.
In an effort to provide investors with exposure to the NASDAQ-100, the PowerShares family of exchange traded funds launched the Invesco QQQ ETF on 10 March 1999, using the ticker symbol QQQ. This ETF allows investors the opportunity to track the performance of the NASDAQ-100. Although the index consists of 100 different companies, QQQ is comprised of 104 different securities. This discrepancy exists because three of the companies within the NASDAQ-100 have more than one class of common stock. These companies include Alphabet, Comcast and Facebook. The five largest holdings within QQQ are Microsoft, Apple, Amazon, Alphabet “C” and Facebook “A.” These stocks have a substantial impact on the overall performance of QQQ because they represent approximately 40% of the overall value of the ETF.
SHORT-TERM VIEW
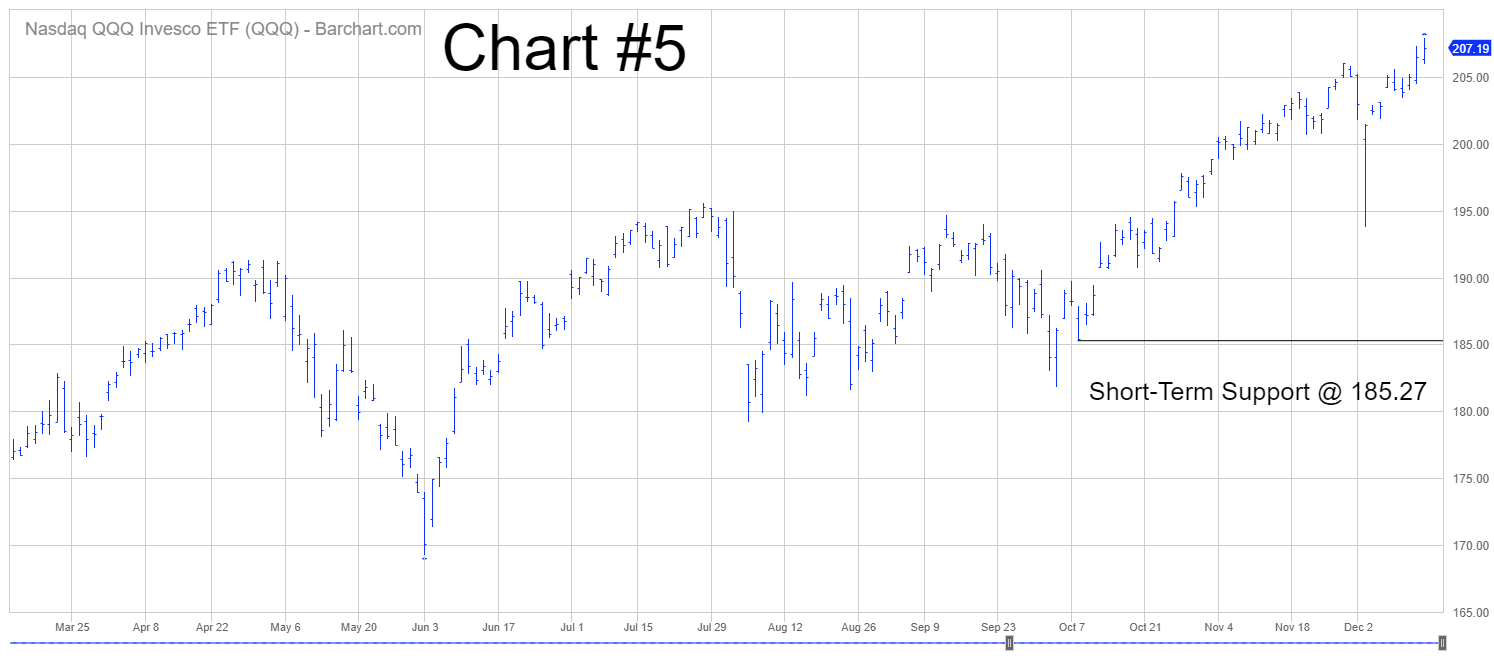
QQQ has enjoyed a massive rally during past six months. The bulls are in complete control of the short-term momentum. The next level of resistance is 207.91. In order to regain the upper hand, the bears need a weekly close below 185.27. At least for now, the most likely scenario is a continuation of higher prices.
LONG-TERM VIEW
Arguably, the NASDAQ-100 is the most volatile stock index in North America. Why? Because the index consists primarily of technology stocks. Based on historical results, technology companies generate the most volatile and unpredictable revenue streams. Consequently, it’s very difficult for financial analysts to accurately forecast quarterly earnings results. Technology is constantly changing. This explains why these companies are difficult to analyze from a financial perspective.
During the past 6 years, the FANG stocks have been responsible for leading the NASDAQ-100 to sharply higher prices. For those of you who are not familiar with the acronym, FANG consists of Facebook, Amazon, Netflix and Google. Despite the fact that the NASDAQ-100 continues to grind its way higher into record territory, many Wall Street analysts are concerned that the index could be on the verge of rolling over to the downside. Why? Because the FANG stocks have performed rather poorly during the past 12 to 18 months. Let’s briefly examine each FANG stock.
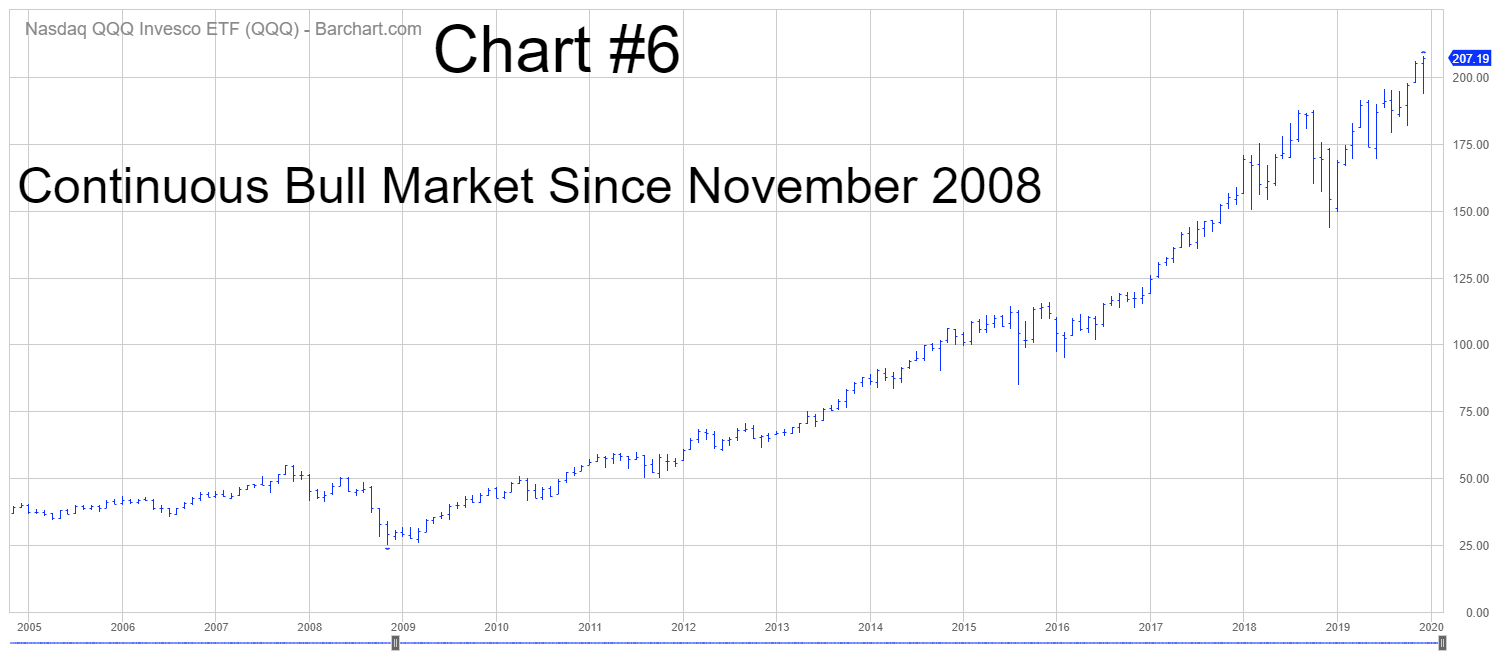
Facebook (FB) has performed fairly well during the past 12 months. After suffering through a disastrous public relations nightmare in 2018, the company has repaired its image and the stock has been pushing its way higher since January. Despite the strong advance throughout 2019, FB has been unable to penetrate its all-time high from July 2018 @ 218.62. Until FB generates a new ATH, the stock is vulnerable to a nasty decline. Please review Chart #1.
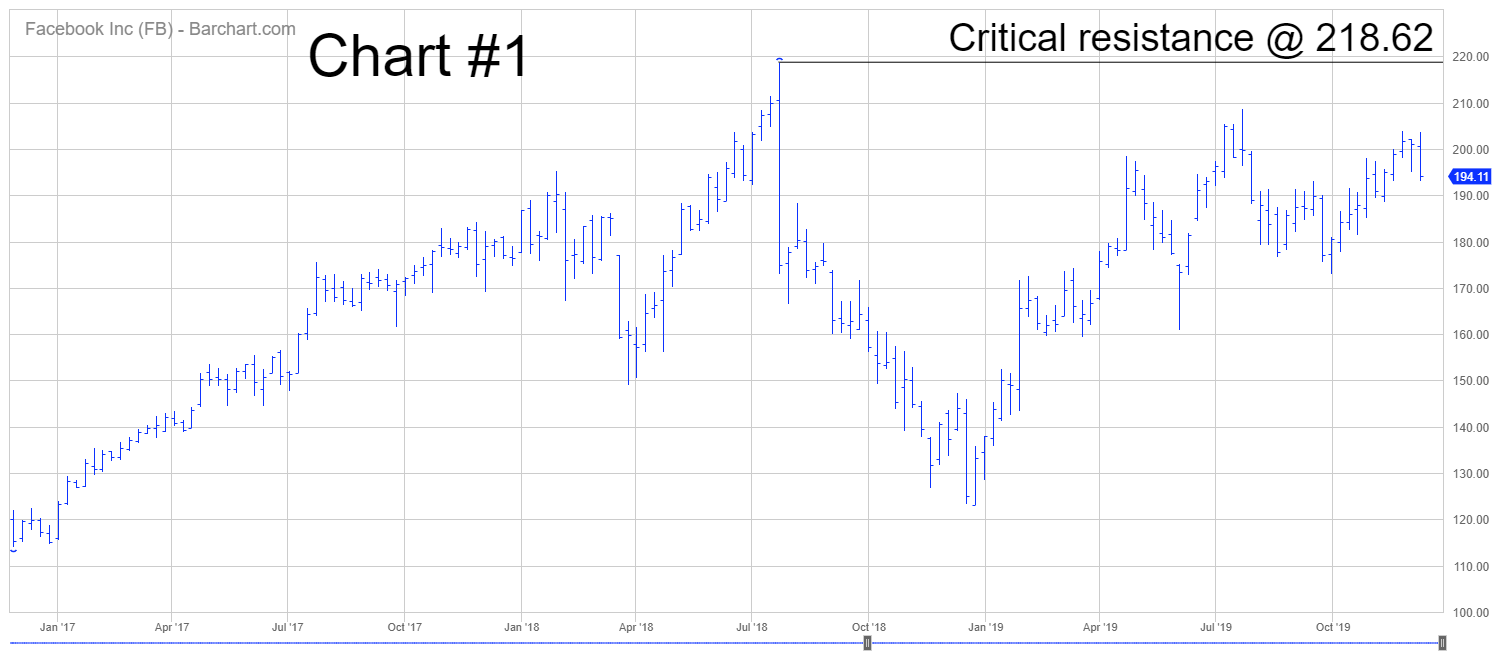
Amazon (AMZN) enjoyed an incredibly bullish move from 2015 through mid-2018. Specifically, AMZN skyrocketed 619% during a 44-month window (01/2015 – 08/2018). However, during the past 16 months, the stock has struggled. Despite record sales and a complete domination of the retail industry, AMZN has been unable to penetrate its old high of 2050.50 from 5 September 2018. What happened? Why has the company been unable to achieve a new ATH since mid-2018? The most logical answer appears to be that the stock is simply taking a break from its dramatic move from 2015 – 2018. Most likely, AMZN is consolidating its gains before it takes off on another historic advance. However, until the stock records a new ATH, investors will remain cautious. Please review Chart #2.
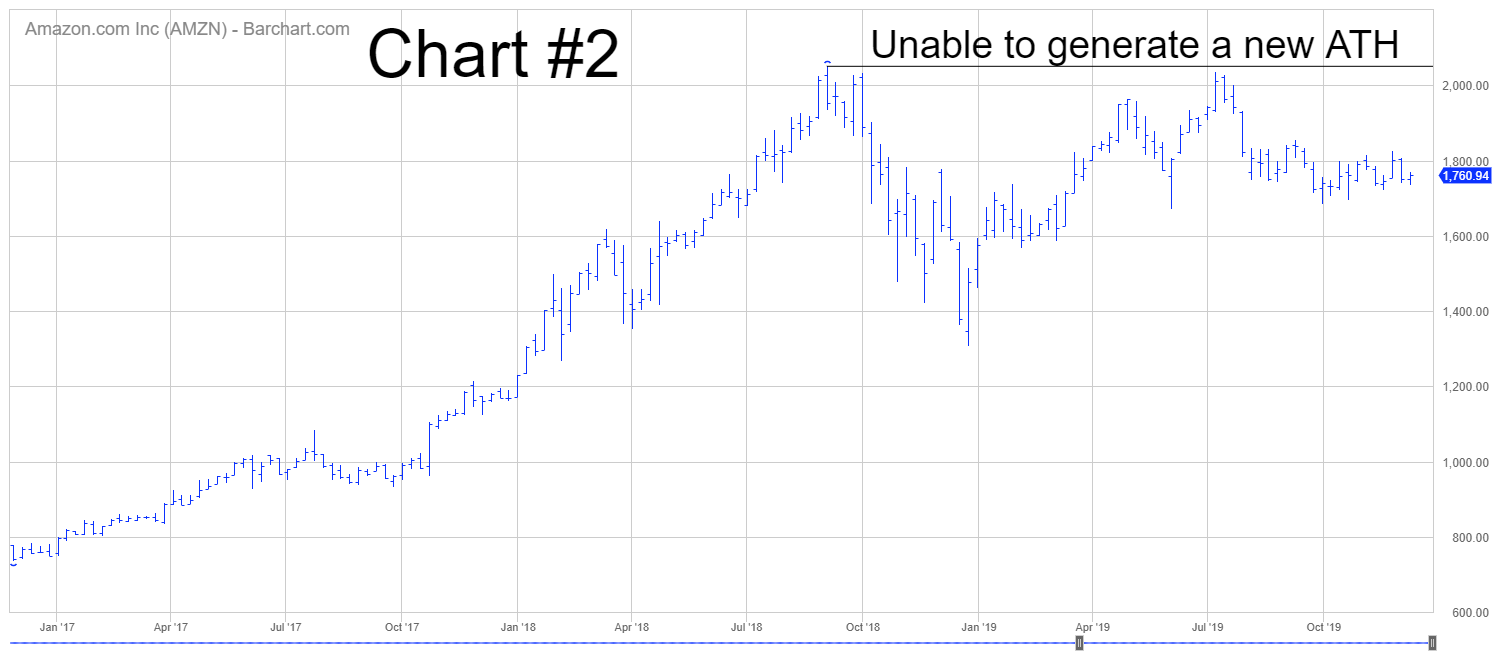
From 2010 through 2018, Netflix (NFLX) was the “darling” of the NASDAQ. The company could do no wrong. Everything the company touched turned to gold. From 2010 through mid-2018, NFLX enjoyed a parabolic move of 5,277%. Netflix was considered the industry leader in terms of providing video streaming and media services. However, during the past 24 months, the video streaming industry has witnessed a dramatic increase in the number of companies now offering streaming and media services. The list would include some of the “heavy hitters” like Disney, Amazon, Wal-Mart, WarnerMedia and NBCUniversal. Some of the giants within the entertainment industry (Disney, WarnerMedia and others) are no longer allowing Netflix to stream its original content. Consequently, Netflix has lost a tremendous amount of programming for its video streaming business. For the first time in 10 years, Netflix is no longer adding new subscribers. The stock has been under pressure during the past 18 months as Netflix struggles to adapt to an increase in competition. Please review Chart #3.
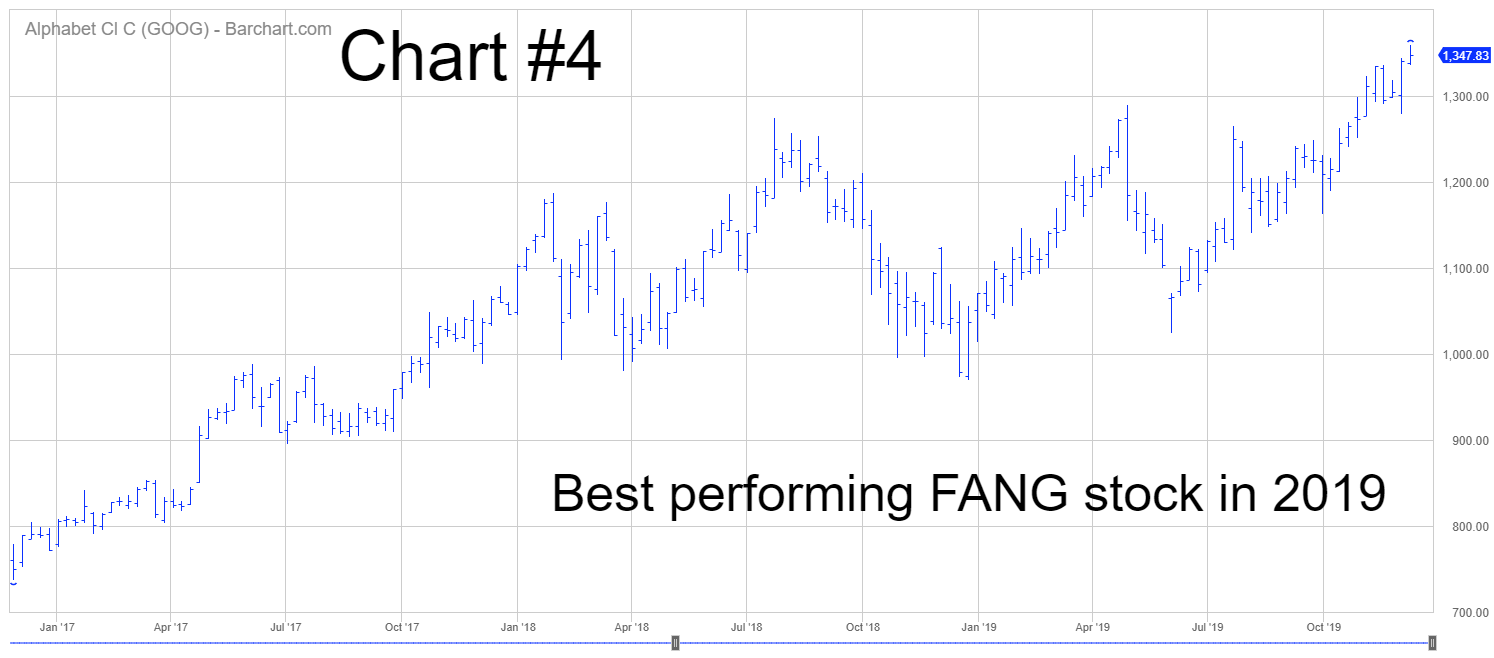
Without question, Google (GOOG) has been the best performer among the FANG stocks. GOOG continues to grind its way higher. In July 2018, the stock generated an important top @ 1273.89. For several months, it appeared that Google would suffer the same fate as Amazon and Netflix in terms of the stock price forming a long-term top. However, GOOG “bucked the trend” by recording a new ATH in April. During the past few months, the stock has continued to generate several new all-time highs. Please review Chart #4.
Has the recent poor performance in the FANG stocks laid the groundwork for a bear market in the NASDAQ-100? At least for now, the answer is “No.” The index continues to grind its way higher into record territory almost on a daily basis. Essentially, a new group of stocks have been responsible for propelling the index higher. The list includes AMD, LRCX, KLAC and AMAT. These technology stocks have replaced FANG as the new leaders of the NASDAQ-100. This is known as sector rotation. As long as a new group of stocks are able to serve as performance leaders within the index, the NASDAQ-100 will continue produce new highs on a regular basis.
The vast majority of Wall Street professionals were convinced that the NASDAQ-100 would fall into bear market territory if the FANG stocks began to unravel. This forecast turned out to be completely wrong. It certainly appears as though FANG has been successfully replaced by a new group of leaders. At least for now, the NASDAQ-100 bull market is alive and well.
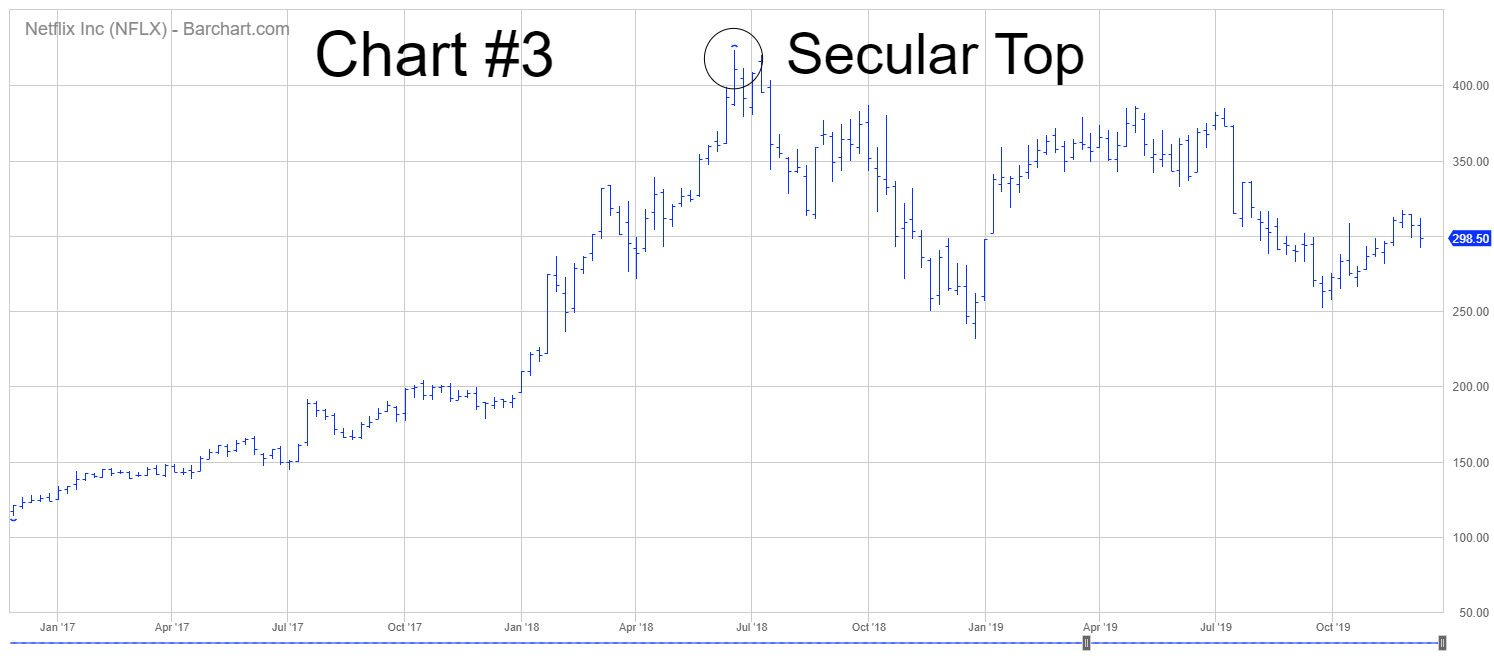
In regard to QQQ, the ETF has enjoyed an incredible bull market advance during the past decade. The long-term view is clearly in favor of the bulls. The next resistance level is 222.04. In order to reverse the long-term momentum, the bears need a weekly close below 41.77. Of course, this type of decline is highly unlikely in the foreseeable future.
SHORT-TERM CHART
Please review the 9-month chart of QQQ (Chart #5). In terms of the short-term chart pattern, the ETF has been pushing its way higher since December 2018. There was a brief decline in May. However, the bulls managed to quickly re-establish the upward bias. The next level of resistance is 207.91. In order to regain the upper hand, the bears need a weekly close below 185.27.
LONG-TERM CHART
Please review the 15-year chart of QQQ (Chart #6). The long-term chart pattern has been continuously bullish since November 2008. This is one of the most bullish chart patterns within the entire ETF universe. At least for now, the bears have very little chance to push the chart pattern in their favor. A weekly close below 41.77 will reverse the trend from bullish to bearish. Highly unlikely.

