SPDR Dow Jones Industrial Average ETF (DIA)
Key Statistics
Thank you for reading this post, don't forget to subscribe!
Minor Support Level 226.45 Minor Resistance Level 276.38
Major Support Level 112.14 Major Resistance Level 304.68
Minor Buy Signal 281.36 Minor Sell Signal 218.12
Major Buy Signal 313.49 Major Sell Signal 101.33
BRIEF OVERVIEW – DIA ETF
Arguably, the Dow Jones Industrial Average (DJIA) is the most famous stock market index of all-time. Charles Dow and his business partner, Edward Jones, calculated the first reading of DJIA on 26 May 1896. The first reading was 62.76. Over the course of the past 124 years, DJIA has increased 43,536%. An investment of $1,000 in the Dow Jones Industrial Average in 1896, is today worth $435,360. This represents one of the greatest investments in the history of financial speculation. Where do we go from here? Will DJIA continue to grind its way higher or is the stock market on the verge of a multi-year bear market? Let’s examine the details.
Before we study the performance of DJIA, let’s review the companies listed within this famous stock index. As we mentioned, the Dow Jones Industrial Average was launched on 26 May 1896. The original index consisted of 12 companies. Please review the following table.
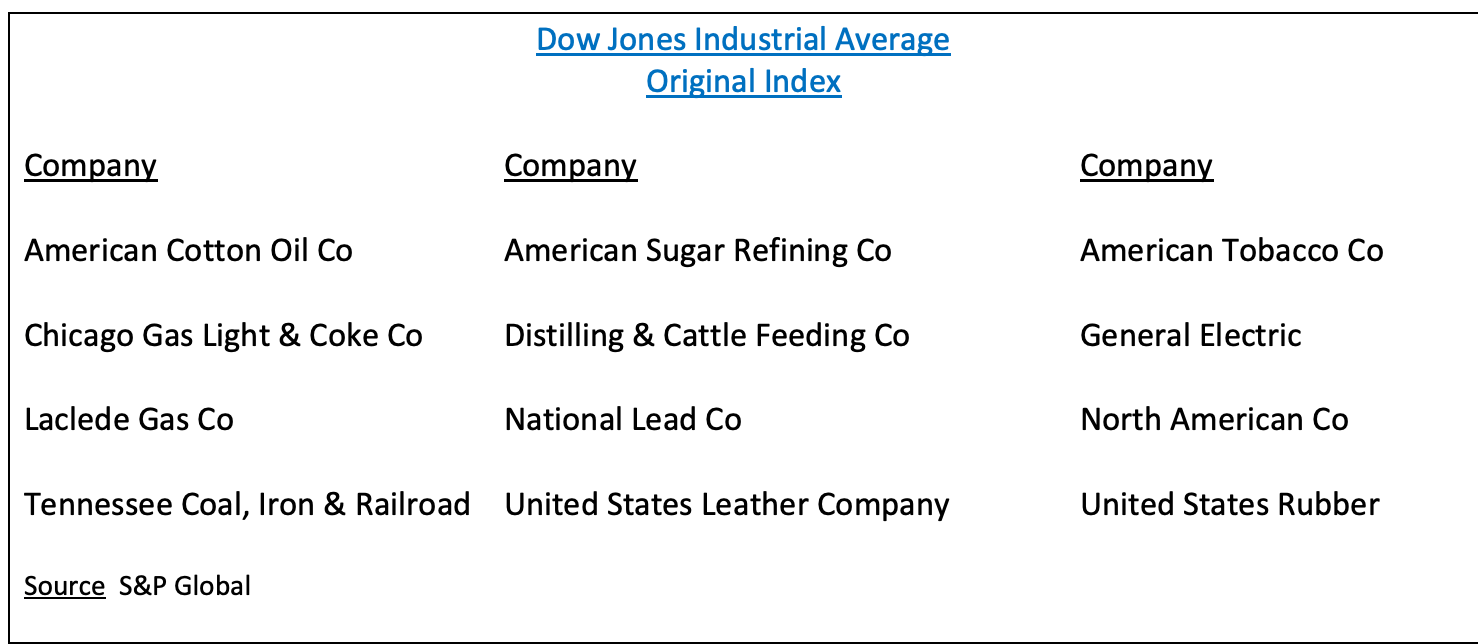
As you can see from the table, the original Dow Jones Industrial Average consisted entirely of industrial companies. There were no technology companies or financial services companies. In 1896, the United States was in middle of the Second Industrial Revolution. Therefore, Charles Dow and Edward Jones did a great job of selecting an appropriate list of companies which represented the US economy.
During the past 124 years, DJIA has been changed 55 times. Each change was designed to reflect the current state of the domestic economy. The Dow Jones Company took great pride in its stock market index. Dow Jones only made changes to the index when it was absolutely necessary.
Originally, DJIA consisted of 12 companies. It wasn’t until 1928 when the index was expanded to its current level of 30 companies. Please review the following table.
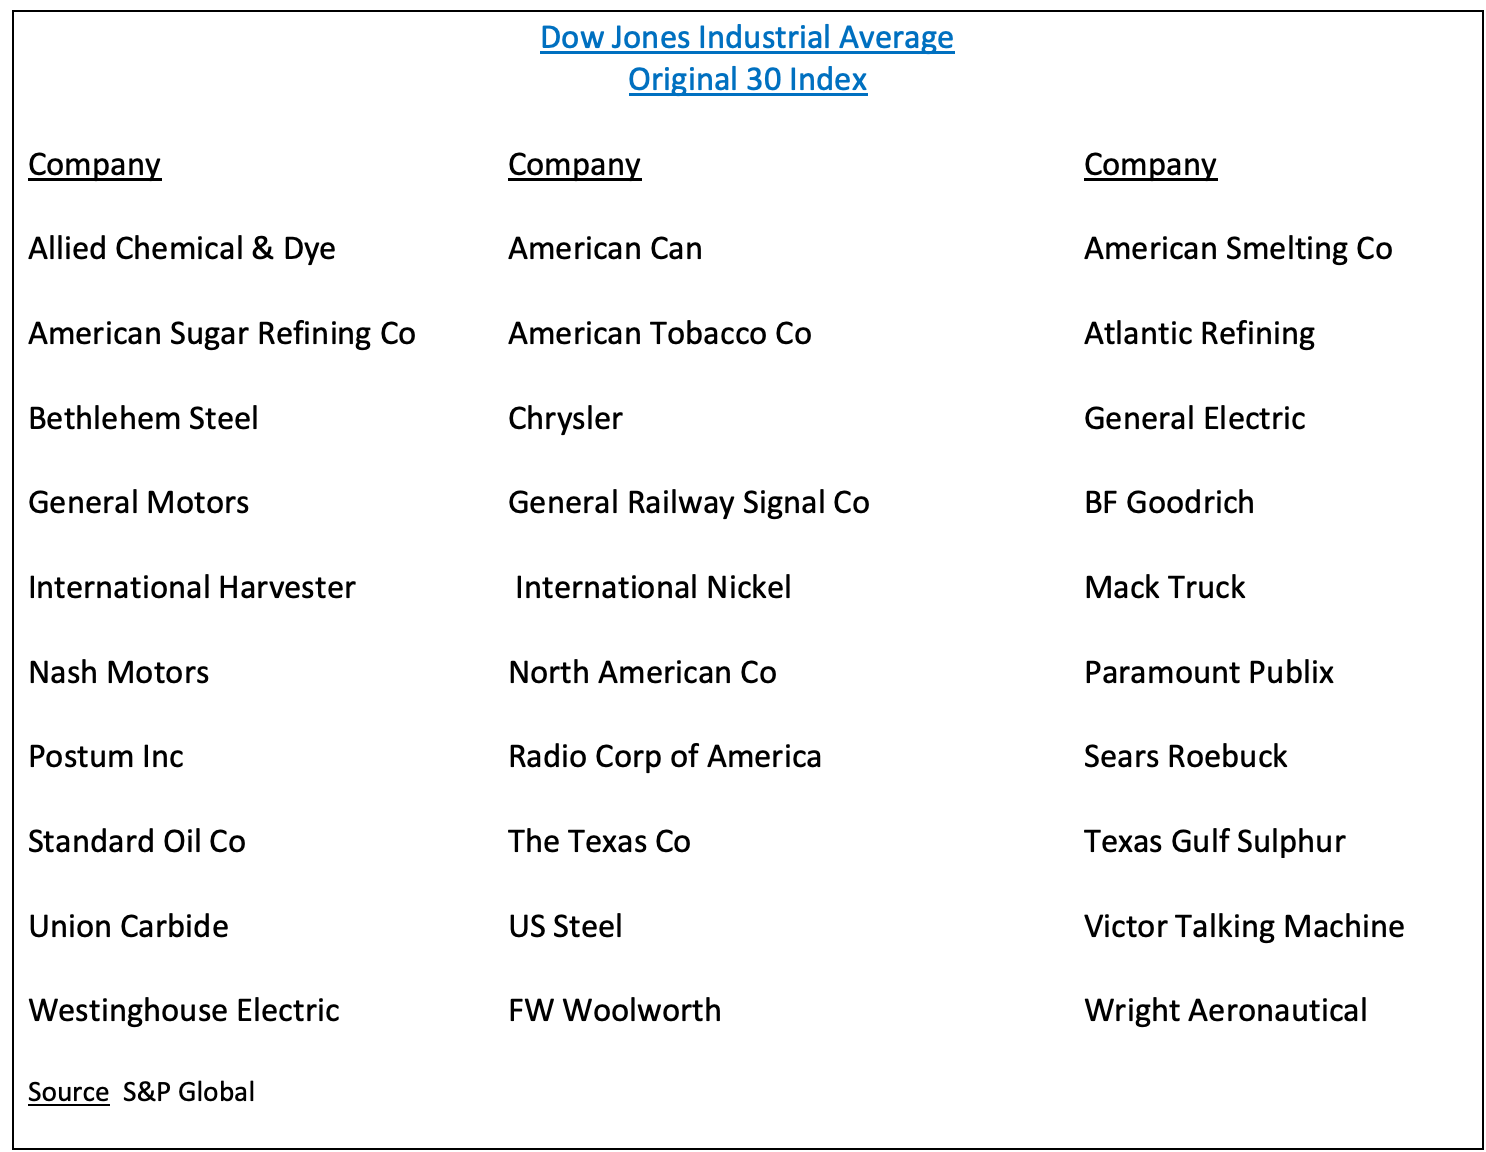
The original Dow 30 was released on 1 October 1928. For the first time in the history of the index, Charles Dow and Edward Jones added companies outside of the industrial and manufacturing sector. FW Woolworth and Sears Roebuck made the list of the original Dow 30. These two retail companies were a clear indication that American consumers were enjoying their highest standard of living in the history of the United States. The Roaring 20s was a great time to be alive in terms of workers’ wages and improved working conditions. The Dow Jones Index began to reflect the shift in the nation’s attitude about spending money and enjoying more leisure time with friends and family.
Let’s fast forward to the current list of the Dow Jones Industrial Average, which was rolled out to investors on 6 April 2020. Compared to the original list of 30 companies in 1928, the 2020 version has witnessed some dramatic changes. Of course, these changes represent the radical shift that has occurred in our nation’s economy during the past century. Please examine the 2020 version of the Dow Jones Industrial Average.
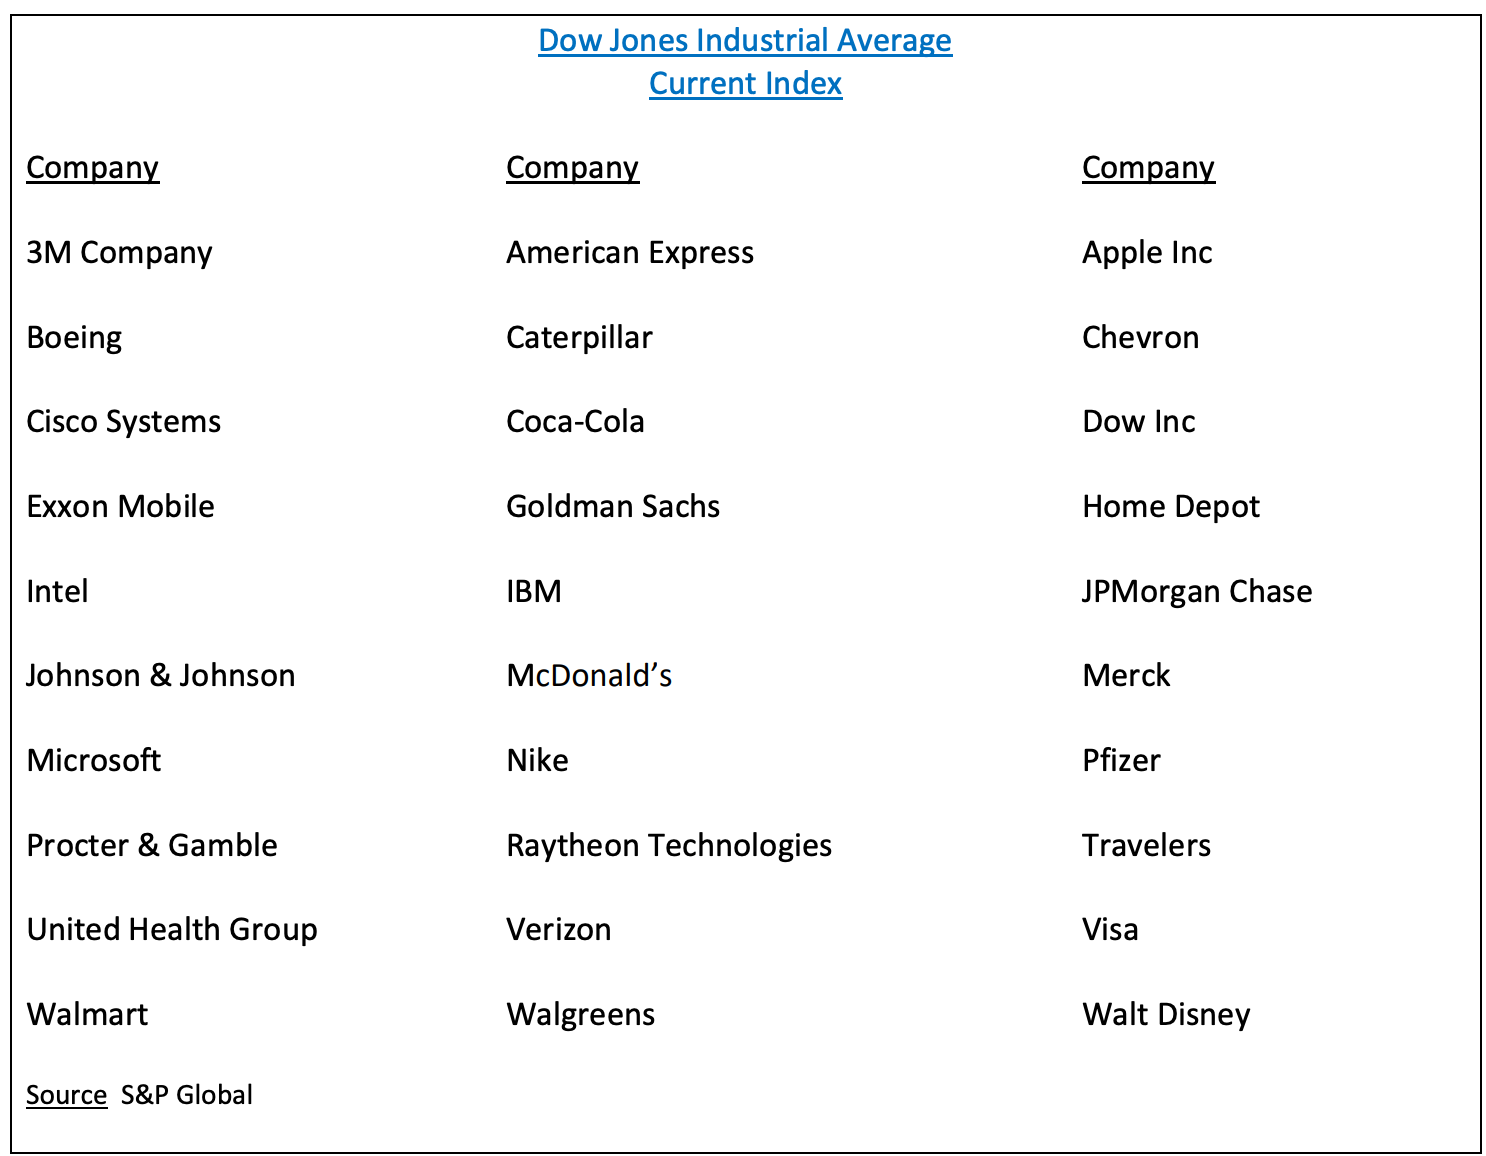
The most notable difference between 1928 and 2020, is the fact that none of the companies from the 1928 index were able to make the cut in 2020. Every single member of the 1928 DJIA has disappeared. This is a perfect example of the radical transformation that has occurred within the US economy during the past several decades.
1928 Dow Jones Industrial Average
- 28 industrial companies
- 2 retail companies
2020 Dow Jones Industrial Average
- 8 industrial companies
- 7 technology companies
- 6 retail companies
- 5 financial services companies
- 2 pharmaceutical companies
- 1 health care company
- 1 entertainment company
As you can see from the list, the number of industrial companies declined by 67% between 1928 and 2020. The industrial companies were replaced by technology and financial services.
Charles Dow and Edward Jones passed away in 1902 and 1920 respectively. Despite their passing, DJIA continues to provide an excellent representation of the US economy. Today, the Dow Jones Index is owned by S&P Global. The index is more popular than ever, particularly among European investors. Most likely, the Dow Jones Industrial Average will go down in the record books at the greatest stock market index of all-time.
The SPDR family of exchange traded funds (managed by State Street Global Advisors) introduced the Dow Jones Industrial Average ETF on 14 January 1998. The ticker symbol is DIA. This ETF is a perfect vehicle for investors who wish to participate in the performance of DJIA. DIA is an extremely popular ETF, with an average daily volume of nearly three million shares. The ETF is commonly referred to as “Diamonds.”
SHORT-TERM VIEW – DIA ETF
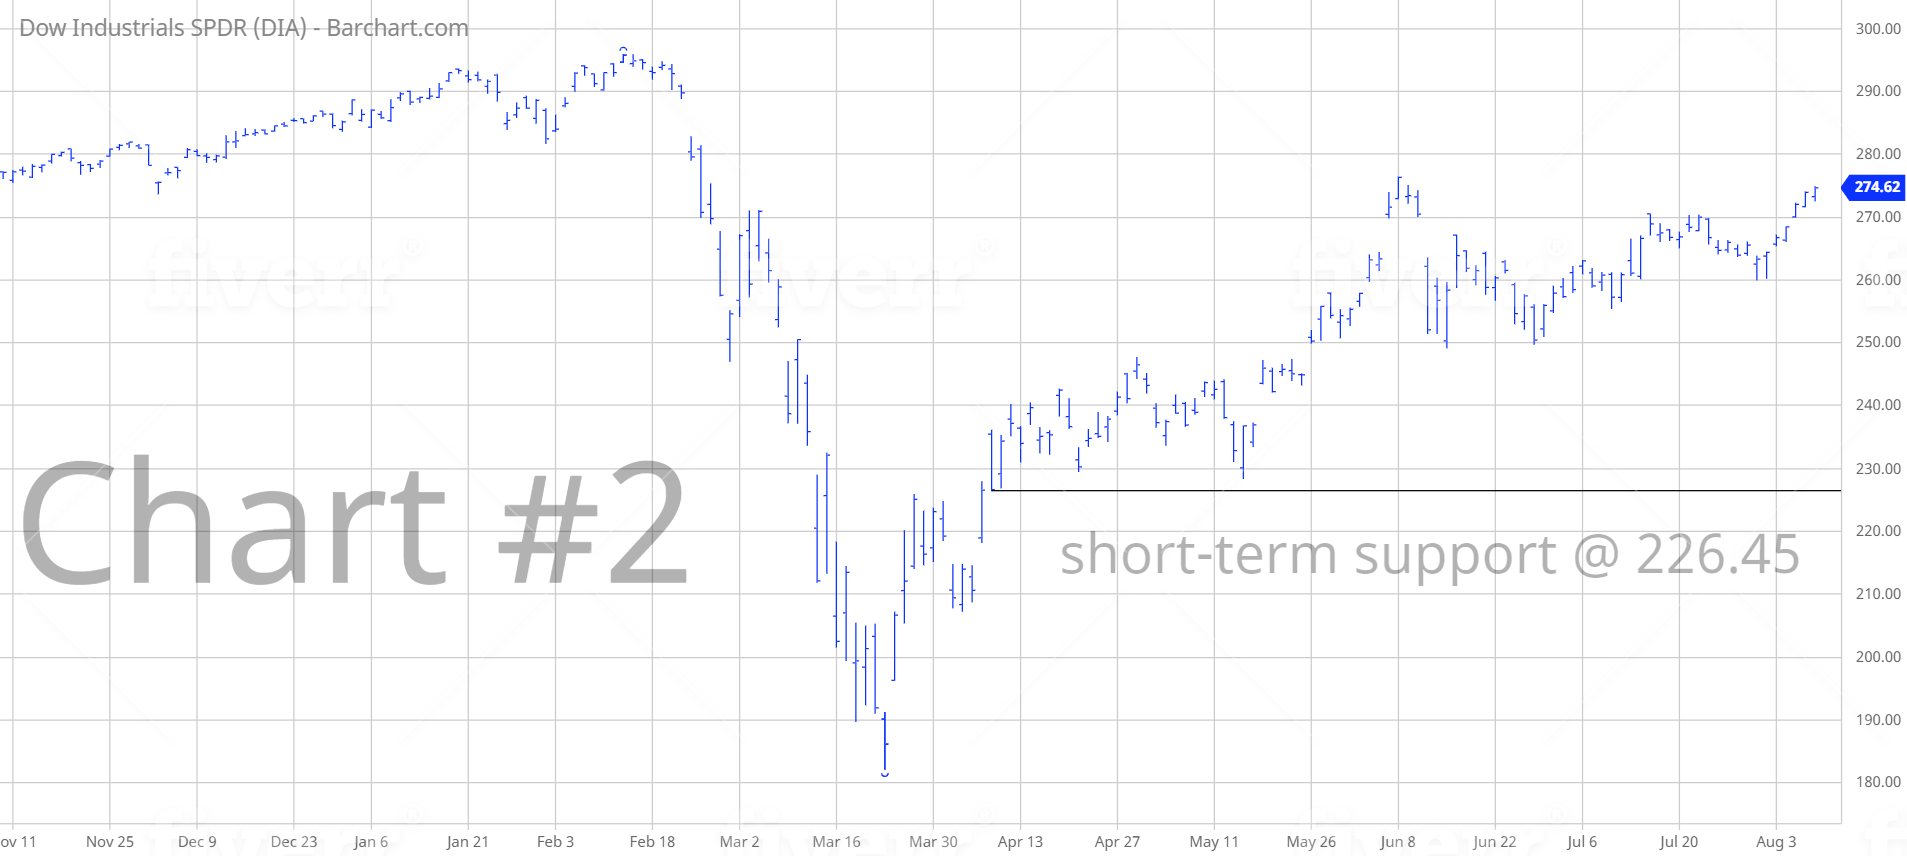
Despite the brutal decline following the coronavirus in March, DIA has enjoyed a dramatic recovery. The bulls are in control of the short-term momentum. The next level of resistance is 276.38. The bears need a weekly close below 226.45 in order to recapture the momentum.
LONG-TERM VIEW – DIA ETF
The US economy has experienced several transformations since DJIA was launched in 1896. When Charles Dow and Edward Jones calculated the first price level of the Dow Jones Index, over 40% of the American population generated their income through farming. Today, less than 1% of Americans are farmers. DJIA has followed this transformative process through its selection of stocks within the Dow Jones Index. Today, 40% of the index is comprised of technology and financial services. Most likely, this trend will persist, as technological advances continue to disrupt all industries within the global economy.
Despite occasional bear markets, the long-term trend for the Dow Jones Industrial Average is bullish. Please review the 33-year chart of DJIA (Chart #1). Since 1987, the index has experienced only four bear markets. The most recent bear market occurred in March 2020, in response to the global pandemic. Officially, the bear market won’t end until DJIA generates a new all-time high above 29568. For now, it appears that the bear market probably ended on 23 March. If so, this will be the shortest bear market in the history of the Dow Jones Index.
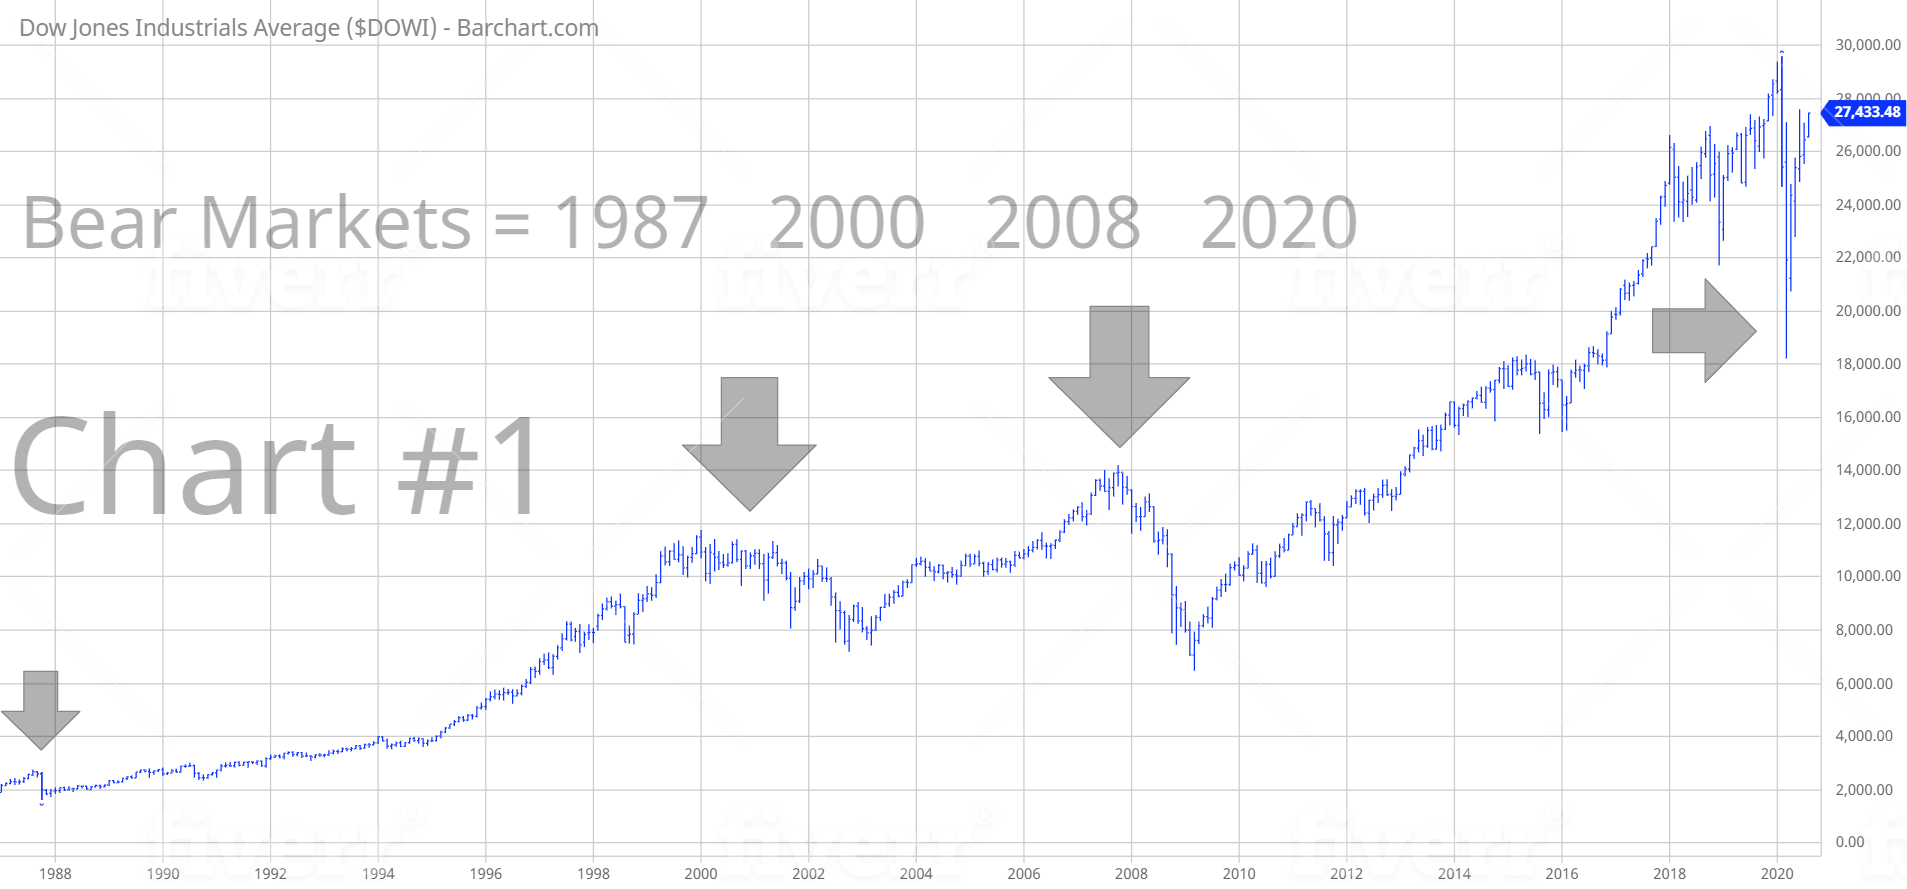
Why have equities experienced such a small number of bear markets during the past four decades? Many people believe that excessive Federal Reserve money printing is the main reason why stocks have enjoyed an incredible bull run for the past 30+ years. While there is no arguing the fact that global central banks have flooded the banking system with incredible amounts of cheap money, the main contributing factor to higher equity prices can be attributed to major advancements in technology during the past few decades. Technological innovations have resulted in a sharp rise in worker productivity. In fact, technology has improved the labor market to such an extent that workers are no longer even needed in several industries. Most likely, this trend will continue for the next several years. Consequently, corporations will enjoy substantial reductions in labor costs, which will reduce expenses and increase earnings. As a result, stock prices will continue to rise.
The vast majority of today’s investors cannot explain why the stock market is rising despite the worst economic collapse in modern American history. Certainly, central bank money printing has played a key role in pushing the stock market to much higher levels. However, excessive money printing only provides a short-term boost to equity prices. The long-term contributor to a higher stock market is major advances in technology. This explains why S&P Global continues to methodically increase the number of technology companies within the Dow Jones Industrial Average. Based on historical changes to the Dow Jones Index, 70% of DJIA will be comprised of technology-based companies within the next 20 years. In order to remain relevant well into the future, S&P Global is fully aware that DJIA needs to consistently increase its exposure to technology companies.
In regard to DIA, the long-term momentum is bullish despite the brutal decline in February and March. The next resistance level is 304.68. The bears had an opportunity to recapture the momentum in March. However, they never were able to penetrate the major support level @ 112.14. The most likely scenario is a continuation of higher prices.
SHORT-TERM CHART – DIA ETF
Please review the 9-month chart of DIA (Chart #2). The short-term trend is bullish. The next level of resistance is 276.38. The bears need a weekly close below 226.45 in order to push the chart into bearish territory.
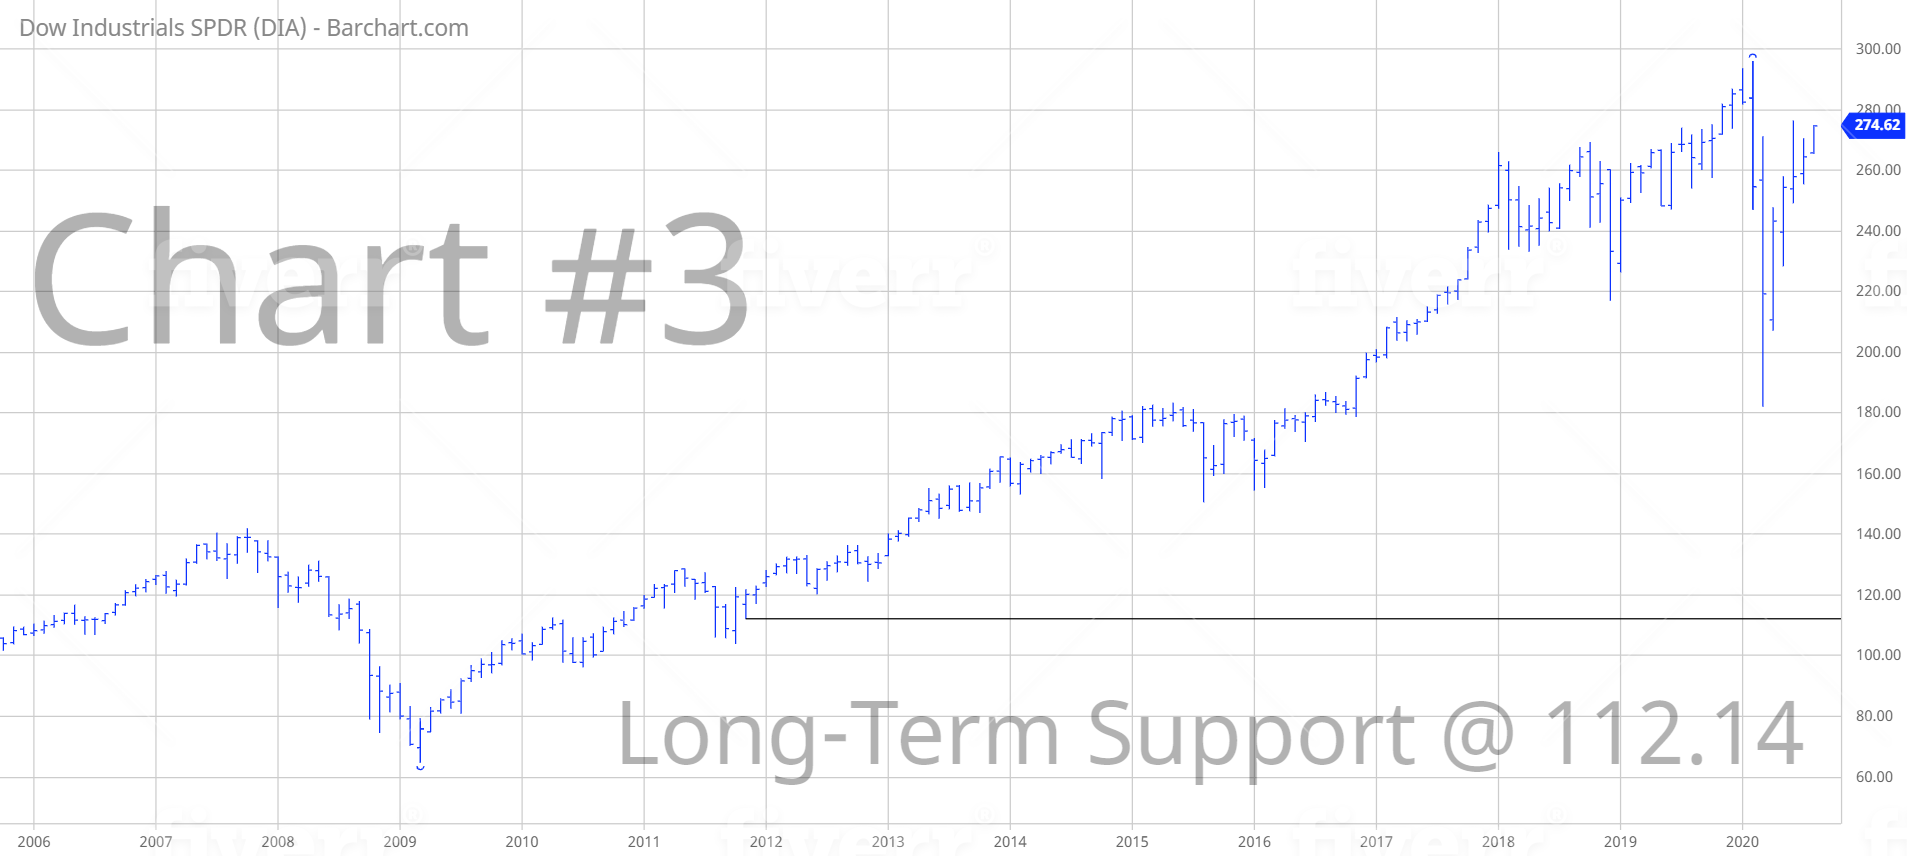
LONG-TERM CHART – DIA ETF
Please review the 15-year chart of DIA (Chart #3). With the exception of Q1 2009, the long-term (secular) chart pattern has remained bullish since the day DIA was launched on 14 January 1998. The likelihood of a secular bear market appears rather remote. The major support level is 112.14.