

iShares MSCI Emerging Markets ETF (EEM)
Key Statistics
Short-Term Trend Bearish
Thank you for reading this post, don't forget to subscribe!Intermediate-Term Trend Bearish
Long-Term Trend Bullish
Minor Support Level 44.55 Minor Resistance Level 47.52
Major Support Level 27.61 Major Resistance Level 50.43
Minor Buy Signal 47.93 Minor Sell Signal 44.09
Major Buy Signal 52.49 Major Sell Signal 24.72
BRIEF OVERVIEW – iShares MSCI Emerging Markets ETF
Based on long-term historical data, emerging market economies have generated the greatest amount of volatility among all economic groups during the past several decades. Of course, volatility produces opportunity, particularly in terms of investments.
Let’s briefly explore the emerging market economies in an effort to understand their volatile nature. A good place to begin is by providing a proper definition of an emerging market. An emerging market is a country with an economy that is in the process of becoming a developed market economy. Emerging markets contain many of the characteristics of developed markets. However, they are not quite fully capable of rising to the level of developed markets. For example, countries with an emerging market economy have access to capital markets, unified currency, regulatory framework and the ability to create sustainable economic growth for its citizens. However, these countries typically fall short in the area of infrastructure, liquid financial markets and business development.
As a general rule, most economic think tanks and organizations prefer to divide national economies into three different categories. These categories include developed markets, emerging markets and frontier markets. The frontier markets are trying to reach the status of emerging markets, while the emerging markets are trying to become developed markets.
Please review the attached table, which includes a partial list of countries in each category.
Developed Markets Emerging Markets Frontier Markets
Australia Brazil Columbia Canada China Egypt
Germany India Indonesia
Japan Ireland Nigeria
New Zealand Italy South Africa
UK Russia Turkey
USA Spain Vietnam
Obviously, this is not a complete list of all countries. However, it does provide a point of reference for each category.
Why do emerging market countries display more volatility than countries in developed markets? There are several reasons why emerging markets are inherently volatile. The list includes political instability, poor corporate governance system, reduced liquidity, foreign exchange risk and lax insider trading rules. However, the main reason for increased volatility actually comes from outside the emerging market countries. In other words, it’s an external problem. It involves the flow of capital.
During the past few decades, one could argue that emerging market countries have been locked in a vicious cycle of capital flows. Money rushes into and out of these countries quite quickly. The majority of this problem can be traced back to aggressive speculators who tend to be momentum traders, trying to capture the next big move. Of course, there’s nothing inherently wrong with trend followers and momentum traders speculating in emerging market countries. In fact, it adds much needed liquidity to these markets. However, it does introduce a level of erratic price behavior to an already volatile environment.
Whether we like it or not, emerging markets have a history of attracting the “fast money” crowd. Most likely, this trend will continue as long as these markets remain volatile.
In an effort to expose investors to emerging market economies, BlackRock introduced an emerging market ETF through its iShares family of exchange traded funds. The ETF began trading on April 7, 2003, under the ticker symbol EEM. The ETF gives investors access to large and mid-size companies throughout the emerging markets universe. Specifically, EEM consists of 859 different companies. The top three countries within the ETF include China, South Korea and Taiwan.
SHORT-TERM VIEW – iShares MSCI Emerging Markets ETF
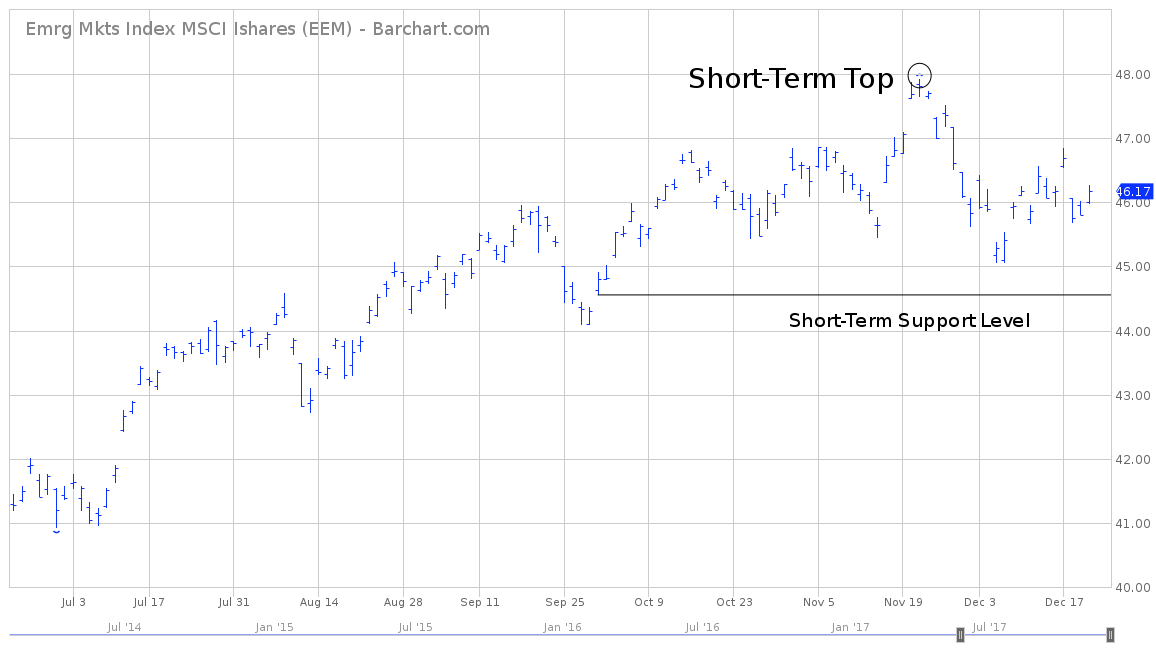
EEM has performed exceptionally well throughout the entire year of 2017. However, it does appear the ETF generated a short-term top on Nov 22nd @ 47.93. Despite the recent decline, EEM investors have enjoyed a 31.7% rate of return for 2017.
The bears are in control of the short-term trend. A weekly close above 47.52 would push the momentum in favor of the bulls. Most likely, a more pronounced decline will occur if EEM produces a weekly close below 44.55.
LONG-TERM VIEW – iShares MSCI Emerging Markets ETF
As we previously discussed, emerging market investments are inherently volatile. In all likelihood, this erratic behavior will continue well into the future. For the next several years, the driving force behind the volatility (in addition to massive capital flows) will be China and India. These two countries are in the process of transiting from emerging markets to developed markets. As this process unfolds, we can expect China and India to encounter “growing pains” in their respective economies. Consequently, this will cause investors and analysts to alter their economic forecasts for these two countries. Of course, this is a
long-term process which will play out over the next decade or longer.
If we step back and take a big picture view of emerging markets, the landscape looks rather bright. In fact, emerging market countries are in a “sweet spot” in terms of economic performance. Generally speaking, this is true for most countries throughout the globe. The global economy appears to be in a rare environment where the vast majority of economies are enjoying positive economic growth. This type of synchronized growth only occurs about once every 15 years. It usually doesn’t last very long. However, at least for now, the emerging markets are taking full advantage of this global economic growth spurt.
The past two years have been especially rewarding for emerging market investors. Since January 2016, EEM has increased 43.3%. However, the long-term view of EEM is rather neutral. Essentially, the EFT has been trading sideways for the past 8 ½ years, between
27 & 50. In order to bust out of the trading range, the bulls need to generate a weekly close above 50.43. A weekly close below 27.61 will turn the long-term momentum in favor of the bears.
Based on the current condition of EEM, the most likely scenario is a bullish breakout above 50.43. A weekly close above 50.43 opens the door to the all-time high @ 55.83.
SHORT-TERM CHART
Please review the attached 6-month chart of EEM. The short-term chart pattern is bearish.
The bulls need a weekly close above 47.52 in order to push the momentum in their favor. A weekly close below 44.55 would most likely create additional selling pressure.
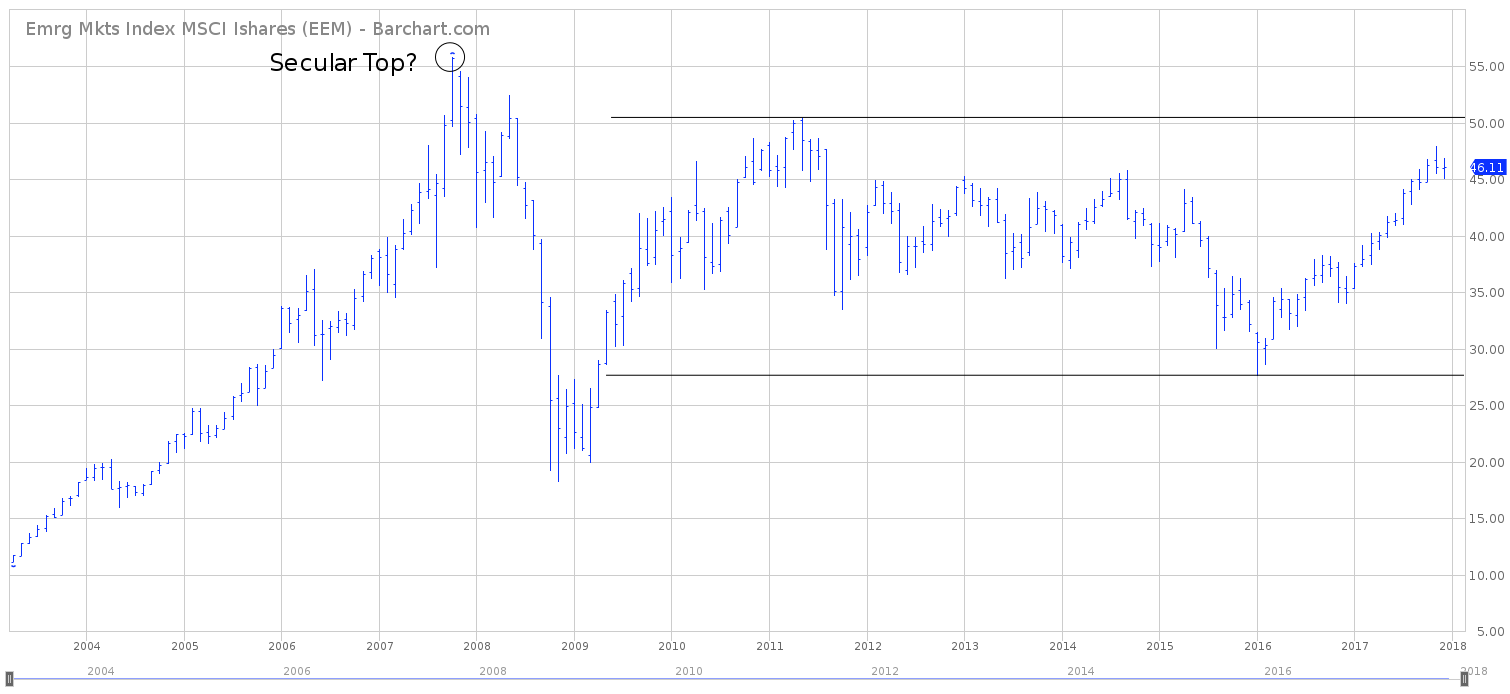
LONG-TERM CHART
Please review the attached 14-year chart of EEM. The ETF has been locked in a trading range for 8 ½ years. The important numbers to watch are 27.61 & 50.43. Based on the current chart pattern, a weekly close above 50.43 is the more plausible outcome. One could argue that EEM generated a secular top in October 2007 @ 55.83. However, the jury’s still out on this forecast. At the very least, it would take a weekly close below 27.61 to consider the fact that 55.83 was indeed a secular top.

