VanEck Vectors Gold Miners ETF (GDX)
Key Statistics (as of close 12/14/17)
Thank you for reading this post, don't forget to subscribe!Daily High 22.17 Short-Term Trend Bearish
Daily Low 21.80 Intermediate-Term Trend Bearish
Daily Close 22.08 Long-Term Trend Bearish
Minor Support Level 20.99 Minor Resistance Level 23.88
Major Support Level 12.40 Major Resistance Level 47.53
Minor Buy Signal 24.20 Minor Sell Signal 20.45
Major Buy Signal 48.29 Major Sell Signal 11.69
BRIEF OVERVIEW Gold Miners ETF GDX
Without question, one of the most emotional topics within the investment community is the gold market. It seems that everyone has an opinion on the yellow metal. Almost universally, the opinion is either extremely bullish or extremely bearish. Very few investors are neutral on gold. They either love it or hate it.
Why does gold illicit such passionate comments & responses from the investing public? Most likely, the answer is based on the fact that gold is very difficult to accurately value. After all, it is probably the only commodity that is driven by emotional factors instead of supply/demand valuations. Generally speaking, the price of gold generates its largest price moves in response to major financial shocks, international crises and geopolitical events. In essence, gold is a hedge against chaos. This explains why it is so difficult for traders and investors to properly forecast.
The VanEck family of mutual funds launched the gold miners ETF on May 16, 2006, using the ticker symbol GDX. The ETF consists of 52 different holdings. GDX is one of the purest gold plays among all precious metals ETFs. All 52 listings are heavily involved in the gold mining industry. The top five holdings include Newmont Mining, Barrick Gold, Franco-Nevada, Newcrest Mining and Goldcorp. These companies rise and fall almost exclusively with the price of gold. Therefore, GDX is a great proxy for gold.
SHORT-TERM VIEW Gold Miners ETF GDX
GDX formed an important short-term top on Sep 7th, @ 25.58. The ETF has been drifting relentlessly lower for the past three months. The bears are in complete control of the
short-term momentum. The next support level is 20.99. In order to reverse the trend, the bulls need a weekly close above 23.88.
Based on the Aroon Oscillator, GDX has a slightly oversold reading of -40. The Aroon Oscillator is programmed differently than most stochastic indicators. The oscillator fluctuates between
-100 and +100. A reading of 0 would indicate a neutral position. Therefore, a reading of -40 with GDX is moderately oversold. However, the ETF could easily generate another sharp leg to the downside before it becomes extremely oversold.
LONG-TERM VIEW Gold Miners ETF GDX
Given the fact that GDX is heavily influenced by the gold market, let’s take a long-term view of the yellow metal. Currently, there are two schools of thought concerning the future direction of the gold market. It’s a battle between the bulls and the bears.
Those in the bullish camp argue that gold is in a multi-year (secular) bull market which began in August 1999. Based on their analysis, gold formed a mid-cycle top in September 2011. The market has been in a period of consolidation for the past six years. They claim the final leg of this secular bull market will carry gold to much higher prices over the course of the next 3 to 5 years (2018 to 2022).
Those in the bearish camp have a completely different view of gold’s future direction. They believe the secular bull market ended in September 2011, @ $1,920 per ounce. According to their interpretation of the market, gold is in the midst of a secular decline which will continue for the next several years. The bears conclude that deflation will remain heavily entrenched in the global economy well into the next decade. They are projecting a final low near $400 per ounce.
Which forecast is correct? Both sides appear to have a valid argument. However, based on previous long-term trends, the bullish camp has history on its side. There is conclusive historical evidence which suggests that secular trends typically last 20 to 25 years. Given the fact that gold’s secular bull market began in 1999, the final top should occur in the early 2020s.
Most likely, gold will enjoy one final push to the upside during the next few years.
Of course, there is no rule which says that all secular trends must continue for 25 years. In fact, there are several historical examples which verify that long-term price trends will occasionally come to an abrupt end after only 10 to 12 years. Therefore, it’s quite possible the secular bull market for gold may have reached its climax in 2011. However, the preponderance of the evidence is in favor of the bulls.
The long-term view of GDX is unquestionably bearish. The market formed a major top in September 2011. Over the course of the next 4 ½ years, GDX drifted relentlessly lower. Each feeble rally was met with heavy selling pressure. The selling pressure may have ended in January 2016, when GDX recorded an all-time low of 12.40. However, it’s still much too early to conclude that January 2016, was indeed the final bottom of this brutal bear market.
The bears are comfortably in control of GDX from a long-term perspective. The bulls need a monthly close above 47.53 in order to regain control. Essentially, GDX must double in value to change the trend from bearish to bullish. Therefore, at least for the next several months, the bears definitely have the upper hand in regards to the longer term trend.
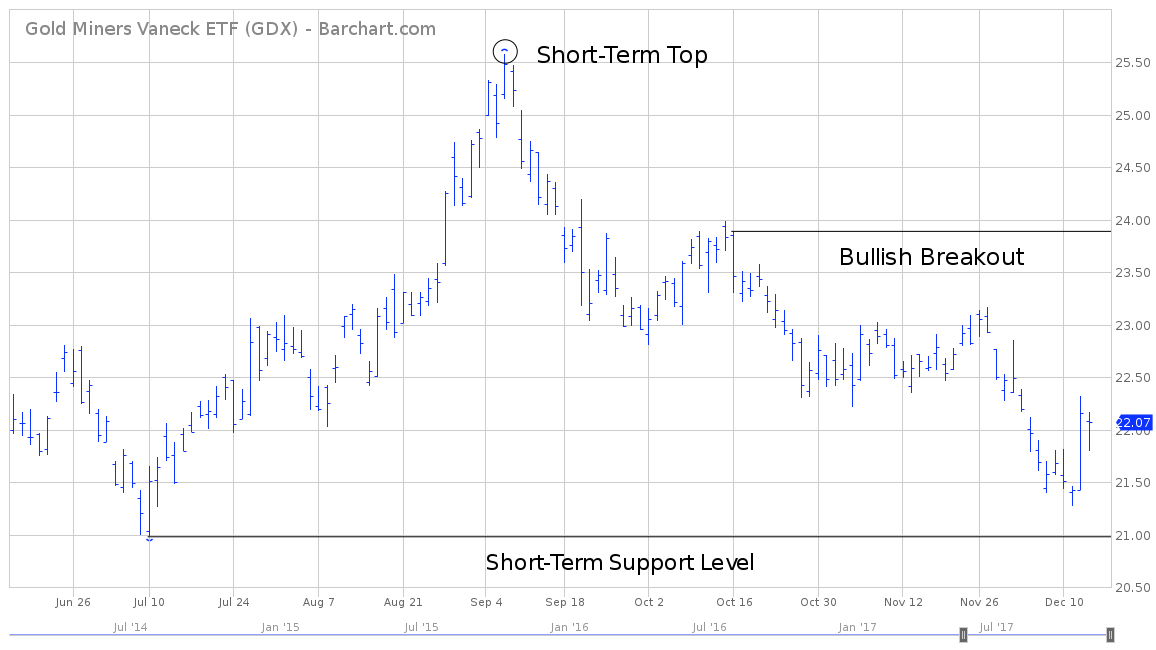
SHORT-TERM CHART – GDX
Please review the attached 6-month chart of GDX. The bears have been pushing GDX lower for the past 90 days. The chart pattern turns decidedly bearish on a weekly close below 20.99. A short-term bullish breakout occurs on a weekly close above 23.88.
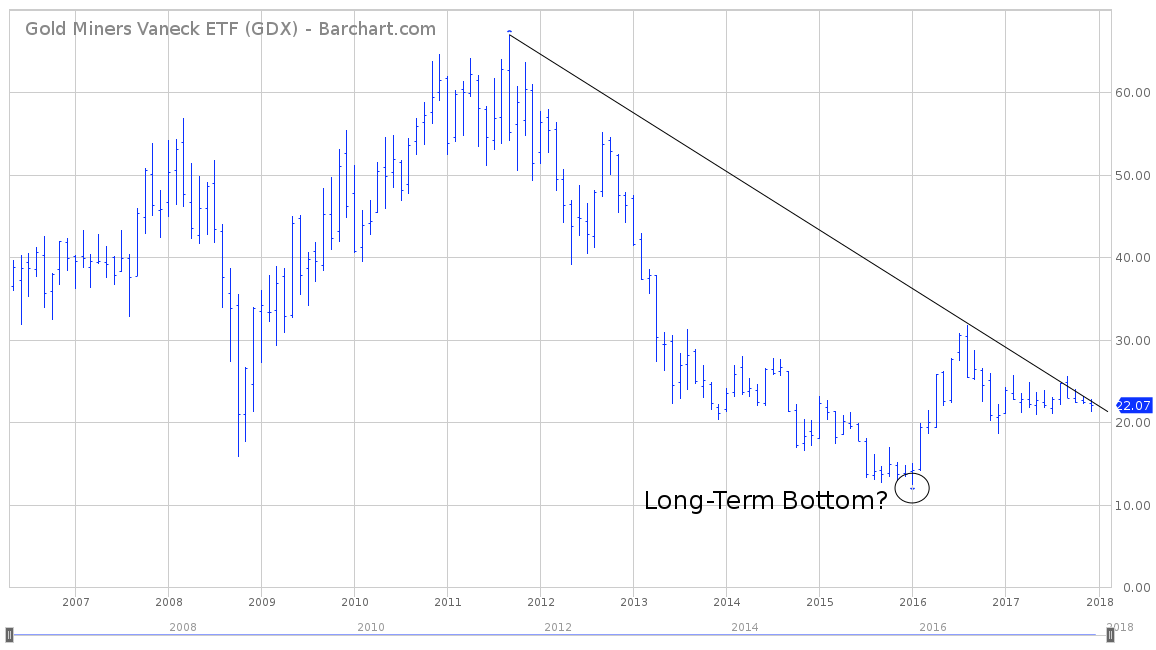
LONG-TERM CHART GDX
Please review the attached long-term chart of GDX. This chart dates back to the inception of GDX in May 2006. Most likely, an important long-term bottom was formed in January 2016, @ 12.40. The bearish trendline was broken in September 2017. However, GDX needs to generate a more convincing breakout. At the very least, the bulls must produce a weekly close above 31.79. However, the long-term chart won’t turn bullish until the ETF closes above 47.53 on a weekly basis.

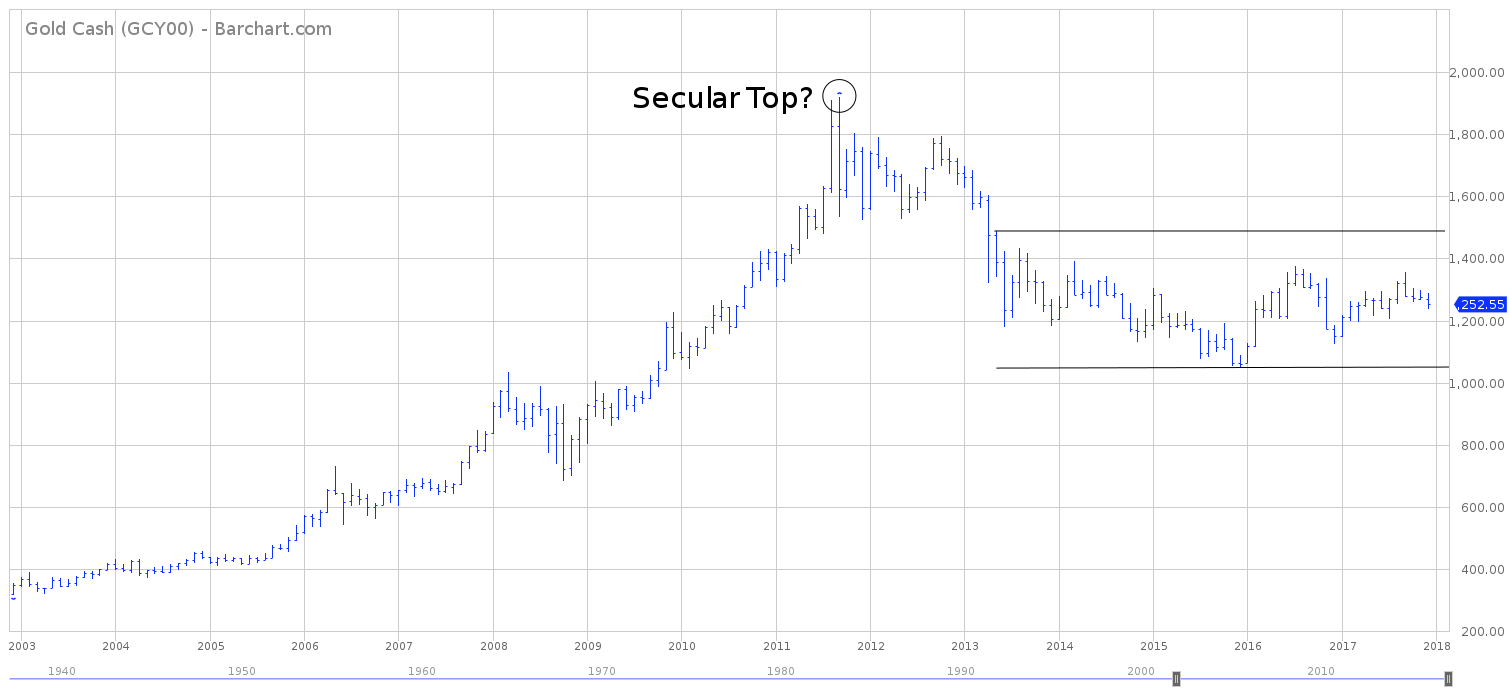
GOLD CHART – Gold Cash
Very briefly, let’s review a 15-year chart of gold. The bears claim that gold formed a multi-year secular top in September 2011. However, the jury’s still out on this forecast. It could go either way. Most likely, the tug-of-war between the bulls and the bears will be decided when gold achieves a decisive breakout from its current trading range. Gold has been trading sideways for 4 ½ years. The important numbers to watch are 1046 & 1487.