Key Statistics
Weekly High 23.20 Short-Term Trend Bullish
Weekly Low 22.02 Intermediate-Term Trend Bullish
Weekly Close 23.15 Long-Term Trend Bullish
Minor Support Level 21.48 Minor Resistance Level 23.86
Major Support Level 12.40 Major Resistance Level 47.53
Minor Buy Signal 24.11 Minor Sell Signal 21.22
Major Buy Signal 48.29 Major Sell Signal 11.69
SHORT-TERM VIEW
Despite the bullish price action during the past few trading days, ETF GDX continues to remain locked in a tight trading range. Essentially, GDX has been moving sideways for the past six months. The trading range is 21 to 25.
In response to the bullish price action of the past few days, all three of the trend indicators have moved into bullish territory. At least for now, the bulls have recaptured the upside momentum. In order to generate a more sustainable breakout, the bulls need a weekly close above 23.86. If the bears want to reestablish the upper hand, they must push GDX below 21.48 on a weekly closing basis.
Even though the trend indicators have turned rather bullish, the most likely scenario for GDX over the course of the next several weeks, is a continuation of the trading range. At this point, a sustainable bullish breakout appears rather unlikely. Weekly closes above 23.86 & 24.11 would certainly help build the case for a more longer term bullish advance.
LONG-TERM VIEW
The long-term view of GDX is unquestionably bearish. The market formed a major top in September 2011. Over the course of the next 4 ½ years, ETF GDX drifted relentlessly lower. Each feeble rally was met with heavy selling pressure. The selling pressure may have reached its final climax in January 2016, when GDX recorded an all-time low of 12.40. However, despite the healthy rally during the past 18 months, it’s still much too early to conclude that January 2016 was indeed the final bottom of this brutal bear market.
The bears are comfortably in control of GDX from a long-term (secular) perspective. The bulls need a monthly close above 47.53 in order to regain control of the “big picture” secular trend. Essentially, etf GDX must double in value to change the secular trend from bearish to bullish. Therefore, at least for the next several months, the bears definitely have the upper hand in regards to the longer term trend.
Of course, the price of GDX is heavily influenced by the gold market. It should come as no big surprise that gold reached its peak in September 2011, right in line with GDX. Although gold and GDX do not always move in perfect harmony, these markets are highly correlated. Therefore, in order to obtain a more accurate outlook for GDX, we need to examine the price of gold.
Based on the recent price behavior of gold, it’s rather difficult to generate an accurate forecast. Very similar to GDX, gold has been locked in a trading range for an extended period of time. Therefore, the next “big move” in gold could go in either direction.
Despite the recent surge, the bears are in control of the gold market. Based on the technical indicators, it’s difficult to build a bullish case for gold until the market produces a weekly close above 1375. A weekly close below 1195 would be quite detrimental to the gold bulls.
Currently, there are two schools of thought concerning the long-term (secular) view of gold. The first school of thought belongs to the bearish camp. According to the gold bears, the secular bull market for gold ended in September 2011 @ 1920. They believe prices will drift lower for the next 10 to 15 years as the global economy enters a prolonged period of deflation. They conclude that gold will ultimately revisit the 400 level by the mid-2020s.
The second school of thought offers a dramatically different view. It is based on an extremely bullish outlook for gold. The bullish camp claims gold is still in a multi-year bull market which began in the Fall of 2001. Based on their forecast, the current 6-year decline is simply a healthy consolidation phase, as gold attempts to digest its huge advance from 2001 thru 2011. They believe gold entered its final bullish phase in November 2015, when the price hit bottom @ 1046. This final bull run will reach its conclusion in the early 2020s with a final top near the 5000 level.
Both schools of thought are quite plausible. Eventually, the market will determine the winner of this tug-of-war between the bulls and the bears. Of course, the future price direction of GDX will be heavily influenced by the long-term movement of gold.
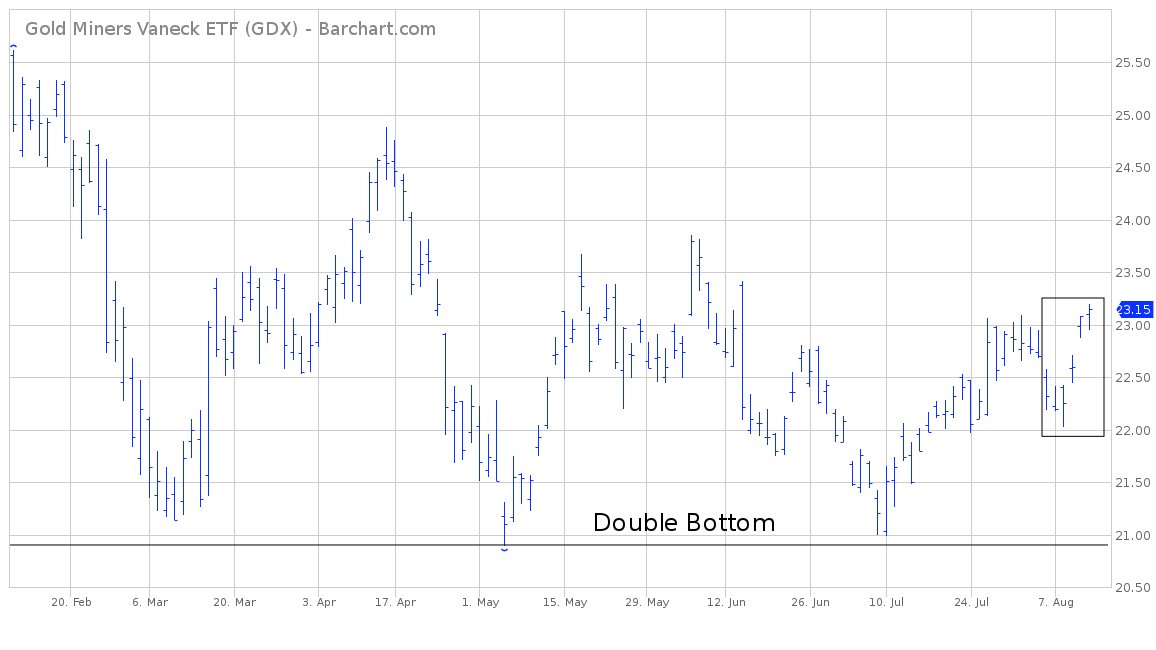
SHORT-TERM CHART
Please review the attached 6-month chart of GDX. As you can see, the market produced two bullish “breakaway gaps” last week. More importantly, it appears GDX formed an important double bottom near the 21 level (horizontal line). At least for now, the bulls have control of the short-term trend. A weekly close above 23.86 would certainly bolster the bullish argument for higher prices.

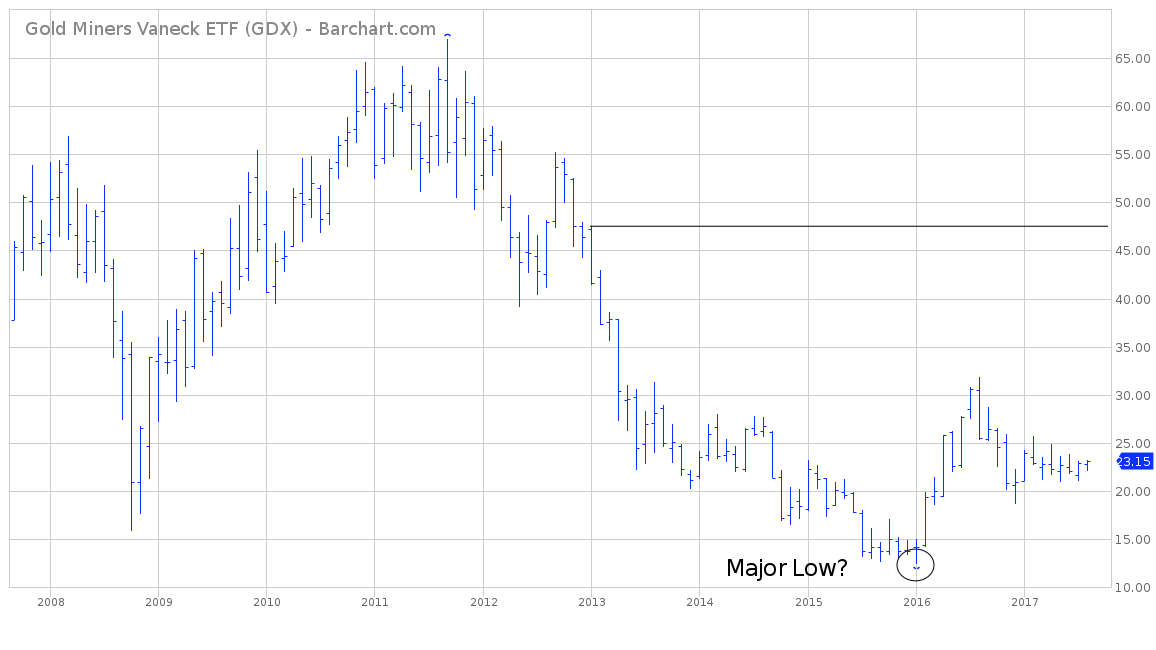
LONG-TERM CHART
Attached, you will find an 10-year chart of the ETF GDX. Based on the long-term chart pattern, GDX is still clearly in a bear market (which officially began in September 2011). An argument could be made that GDX formed an important bottom in January 2016 @ 12.40. However, the bulls need a close above 47.53 to confirm January 2016 as a long-term bottom (horizontal line).
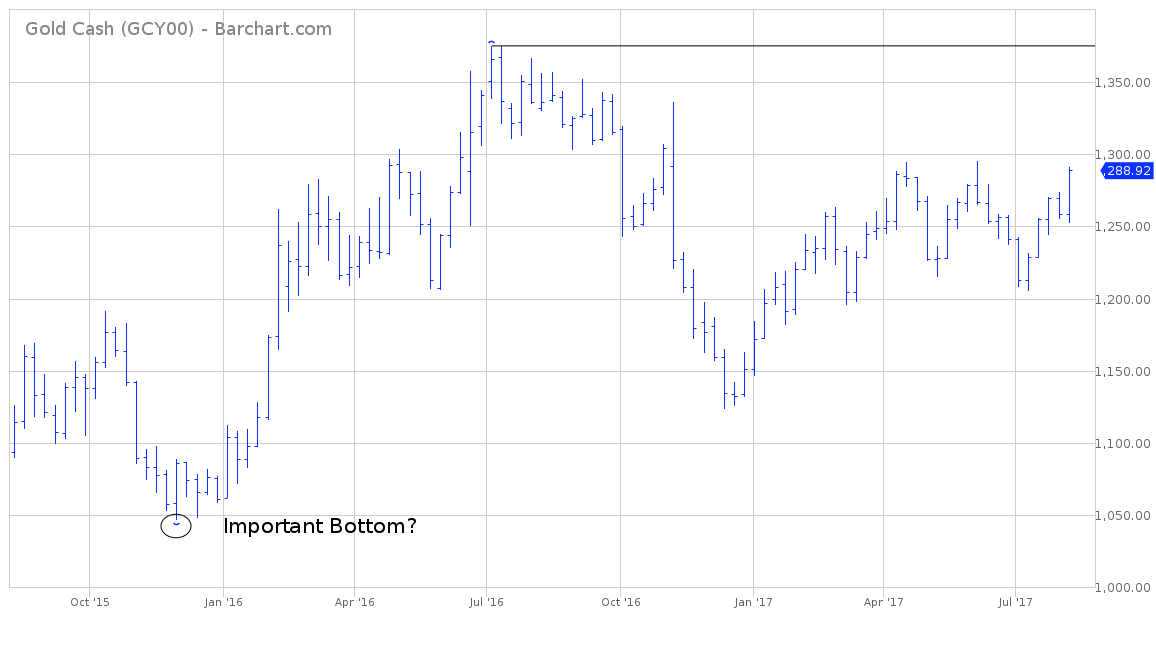
GOLD CHART
Please review the attached 2-year chart of gold. Currently, this chart is neutral. The next big move for gold could go in either direction. A weekly close above 1375 (horizontal line) will confirm that November 2015 marked an important bottom. Gold has the potential to move sharply higher over the course of the next few years. However, it’s difficult to build a bullish argument until the market penetrates 1375 on a weekly closing basis.