

Thank you for reading this post, don't forget to subscribe!
Short-Term Trend Bearish
Intermediate-Term Trend Bearish
Long-Term Trend Bearish
Cyclical Trend Bearish (turns bullish on a monthly close above 83.66)
Secular Trend Bullish (turns bearish on a monthly close below 37.40)
SHORT-TERM VIEW
XLE has been in a relentless decline for the entire year of 2017. Each rally during the past several months has been met with aggressive selling pressure. Based on the short-term indicators, the most recent “dead cat bounce” probably ended on July 28th @ 67.13.
Four of the trend indicators are in bearish territory, which signals additional price deterioration. Without question, the bears are firmly in control of this market. The next short-term support level is 64.73. The bulls need a close above 67.21 in order to capture the upside momentum.
Based on the current short-term view of XLE, there’s no reason to expect the market to
generate any type of sustainable rally. XLE is firmly entrenched in a pattern of lower lows and lower highs, which is a classic definition of a bear market.
XLE is simply one of many commodity based ETF sectors currently trading in bear market territory. However, this is not the beginning of a long-term secular bear market for this sector of the global economy.
Clearly, XLE has been struggling in bear market territory for the past several months. However, XLE (along with similar commodity based ETF sectors) is in the late stages of carving out an important bottom. There’s no reason to expect an important bottom any time in the immediate future. Nevertheless, the XLE bear market is much closer to the end versus the beginning.
LONG-TERM VIEW
The long-term view of XLE is noticeably different versus the short-term view. Obviously, XLE is in the midst of a fairly brutal short-term bear market. However, the long-term view of XLE paints a much more bullish picture.
Generally speaking, all commodities have been in a long-term secular bull market since the early 2000s. This includes the energy sector. The majority of these commodities reached an important top in 2012 & 2013. The entire commodity sector was way overdue for a healthy correction (after enjoying a continuous bull market for over a decade).
The past few years have witnessed a fairly brutal decline in the commodity universe. This decline certainly affected XLE and other similar ETF sectors. However, we are not in the early stages of a new secular bear market for commodities (or the ETFs which represent those commodities like XLE). Instead, this is nothing more than a cyclical bear market within the confines of a multi-year secular bull market.
The “big picture” view of XLE continues to remain quite robust as long as the price stays above 37.40 (on a monthly closing basis). A monthly close above 91.42 would reignite the secular bull market in XLE.
These days, the overwhelming majority of Wall Street economists are firmly entrenched in the belief that deflation will persist for several years into the future. If this forecast is correct, XLE will certainly slip into a secular bear market within the next few years.
However, at least for now, it appears that the deflationary pressures of the past few years are beginning to subside rather quickly. Based on this current pattern, it won’t take long for inflationary forces to rule the global economic landscape. Based on this scenario, XLE will eventually penetrate 91.42 (on its way to a new all-time high above 101.52).
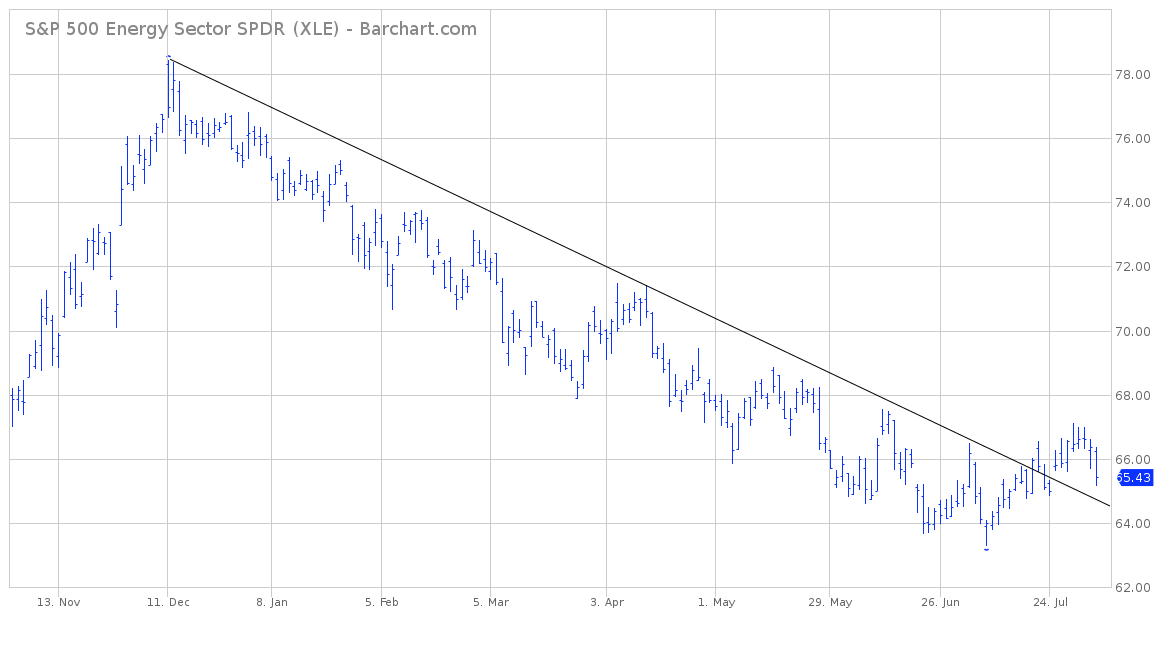
SHORT-TERM CHART
Please review the attached 9-month chart of XLE. As you can see, the downtrend line was finally penetrated on July 19th @ 65.64. XLE is most likely in the final stage of forming an important short-term bottom. However, it’s still much too early to conclude that a final low has been established. At the very least, it would take a weekly close above 67.21 to confirm a possible bottom.
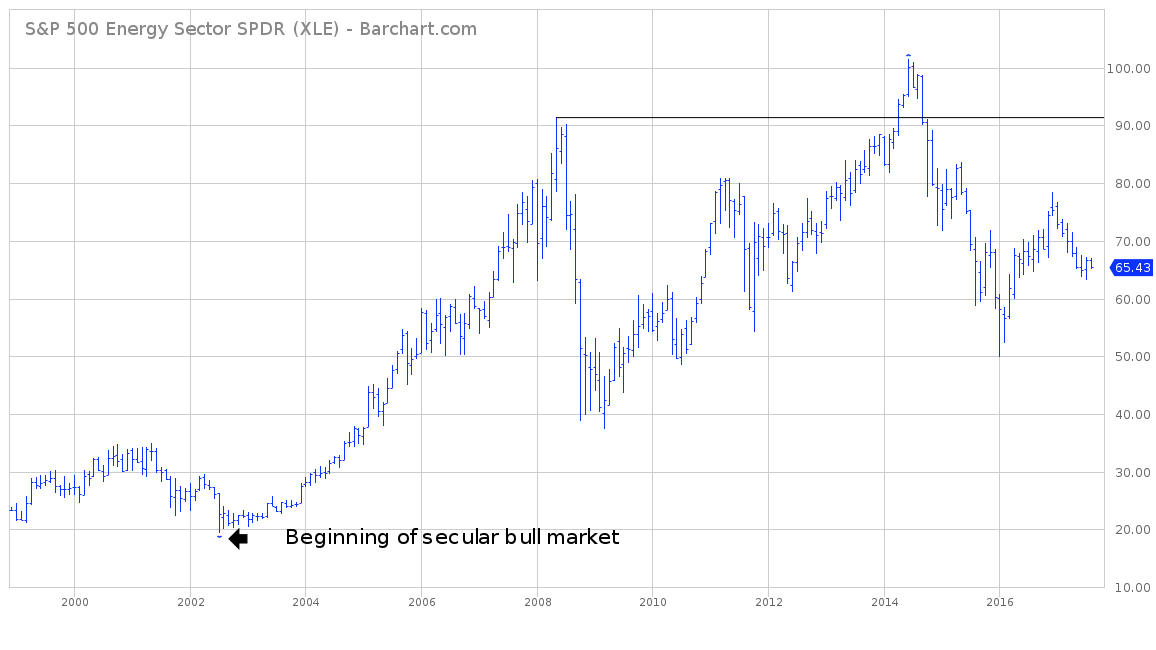
LONG-TERM CHART
Attached, you will find an 18-year chart of XLE. Based on the long-term chart pattern, XLE is still clearly in a secular bull market (which officially began in July 2002). This bull market will reignite on a monthly close above 91.42 (horizontal line). It would take a monthly close below 37.40 to start a new secular bear market. This scenario seems rather unlikely, given the current long-term chart formation.
SHORT-TERM BUY/SELL LEVELS LONG-TERM BUY/SELL SIGNALS
Bullish breakout @ 67.21 Bullish breakout @ 91.42
Bearish breakout @ 64.73 Bearish breakout @ 37.40
